Recurring Actions:
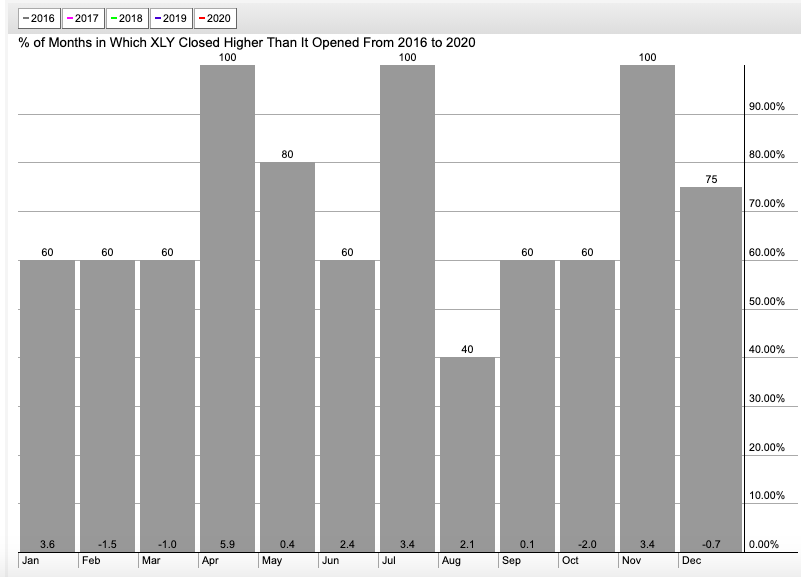
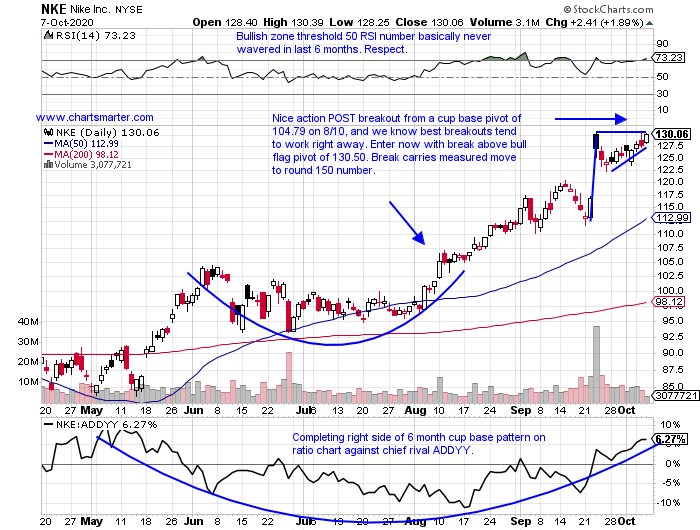
- We all know markets overall are coming into a positive seasonal patterns, and below is the chart of the XLY, and notice if one can look past October, they see the best back to back months during the last 5 years for the ETF. AMZN which is the largest component by far is starting to lag, and it will obviously influence the action, but other top 10 holdings are doing their fair share including NKE and TGT. MCD is hanging tough as well, just 1% off most recent 52 week highs. LOW is just 2% off its recent peak (acting better than HD which is 4% off its recent highs and threatening to lose its 50 day SMA) and sports a bull flag pattern with a breakout above 170 carrying a measured move to 210. Even SBUX seems to be getting its act together after a break above a cup with handle pivot of 80.08 on 8/25 that jumped more than 5% in double average daily volume. Currently it seems to be having issues with the very round 90 number. A burst above that level should give the chart a jolt, pun intended.
"Amazon" of South America:
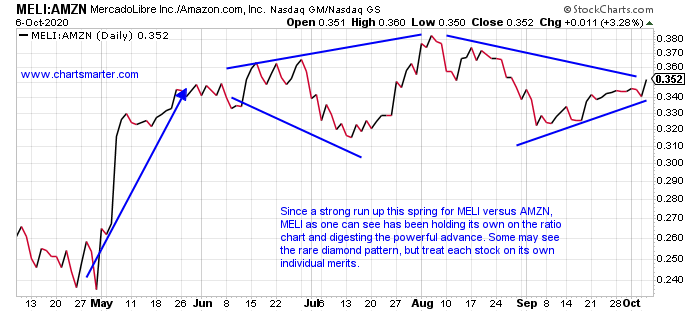
- These two names are often compared to each other, but AMZN is by far a much larger company. MELI has outshined AMZN slightly on a one year look back period up 107% compared to 84%. MercadoLibre broke above an unorthodox looking bearish head and shoulders pattern, and we know from false moves come fast moves. MELI cleared its 50 day SMA, as did AMZN Wednesday (both have spent nearly one month below that important moving average), which sets up a double bottom pattern with a pivot of 1225.10. AMZN lost more than 600 handles during a 3 week losing streak, the first in the last 14 months, the weeks ending between 9/4-18. It did record a bullish piercing line WEEKLY candle the very next week, although they work a bit better near 52 week lows. Dating back to the beginning of 2020, AMZN spent the month of March below its 50 day SMA, before going on a very powerful run. Is it ready now for a similar sprint higher?
Recent Examples:
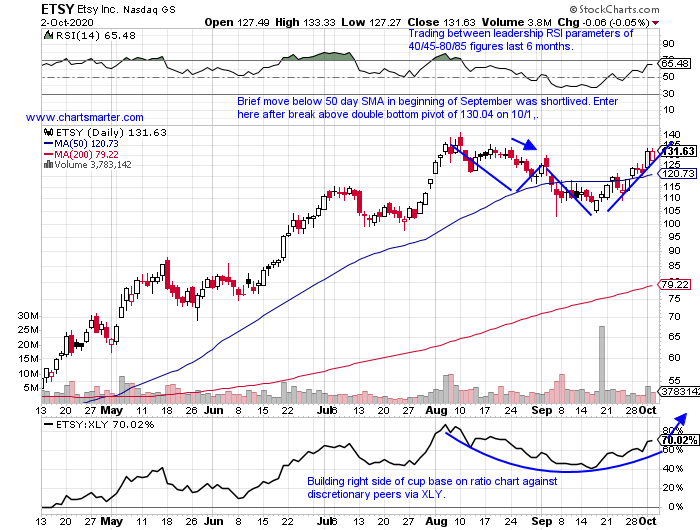
- The "stay at home" names continue to work well, with PTON a very fine example. Currently it looks as if the chart is fatiguing a bit, although to be fair I thought the same thing as it approached the very round par number about one month ago, and then completing a bearish evening star pattern dropping 7% on 9/24 in double average daily volume. It has since done nothing but travel higher, although volume has petered off the last month or so. Below is another name in the space who's ascent has been a bit more gradual, with the chart of ETSY, and how it appeared in our 10/5 Consumer Note. This name found nice support at the very round 100 number one month ago, and has acted well POST breakout above a double bottom pivot of 130.04. Today it CLOSED above a cup base trigger of 141.51. It is looking for a third consecutive WEEKLY CLOSE at the highs for the WEEKLY range, up more than 8% thus far, after the prior two rose by a combined 17%.
Special Situations:
- Footwear leader up 28% YTD and 40% over last one year period. Dividend yield of .7%.
- Rose more than 8% week ending 9/25, and last week rose 1.9% and this week higher again by almost 3%. Looking for ninth WEEKLY gain in last 10, as XLY is lower 3 of the last 5.
- Earnings mostly higher by 8.8, 9.2 and 4.2% on 9/23, 3/25 and 9/25 and losses of 7.6 and 1.2% on 6/26 and 12/20/19.
- Enter with buy stop above bull flag pattern.
- Entry NKE 130.50. Stop 125.
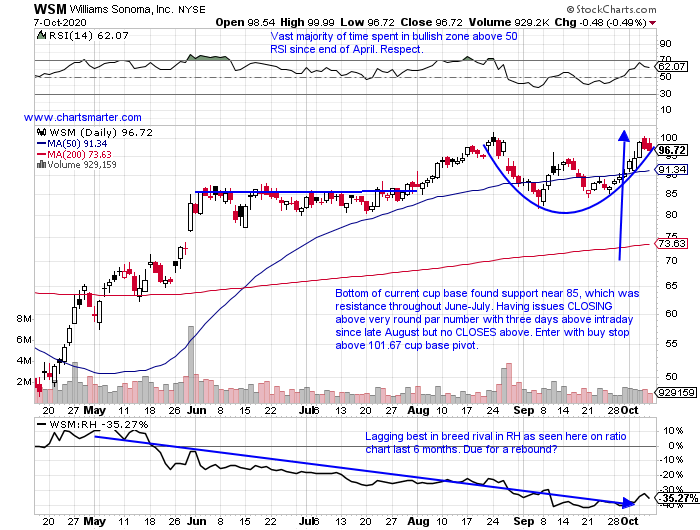
- Specialty retailer higher by 32% YTD and 50% over last one year period. Dividend yield of 2%.
- Just 5% off recent all time highs, and attempting to cut into nasty bearish engulfing WEEKLY candle week ending 8/28 that lost 9.6%.
- Earnings mixed with larger gains of 13.9 and 24.8% on 5/29 and 3/19, and losses of 7.9 and 1.9% on 8/27 and 11/22/19.
- Enter with buy stop above cup base pattern.
- Entry WSM 101.83. Stop 94.50.
- Footwear name higher by 43% YTD and 67% over last one year period.
- Just 1% off recent all time highs, and on current 4 week winning streak. This week higher fractionally, after prior week rose more than 10%, stubborn in giving back any gains.
- Earnings mostly lower with losses of 2.3, 3.3 and 10.2% on 7/31, 10/25 and 7/26/19 (rose 6.7 and 7.6% on 5/22 and 1/31).
- Enter on pullback into recent break above double bottom with handle breakout.
- Entry DECK 235. Stop 220.

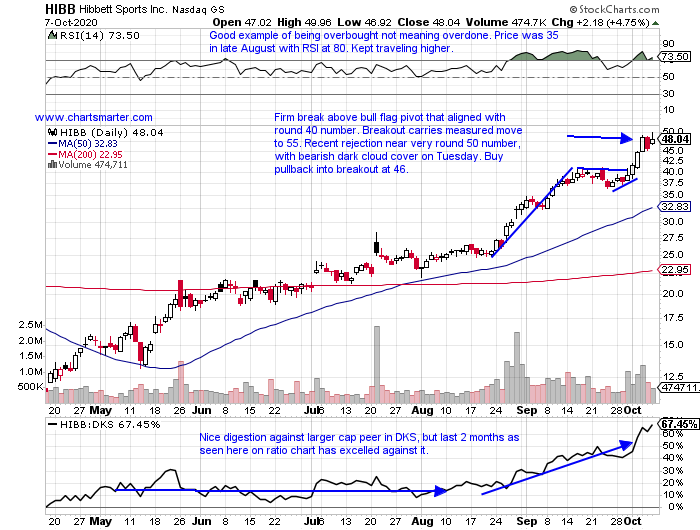
- Specialty retail play higher by 72% YTD and 118% over last one year period.
- Higher 5 of last 6 weeks, with three recent double digit WEEKLY gains of 27.2, 15.5 and 18.5% weeks ending 8/28, 9/11 and 10/2. Was as low at 7 this March.
- Earnings mostly higher with gains of 7.8, 1 and 14.7% on 8/28, 3/20 and 11/22/19 (fell 4% on 5/26).
- Enter on pullback into recent bull flag breakout.
- Entry HIBB 46. Stop 42.75.
Good luck.
Entry summaries:
Buy stop above bull flag pattern NKE 130.50. Stop 125.
Buy stop above cup base pattern WSM 101.83. Stop 94.50.
Buy pullback into recent break above double bottom with handle breakout DECK 235. Stop 220.
Buy pullback into bull flag breakout HIBB 46. Stop 42.75.
This article requires a Chartsmarter membership. Please click here to join.
Recurring Actions:
- We all know markets overall are coming into a positive seasonal patterns, and below is the chart of the XLY, and notice if one can look past October, they see the best back to back months during the last 5 years for the ETF. AMZN which is the largest component by far is starting to lag, and it will obviously influence the action, but other top 10 holdings are doing their fair share including NKE and TGT. MCD is hanging tough as well, just 1% off most recent 52 week highs. LOW is just 2% off its recent peak (acting better than HD which is 4% off its recent highs and threatening to lose its 50 day SMA) and sports a bull flag pattern with a breakout above 170 carrying a measured move to 210. Even SBUX seems to be getting its act together after a break above a cup with handle pivot of 80.08 on 8/25 that jumped more than 5% in double average daily volume. Currently it seems to be having issues with the very round 90 number. A burst above that level should give the chart a jolt, pun intended.
"Amazon" of South America:
- These two names are often compared to each other, but AMZN is by far a much larger company. MELI has outshined AMZN slightly on a one year look back period up 107% compared to 84%. MercadoLibre broke above an unorthodox looking bearish head and shoulders pattern, and we know from false moves come fast moves. MELI cleared its 50 day SMA, as did AMZN Wednesday (both have spent nearly one month below that important moving average), which sets up a double bottom pattern with a pivot of 1225.10. AMZN lost more than 600 handles during a 3 week losing streak, the first in the last 14 months, the weeks ending between 9/4-18. It did record a bullish piercing line WEEKLY candle the very next week, although they work a bit better near 52 week lows. Dating back to the beginning of 2020, AMZN spent the month of March below its 50 day SMA, before going on a very powerful run. Is it ready now for a similar sprint higher?
Recent Examples:
- The "stay at home" names continue to work well, with PTON a very fine example. Currently it looks as if the chart is fatiguing a bit, although to be fair I thought the same thing as it approached the very round par number about one month ago, and then completing a bearish evening star pattern dropping 7% on 9/24 in double average daily volume. It has since done nothing but travel higher, although volume has petered off the last month or so. Below is another name in the space who's ascent has been a bit more gradual, with the chart of ETSY, and how it appeared in our 10/5 Consumer Note. This name found nice support at the very round 100 number one month ago, and has acted well POST breakout above a double bottom pivot of 130.04. Today it CLOSED above a cup base trigger of 141.51. It is looking for a third consecutive WEEKLY CLOSE at the highs for the WEEKLY range, up more than 8% thus far, after the prior two rose by a combined 17%.
Special Situations:
- Footwear leader up 28% YTD and 40% over last one year period. Dividend yield of .7%.
- Rose more than 8% week ending 9/25, and last week rose 1.9% and this week higher again by almost 3%. Looking for ninth WEEKLY gain in last 10, as XLY is lower 3 of the last 5.
- Earnings mostly higher by 8.8, 9.2 and 4.2% on 9/23, 3/25 and 9/25 and losses of 7.6 and 1.2% on 6/26 and 12/20/19.
- Enter with buy stop above bull flag pattern.
- Entry NKE 130.50. Stop 125.
- Specialty retailer higher by 32% YTD and 50% over last one year period. Dividend yield of 2%.
- Just 5% off recent all time highs, and attempting to cut into nasty bearish engulfing WEEKLY candle week ending 8/28 that lost 9.6%.
- Earnings mixed with larger gains of 13.9 and 24.8% on 5/29 and 3/19, and losses of 7.9 and 1.9% on 8/27 and 11/22/19.
- Enter with buy stop above cup base pattern.
- Entry WSM 101.83. Stop 94.50.
- Footwear name higher by 43% YTD and 67% over last one year period.
- Just 1% off recent all time highs, and on current 4 week winning streak. This week higher fractionally, after prior week rose more than 10%, stubborn in giving back any gains.
- Earnings mostly lower with losses of 2.3, 3.3 and 10.2% on 7/31, 10/25 and 7/26/19 (rose 6.7 and 7.6% on 5/22 and 1/31).
- Enter on pullback into recent break above double bottom with handle breakout.
- Entry DECK 235. Stop 220.
- Specialty retail play higher by 72% YTD and 118% over last one year period.
- Higher 5 of last 6 weeks, with three recent double digit WEEKLY gains of 27.2, 15.5 and 18.5% weeks ending 8/28, 9/11 and 10/2. Was as low at 7 this March.
- Earnings mostly higher with gains of 7.8, 1 and 14.7% on 8/28, 3/20 and 11/22/19 (fell 4% on 5/26).
- Enter on pullback into recent bull flag breakout.
- Entry HIBB 46. Stop 42.75.
Good luck.
Entry summaries:
Buy stop above bull flag pattern NKE 130.50. Stop 125.
Buy stop above cup base pattern WSM 101.83. Stop 94.50.
Buy pullback into recent break above double bottom with handle breakout DECK 235. Stop 220.
Buy pullback into bull flag breakout HIBB 46. Stop 42.75.