Glass Half Empty:
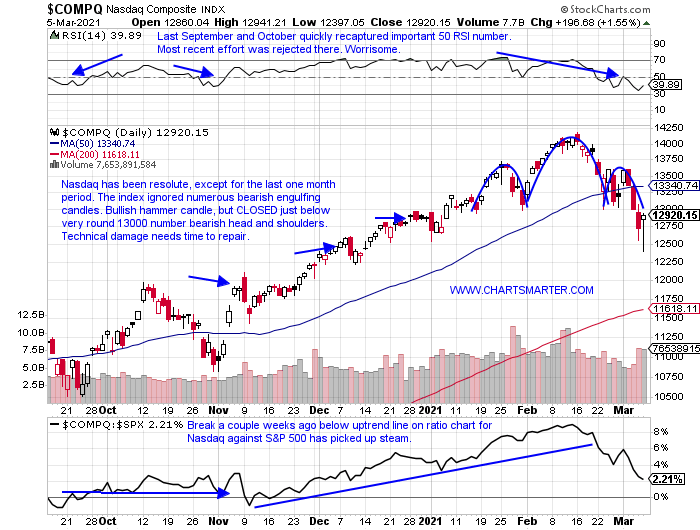
- The best investors I have known, always are more worried about the potential downside. They manage risk appropriately, and let the gains take care of themselves. I would not say they are a melancholy bunch, but a chat with one of them over the weekend, and they may have come away a bit unimpressed with Fridays rally. Give credit to the Nasdaq Friday, CLOSED near highs for the session, with a wide 500 handle plus range. But looking at a more "gloomy" glass half empty view, the tech heavy benchmark still has some work to do. At its lowest intraday level Friday the Nasdaq was 1000 points below its 50 day SMA, and we like to see names/indexes keep in close proximity to the important line. On the chart below we can see there will be some friction Monday as bulls and bears square off at the very round 13000, number, the scene of a head and shoulders breakdown. Will it end up being a bear trap, or over the neat term with the breakdown achieve its measured move to the 12000 figure?
Trend Is Your Friend:
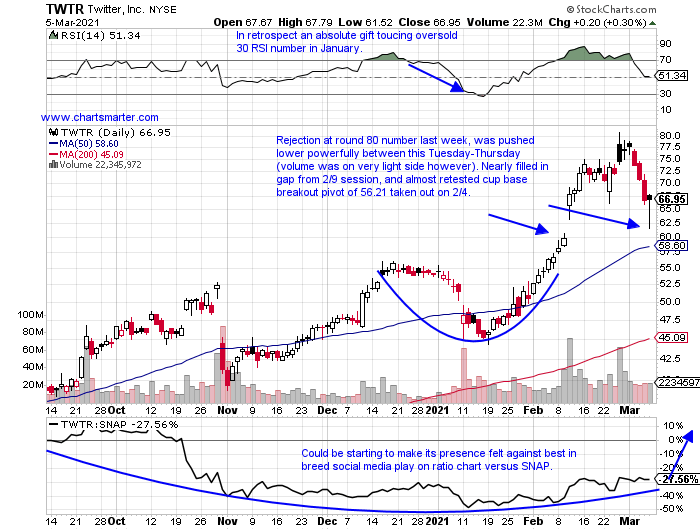
- I always really enjoy pouring over charts after a tumultuous week like we just witnessed. Of course I want to see which names held up best amid the carnage, but there are other things to look for. Surely if a name could not rally Friday, or CLOSED well into the lower half of its intraday range, that may be a red flag. But few tech names, have been able to remain above their upward sloping 50 day SMAs, and these should be applauded. Bonus, if a name never went intraday below the 50 day SMA, as that has to be considered powerful strength in a weak tech sector (XLK lower YTD now by almost 1%). Some charts that must be considered generals are a GOOGL AMBA or SONO. Another name that looks ready for higher PRICES is the chart below of TWTR. It is still 17% off most recent 52 week highs, yet declined just 3 times in all of February. If the Nasdaq resumes its uptrend in a meaningful way expect this one to shine brightly.
Recent Examples:
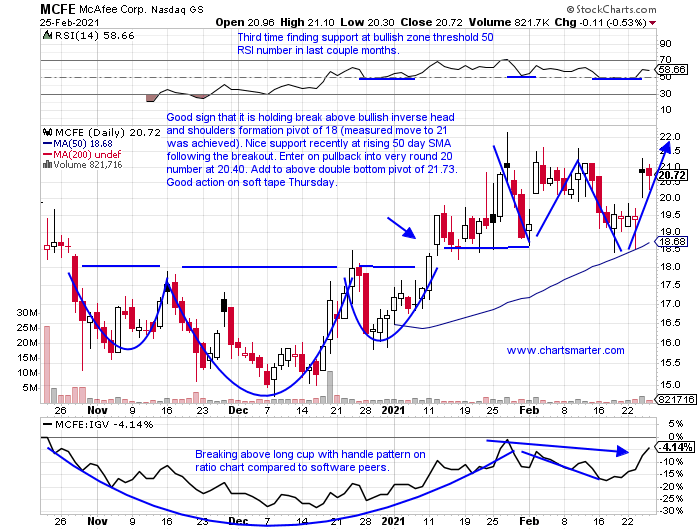
- The software names have been acting weak. If we compare them to their tech semiconductor cousins, the disparity becomes clear. On a YTD basis the SMH is higher by 5%, while the IGV is lower by 5%. On a bit more of a shorter time frame, over the last one month, both have lost ground, but the SMH's decline of 3%, was much better than the IGV's loss of 11%. A name that has been showing some strength within software however is MCFE, and how it appeared in our 2/26 Technology Note. The stock just started trading publicly again, and it is just 5% off most recent highs, a solid stat in a group that has many down more than 20% from their annual peaks. One can see in late February good support at the upward sloping 50 day SMA, after a breakout above a bullish inverse head and shoulders pattern. Now it is just below a double bottom breakout pivot of 21.73 taken out on 3/3, and is holding firm when testing the very round 20 number.
Special Situations:
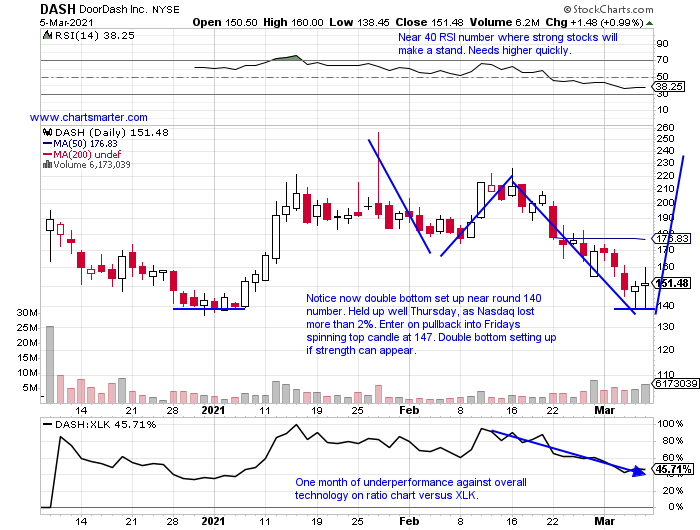
- Internet play higher by 6% YTD, but 16% lower during last one month period.
- Name 41% off most recent highs, and 6 of last 7 weeks have CLOSED in lower half of WEEKLY range. Down a combined 27.5% last 2 weeks in big volume.
- Just one earnings reaction to speak of, and it rose 1.6% on 2/26.
- Enter on pullback into spinning top candle after large decline.
- Entry DASH 147. Stop 138.
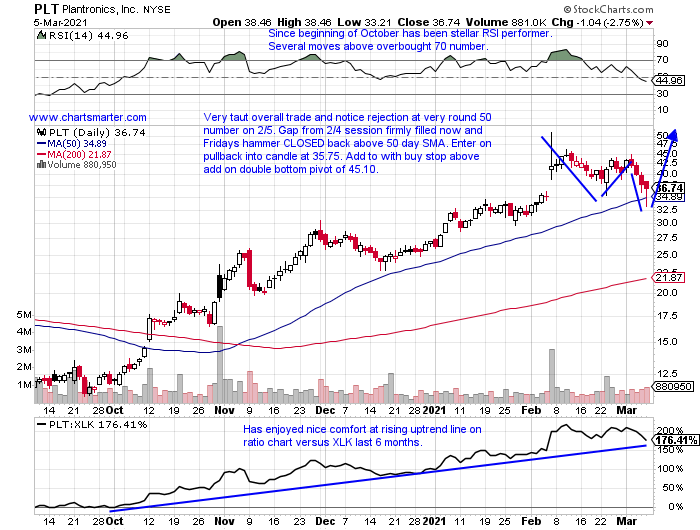
- Communications equipment play up 36% YTD and 205% over last one year period.
- Name still 28% off most recent 52 week highs. Current 3 week losing streak, and has not recorded a 4 week down streak in exactly one year.
- Three strong positive earnings reactions up 19.1, 2.8 and 17.6% on 2/5, 10/30 and 7/29/20, after big losses of 14.2 and 38.4% on 5/28 and 2/5/20.
- Enter on pullback into bullish hammer candle.
- Entry PLT 35.75. Stop 33.
- Software play down 10% YTD, and up just 1% over last one year period.
- Name now 12% off most recent 52 week highs, and lower 7 of last 9 weeks. Not holding up like "value", "old tech" software plays like ORCL or MSFT.
- Earnings mostly lower with losses of 1.1, 3.4, .4 and 5.5% on 2/12, 10/23, 4/24 and 2/7/20 (rose 1.5% on 7/24/20).
- Enter short into very round number.
- Entry VRSN 199. Buy stop 206.

Good luck.
Entry summaries:
Buy pullback into spinning top candle DASH 147. Stop 138.
Buy pullback into bullish hammer candle PLT 35.75. Stop 33.
Short into very round number VRSN 199. Buy stop 206.
This article requires a Chartsmarter membership. Please click here to join.
Glass Half Empty:
- The best investors I have known, always are more worried about the potential downside. They manage risk appropriately, and let the gains take care of themselves. I would not say they are a melancholy bunch, but a chat with one of them over the weekend, and they may have come away a bit unimpressed with Fridays rally. Give credit to the Nasdaq Friday, CLOSED near highs for the session, with a wide 500 handle plus range. But looking at a more "gloomy" glass half empty view, the tech heavy benchmark still has some work to do. At its lowest intraday level Friday the Nasdaq was 1000 points below its 50 day SMA, and we like to see names/indexes keep in close proximity to the important line. On the chart below we can see there will be some friction Monday as bulls and bears square off at the very round 13000, number, the scene of a head and shoulders breakdown. Will it end up being a bear trap, or over the neat term with the breakdown achieve its measured move to the 12000 figure?
Trend Is Your Friend:
- I always really enjoy pouring over charts after a tumultuous week like we just witnessed. Of course I want to see which names held up best amid the carnage, but there are other things to look for. Surely if a name could not rally Friday, or CLOSED well into the lower half of its intraday range, that may be a red flag. But few tech names, have been able to remain above their upward sloping 50 day SMAs, and these should be applauded. Bonus, if a name never went intraday below the 50 day SMA, as that has to be considered powerful strength in a weak tech sector (XLK lower YTD now by almost 1%). Some charts that must be considered generals are a GOOGL AMBA or SONO. Another name that looks ready for higher PRICES is the chart below of TWTR. It is still 17% off most recent 52 week highs, yet declined just 3 times in all of February. If the Nasdaq resumes its uptrend in a meaningful way expect this one to shine brightly.
Recent Examples:
- The software names have been acting weak. If we compare them to their tech semiconductor cousins, the disparity becomes clear. On a YTD basis the SMH is higher by 5%, while the IGV is lower by 5%. On a bit more of a shorter time frame, over the last one month, both have lost ground, but the SMH's decline of 3%, was much better than the IGV's loss of 11%. A name that has been showing some strength within software however is MCFE, and how it appeared in our 2/26 Technology Note. The stock just started trading publicly again, and it is just 5% off most recent highs, a solid stat in a group that has many down more than 20% from their annual peaks. One can see in late February good support at the upward sloping 50 day SMA, after a breakout above a bullish inverse head and shoulders pattern. Now it is just below a double bottom breakout pivot of 21.73 taken out on 3/3, and is holding firm when testing the very round 20 number.
Special Situations:
- Internet play higher by 6% YTD, but 16% lower during last one month period.
- Name 41% off most recent highs, and 6 of last 7 weeks have CLOSED in lower half of WEEKLY range. Down a combined 27.5% last 2 weeks in big volume.
- Just one earnings reaction to speak of, and it rose 1.6% on 2/26.
- Enter on pullback into spinning top candle after large decline.
- Entry DASH 147. Stop 138.
- Communications equipment play up 36% YTD and 205% over last one year period.
- Name still 28% off most recent 52 week highs. Current 3 week losing streak, and has not recorded a 4 week down streak in exactly one year.
- Three strong positive earnings reactions up 19.1, 2.8 and 17.6% on 2/5, 10/30 and 7/29/20, after big losses of 14.2 and 38.4% on 5/28 and 2/5/20.
- Enter on pullback into bullish hammer candle.
- Entry PLT 35.75. Stop 33.
- Software play down 10% YTD, and up just 1% over last one year period.
- Name now 12% off most recent 52 week highs, and lower 7 of last 9 weeks. Not holding up like "value", "old tech" software plays like ORCL or MSFT.
- Earnings mostly lower with losses of 1.1, 3.4, .4 and 5.5% on 2/12, 10/23, 4/24 and 2/7/20 (rose 1.5% on 7/24/20).
- Enter short into very round number.
- Entry VRSN 199. Buy stop 206.
Good luck.
Entry summaries:
Buy pullback into spinning top candle DASH 147. Stop 138.
Buy pullback into bullish hammer candle PLT 35.75. Stop 33.
Short into very round number VRSN 199. Buy stop 206.