Equipment Check:
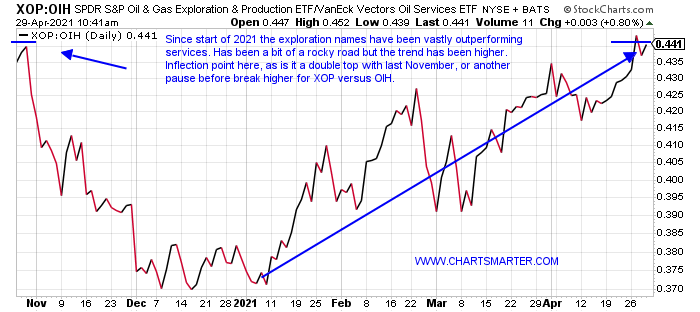
- The energy space continues to put on a solid display of "leadership" in 2021. I put that in quotation marks since many would question that "dubious" command. Often investors like to see strength in technology or consumer discretionary. The overall energy space still has a single-digit representation in the S&P 500, which traditionally is in the mid-teens, so there is plenty of room for the space to move higher. The XLE on a YTD basis is still the best performing major S&P sector up 35%, maintaining a double-digit lead over the second-best actor in the financials. Like any other group, there will be some bifurcation within, and that is illustrated by the ratio chart below comparing the XOP to the OIH. Presently the OIH is 17% off its most recent 52 weeks highs, while the XOP is 10% off its own peak made back last month. The XOP is above its 50 day SMA, while the OIH is not, and on a YTD basis the XOP has advanced 41%, nearly double that of the OIH (OIH has a larger dividend yield of 4.1% compared to XOP at 2.1%). Many may be looking to play mean reversion, but let PRICES confirm that first. If anything one can own both as a "barbell" approach.
The Other FANG:
- We are all aware of the FANG acronym, and give them credit as for the most part they are acting very well. But a former best-of-breed name in the energy space is looking to reclaim that status. For the record, the stock is REPORTING earnings on 5/3 after the close. It has recorded THREE straight positive reactions up 3.8, 1.5, and 2.6% on 2/23, 11/3, and 8/4/20, but of course that is no guarantee a fourth consecutive advance is in the cards. Technically speaking the stock is doing a lot right these days, as it has made a massive run from the teens last October (the group sold off hard last year while the overall market rallied). This week it has risen almost 11% heading into Friday, after losing ground 5 of the prior 7 weeks. It now trades 5% off most recent 52 week highs, made during peaks made the week ending 3/22 that rose more than 23%. A break above the 88.85 cup base pivot, and then a subsequent move above 90, would have the stock reaching par sometime this summer in my opinion.

Recent Examples:
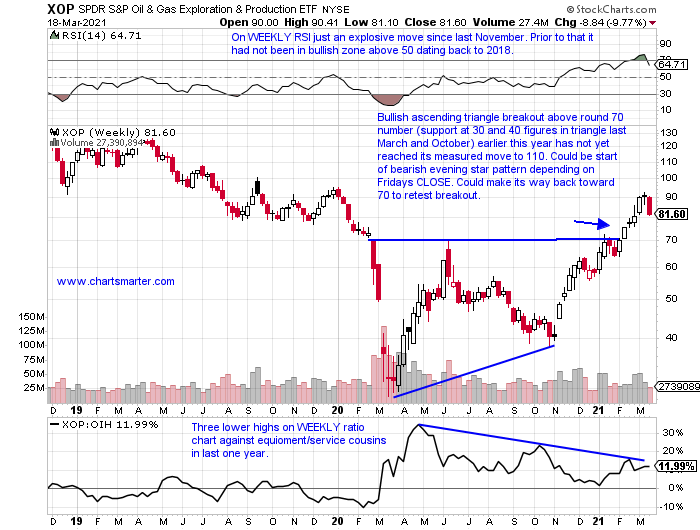
- The exploration plays have been performing well overall in 2021. The WEEKLY chart below of the XOP, and how it appeared in our 3/19 Energy Report, shows how important the round 70 number was in a bullish ascending triangle breakout. The pattern it recorded that week ending 3/19 was a bearish one with an evening star formation, slumping more than 7%, after a run from 30 in March 2020. Sure enough, the XOP went on to retest that move as many breakouts are to test their validity. Since hitting a low near 72 last week, the ETF responded firmly up 9% headed into Friday. It had fallen 5 of the prior 6 weeks, including 2 which fell more than 7 and 8%. On its daily chart, it is approaching a double bottom pivot of 85.79. Look for another leg higher for the energy names, as overall trends tend to persist more likely than they are to reverse.
Special Situations:
- Exploration leader higher by 52% YTD and 59% over last one year period. Dividend yield of 2.2%.
- Most likely will put 3-week losing streak to rest, higher by 10% heading into Friday. Just 1% off most recent 52-week highs. Has gained more than 147% from last October lows to this March's highs.
- Three consecutive negative earnings reactions down 8.5, 2.9, and 4.1% on 2/26, 11/6, and 8/7/20 (rose 6.5% on 5/8/20).
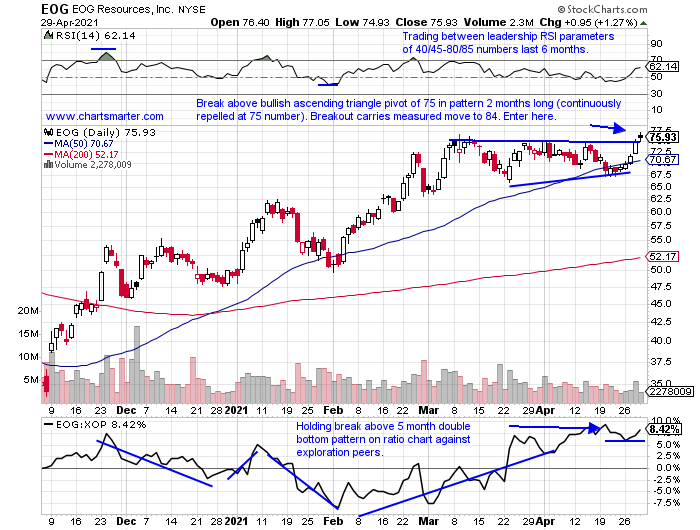
- Enter after break above bullish ascending triangle.
- Entry EOG here. Stop 72 (REPORTS 5/7 before open).
- Exploration play higher by 46% YTD and 58% over last one-year period. Dividend yield of .5%.
- Name bit of laggard in group, down 13% from most recent 52 week highs. Good follow through this week up almost 14%, after prior week rose 2.2%.
- Earnings mixed with losses of 3.3 and .2% on 2/25 and 11/5/20, and gains of 17.3 and 2.3% on 7/30 and 5/7/20.
- Enter on pullback into very round number/double bottom breakout.
- Entry APA 20.25. Stop 19 (REPORTS 5/6 before open).

- Equipment play higher by 47% YTD and 53% over last one-year period. Dividend yield of 2.8%.
- Still 14% off most recent 52 week highs, but up 10.5% this week, fighting back from prior week that fell more than 5%. Traded with a 5 handle last March.
- Three straight negative earnings reactions down 7.6, 5.3, and 3.6% on 1/28, 11/5, and 8/6/20 (rose 2% on 5/7/20).
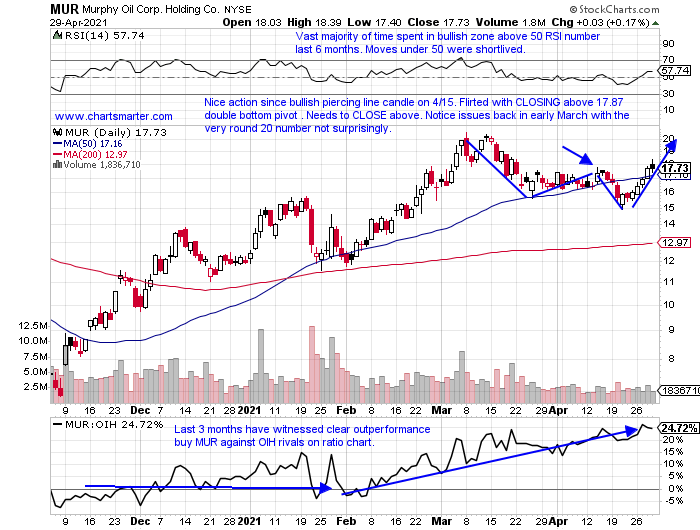
- Enter on breakout above double bottom pattern.
- Entry MUR 17.87. Stop 16.90.
Good luck.
Entry summaries:
Buy pullback into ascending triangle breakout EOG here. Stop 72.
Buy pullback into round number/double bottom breakout APA 20.25. Stop 19.
Buy stop above double bottom breakout MUR 17.87. Stop 16.90.
This article requires a Chartsmarter membership. Please click here to join.
Equipment Check:
- The energy space continues to put on a solid display of "leadership" in 2021. I put that in quotation marks since many would question that "dubious" command. Often investors like to see strength in technology or consumer discretionary. The overall energy space still has a single-digit representation in the S&P 500, which traditionally is in the mid-teens, so there is plenty of room for the space to move higher. The XLE on a YTD basis is still the best performing major S&P sector up 35%, maintaining a double-digit lead over the second-best actor in the financials. Like any other group, there will be some bifurcation within, and that is illustrated by the ratio chart below comparing the XOP to the OIH. Presently the OIH is 17% off its most recent 52 weeks highs, while the XOP is 10% off its own peak made back last month. The XOP is above its 50 day SMA, while the OIH is not, and on a YTD basis the XOP has advanced 41%, nearly double that of the OIH (OIH has a larger dividend yield of 4.1% compared to XOP at 2.1%). Many may be looking to play mean reversion, but let PRICES confirm that first. If anything one can own both as a "barbell" approach.
The Other FANG:
- We are all aware of the FANG acronym, and give them credit as for the most part they are acting very well. But a former best-of-breed name in the energy space is looking to reclaim that status. For the record, the stock is REPORTING earnings on 5/3 after the close. It has recorded THREE straight positive reactions up 3.8, 1.5, and 2.6% on 2/23, 11/3, and 8/4/20, but of course that is no guarantee a fourth consecutive advance is in the cards. Technically speaking the stock is doing a lot right these days, as it has made a massive run from the teens last October (the group sold off hard last year while the overall market rallied). This week it has risen almost 11% heading into Friday, after losing ground 5 of the prior 7 weeks. It now trades 5% off most recent 52 week highs, made during peaks made the week ending 3/22 that rose more than 23%. A break above the 88.85 cup base pivot, and then a subsequent move above 90, would have the stock reaching par sometime this summer in my opinion.
Recent Examples:
- The exploration plays have been performing well overall in 2021. The WEEKLY chart below of the XOP, and how it appeared in our 3/19 Energy Report, shows how important the round 70 number was in a bullish ascending triangle breakout. The pattern it recorded that week ending 3/19 was a bearish one with an evening star formation, slumping more than 7%, after a run from 30 in March 2020. Sure enough, the XOP went on to retest that move as many breakouts are to test their validity. Since hitting a low near 72 last week, the ETF responded firmly up 9% headed into Friday. It had fallen 5 of the prior 6 weeks, including 2 which fell more than 7 and 8%. On its daily chart, it is approaching a double bottom pivot of 85.79. Look for another leg higher for the energy names, as overall trends tend to persist more likely than they are to reverse.
Special Situations:
- Exploration leader higher by 52% YTD and 59% over last one year period. Dividend yield of 2.2%.
- Most likely will put 3-week losing streak to rest, higher by 10% heading into Friday. Just 1% off most recent 52-week highs. Has gained more than 147% from last October lows to this March's highs.
- Three consecutive negative earnings reactions down 8.5, 2.9, and 4.1% on 2/26, 11/6, and 8/7/20 (rose 6.5% on 5/8/20).
- Enter after break above bullish ascending triangle.
- Entry EOG here. Stop 72 (REPORTS 5/7 before open).
- Exploration play higher by 46% YTD and 58% over last one-year period. Dividend yield of .5%.
- Name bit of laggard in group, down 13% from most recent 52 week highs. Good follow through this week up almost 14%, after prior week rose 2.2%.
- Earnings mixed with losses of 3.3 and .2% on 2/25 and 11/5/20, and gains of 17.3 and 2.3% on 7/30 and 5/7/20.
- Enter on pullback into very round number/double bottom breakout.
- Entry APA 20.25. Stop 19 (REPORTS 5/6 before open).
- Equipment play higher by 47% YTD and 53% over last one-year period. Dividend yield of 2.8%.
- Still 14% off most recent 52 week highs, but up 10.5% this week, fighting back from prior week that fell more than 5%. Traded with a 5 handle last March.
- Three straight negative earnings reactions down 7.6, 5.3, and 3.6% on 1/28, 11/5, and 8/6/20 (rose 2% on 5/7/20).
- Enter on breakout above double bottom pattern.
- Entry MUR 17.87. Stop 16.90.
Good luck.
Entry summaries:
Buy pullback into ascending triangle breakout EOG here. Stop 72.
Buy pullback into round number/double bottom breakout APA 20.25. Stop 19.
Buy stop above double bottom breakout MUR 17.87. Stop 16.90.