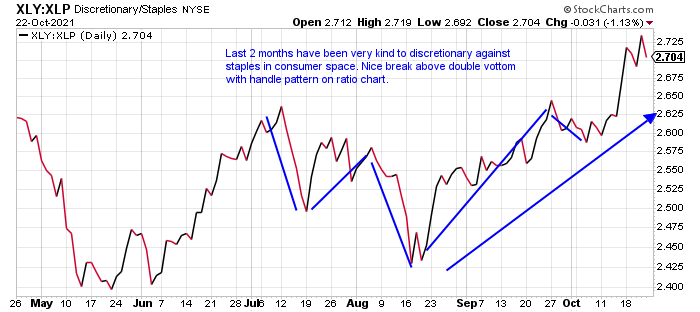
"Risk On"
- Good measure to determine how investors feel in the consumer space with ratio chart comparing discretionary to staples. XLY up 20% YTD against XLP up by 6%. And on shorter time frames to favor XLY up 5% on both 1 and 3 month periods, while the XLP is basically UNCH.
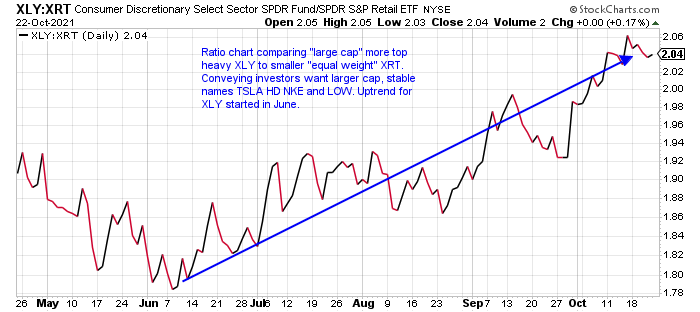
Size Matters:
- XLY obviously mostly affected by AMZN and TSLA (make up nearly half of XLY) which are on different trajectories at the moment. XRT whose top components comprise less than 2%, is underperforming down 5% from recent 52-week highs while XLY is just 1% off its annual peak.
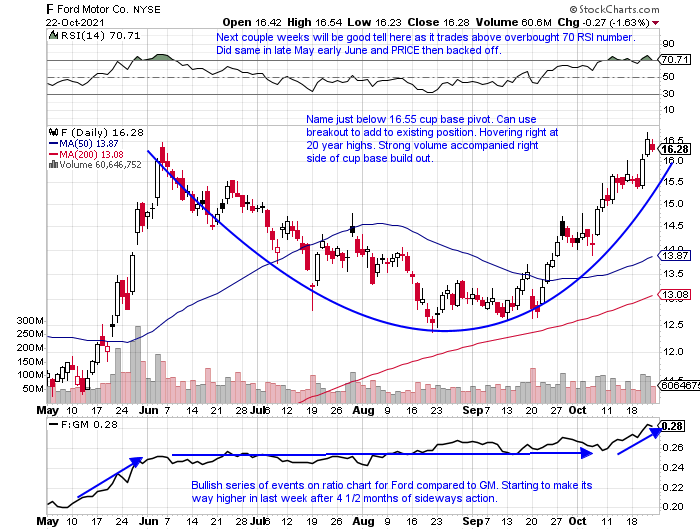
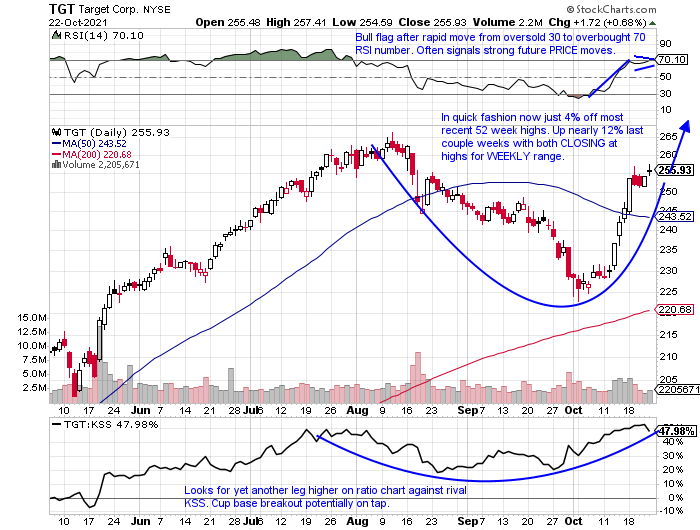
Individual Names:
- Ford on 6 week winning streak and just 2% off most recent 52 week highs. Compare that with GM which is 10% off its yearly peak. On a YTD basis F is higher by 85% compared to GM just 38%, and F sports a dividend yield of 2.8% while GM slashed its own.
- Name can not seem to get going now in correction mode lower by 12% from most recent 52 week highs. Has not put up a 3-week winning streak since April to demonstrate its inconsistency and has not recorded a week of accumulation in almost 4 months. 3200 level very important.

- Name coming back to life up better than a combined 11% last couple weeks, and now just 4% off most recent all-time highs. Over last one-month period showing its superiority over KSS, as TGT is up 5% while KSS in down 11%.
This article requires a Chartsmarter membership. Please click here to join.
"Risk On"
- Good measure to determine how investors feel in the consumer space with ratio chart comparing discretionary to staples. XLY up 20% YTD against XLP up by 6%. And on shorter time frames to favor XLY up 5% on both 1 and 3 month periods, while the XLP is basically UNCH.
Size Matters:
- XLY obviously mostly affected by AMZN and TSLA (make up nearly half of XLY) which are on different trajectories at the moment. XRT whose top components comprise less than 2%, is underperforming down 5% from recent 52-week highs while XLY is just 1% off its annual peak.
Individual Names:
- Ford on 6 week winning streak and just 2% off most recent 52 week highs. Compare that with GM which is 10% off its yearly peak. On a YTD basis F is higher by 85% compared to GM just 38%, and F sports a dividend yield of 2.8% while GM slashed its own.
- Name can not seem to get going now in correction mode lower by 12% from most recent 52 week highs. Has not put up a 3-week winning streak since April to demonstrate its inconsistency and has not recorded a week of accumulation in almost 4 months. 3200 level very important.
- Name coming back to life up better than a combined 11% last couple weeks, and now just 4% off most recent all-time highs. Over last one-month period showing its superiority over KSS, as TGT is up 5% while KSS in down 11%.