Relative Performance:
- Group has been under assault as seen on ratio chart against S&P 500 here. GOOGL is the second-largest holding in ETF and it fell just 2.7% last week and is just 6% off most recent all-time highs but feels heavier than that. Rounding out top 10 holdings in XLC are TMUS T and VZ. TMUS is now lower 9 of last 10 weeks and 22% off most recent 52 week highs and T has lost one-quarter of its value from its 2021 peak.

Individual Names:
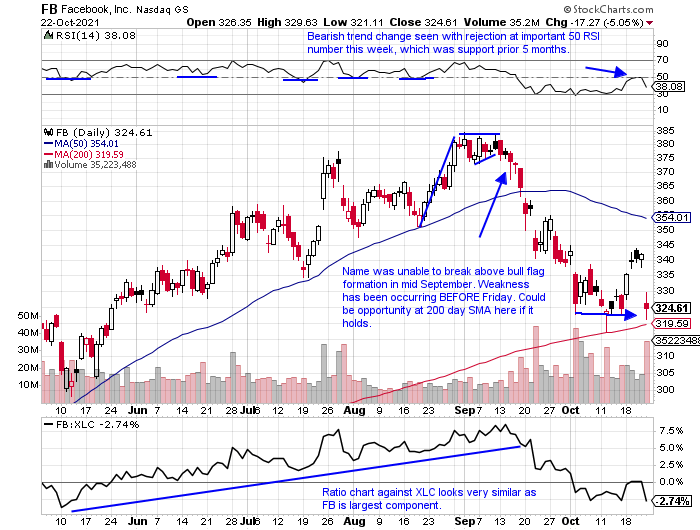
- Name now 16% off most recent 52-week highs and on first 6-week losing streak in years. Recorded 20 handle intraweek reversal to CLOSE at lows for WEEKLY range. Has not come into contact with 200 day SMA since March. Makes up nearly 25% of XLC being top holding.
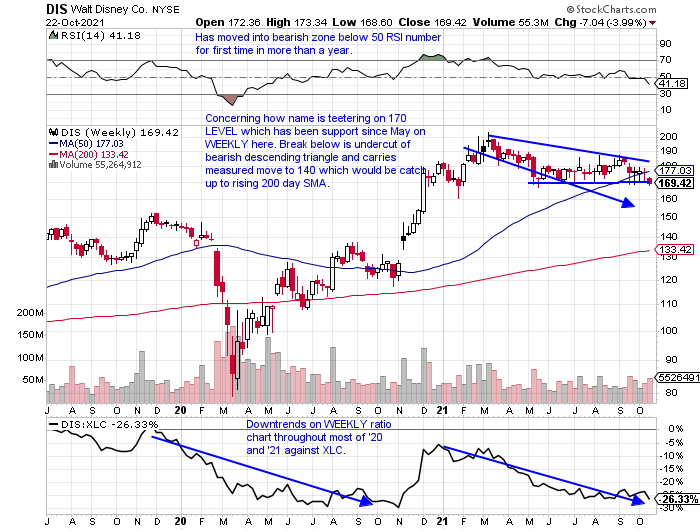
- Many have compared this to NFLX. Since spring has traded between rough range of 170-190. Dropped 4% this week as XLC was UNCH. Name now 17% off most recent 52-week highs, while NFLX at all-time highs. Before last week stock CLOSED 4 weeks very taut all within just .74 of each other. Usually see big moves after that type of consolidation.
Alternates:
- Up 8 of last 10 weeks with last week up 6% CLOSING at the top of the WEEKLY range and on third-best WEEKLY volume of 2021. Blasted out of rough range between 500-600 throughout much of 2021. Should see 700 relatively quickly.

This article requires a Chartsmarter membership. Please click here to join.
Relative Performance:
- Group has been under assault as seen on ratio chart against S&P 500 here. GOOGL is the second-largest holding in ETF and it fell just 2.7% last week and is just 6% off most recent all-time highs but feels heavier than that. Rounding out top 10 holdings in XLC are TMUS T and VZ. TMUS is now lower 9 of last 10 weeks and 22% off most recent 52 week highs and T has lost one-quarter of its value from its 2021 peak.
Individual Names:
- Name now 16% off most recent 52-week highs and on first 6-week losing streak in years. Recorded 20 handle intraweek reversal to CLOSE at lows for WEEKLY range. Has not come into contact with 200 day SMA since March. Makes up nearly 25% of XLC being top holding.
- Many have compared this to NFLX. Since spring has traded between rough range of 170-190. Dropped 4% this week as XLC was UNCH. Name now 17% off most recent 52-week highs, while NFLX at all-time highs. Before last week stock CLOSED 4 weeks very taut all within just .74 of each other. Usually see big moves after that type of consolidation.
Alternates:
- Up 8 of last 10 weeks with last week up 6% CLOSING at the top of the WEEKLY range and on third-best WEEKLY volume of 2021. Blasted out of rough range between 500-600 throughout much of 2021. Should see 700 relatively quickly.