The Week Ahead:
Energy Rotation Underway?
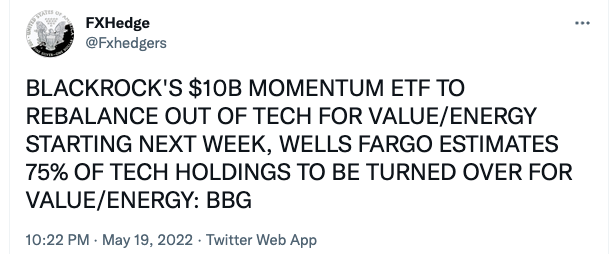
- There are some circumstances when one looks back in retrospect that they see the light. Since we are on the theme of commodities I remember when the KOL stopped trading in December 2020, and since then coal stocks have soared overall. For example, CEIX was trading with a 5 handle when the ETF shut down and is now trading just above the very round 50 number, 10X higher. The tweet below that came out this week to me said this may be the top of the energy as BlackRock is about to embark on letting go of technology, which is at extremely depressed levels in favor of an energy group that has soared over the last couple years. We obviously will not know until well after the fact, but we may look back on this tweet as an aha moment.
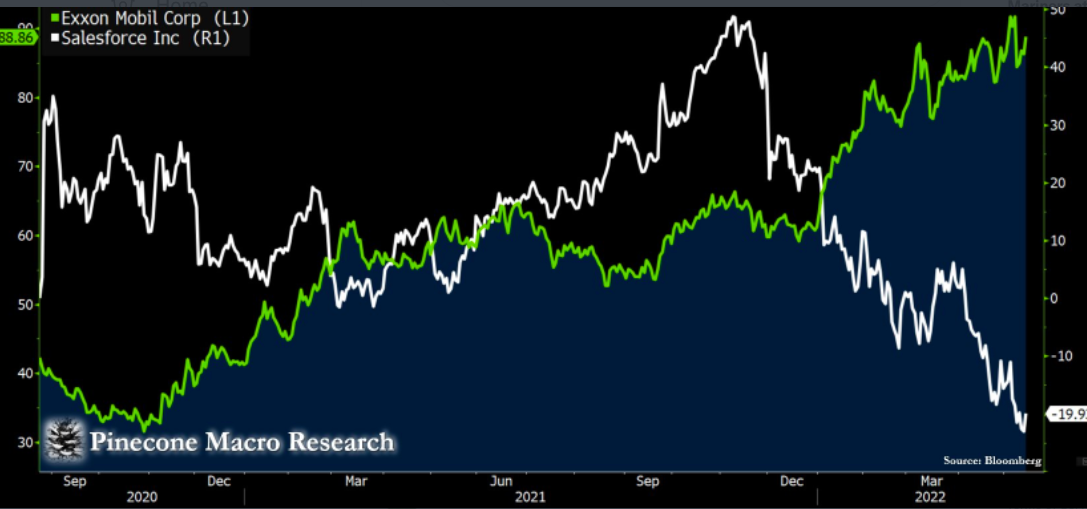
- Here is another tweet from this past week regarding how things tend to be reshuffled at extremes and are often wrong. Rebalancing the Dow in late August 2020 Exxon Mobil was taken out just shy of being a part of the index for one century. "Since Salesforce replaced Exxon in the Dow - Exxon is up 88% and Salesforce is down 20%". Over the last one-year period XOM has advanced 56% and sports a dividend yield of 3.8%, while CRM is lower by 28% over the same time frame. Like the first paragraph shunning technology for energy may happen at an inopportune time, and from a contrarian perspective makes me want to look for places to start allocating capital to technology.
Feast Or Famine:
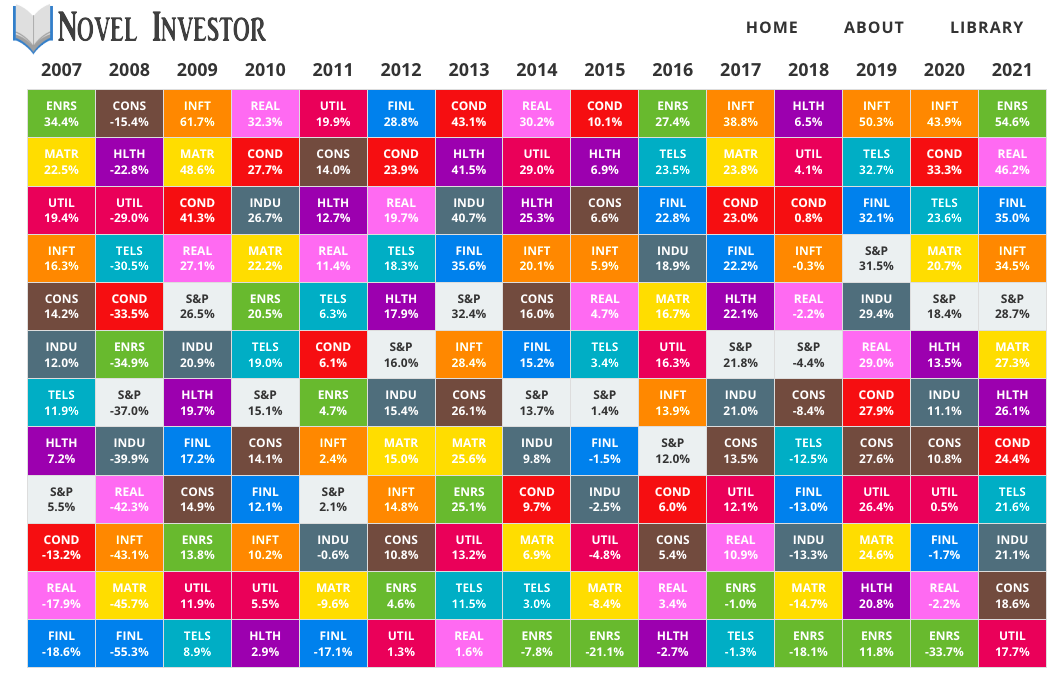
- Below is the chart of how the 11 major S&P sectors have acted on a yearly basis dating back to 2007. Here we can see since 2014 energy has either been the best or more often than not the worst of the bunch. In fact, in 7 of the last 8 years, it was the strongest actor, in 2016 and 2021, and in 2014-15 and again between 2018-2020 it was dead last (2017 it was the 10th best of 11 S&P groups). Now I frequently like to mention that trends once in place are much more likely to persist than they are to reverse and that is the case so far in 2022 as the XLE is again trouncing the competition up 49%, with just one other group being in the green as the utilities are up less than 1%. Markets tend to look 6 months ahead, basically 2023 from here, so it wouldn't surprise me if some mean reversion was about to take place and energy loses its luster and falls back into its yearly habit of feast or famine.
FOMO:
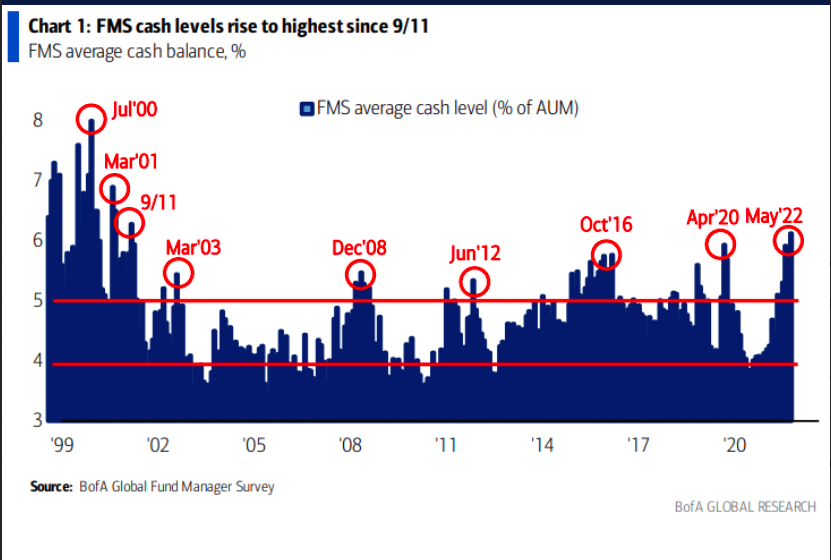
- This chart from BAC this week caught my attention as fund managers have their largest cash positions dating back to 9/11, more than 2 decades ago. If the major averages start to put in some bottoming action this can add some fuel to the fire with the lethal combination of organic buying and short covering. If the cash going to move into places other than energy, then the market will lose its leadership. Let's see where some potential places where well-deserved capital may lend. Renewable energy equipment and biotech may be attractive.
Where Will Capital Be Deployed?
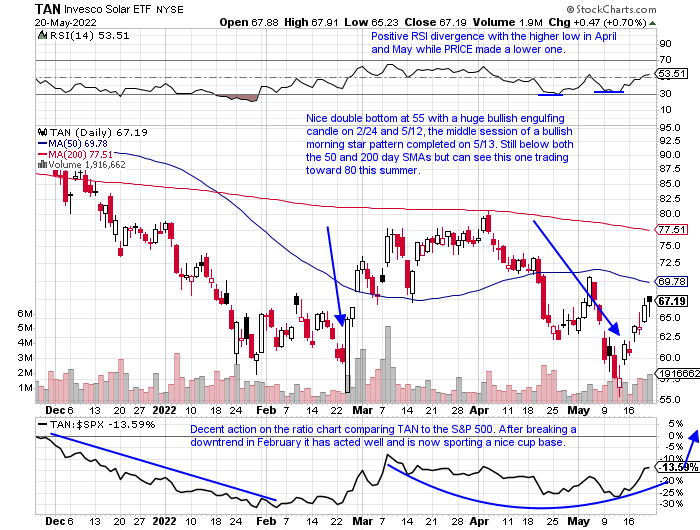
- This is a rhetorical question as we do not if that will occur or where potentially money will be put to work. One thing we can do is see what acted best this past week on another fragile overall tape. Groups that somewhat shrug off the weakness may be a tell. If we think that it might be headed into technology, one can look to the renewable energy equipment space. It does seem strange that this group is within technology, but it makes sense if one thinks that traditional, overcrowded energy may start to mean revert this would be a logical group to benefit. Below is the chart of TAN and although it still trades 34% off most recent 52-week highs the ETF rose 9% last week on a fragile tape. This fund has the capacity to run firmly, last witnessed by a PRICE run from 21 to 126 between March '20-February '21.
CSIQ:
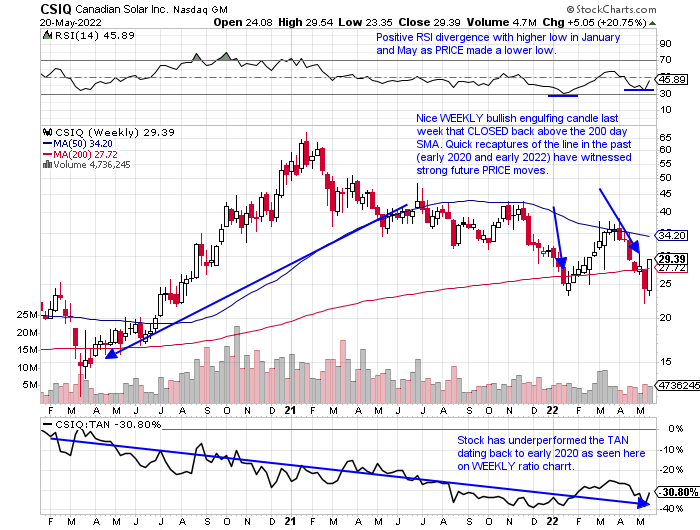
- Canadian solar name is lower by 6% YTD and 25% over last one year period.
- Name 39% off most recent 52 week highs and last week jumped higher by more than 20%, creating possible double bottom with time frame that recorded a 10 week winning streak weeks ending between 1/28-4/1.
- REPORTS earnings this coming Tuesday before the open so best to wait, but respect it has gained ground on FIVE consecutive times folliwing the announcement up 2.3, .9, .3, 6.3 and 3.5% on 3/17, 11/18, 8/12, 5/20 and 3/18/21.
- Enter on pullback into WEEKLY bullish engulfing candle.
- Entry CSIQ 28. Stop 24.
ENPH:
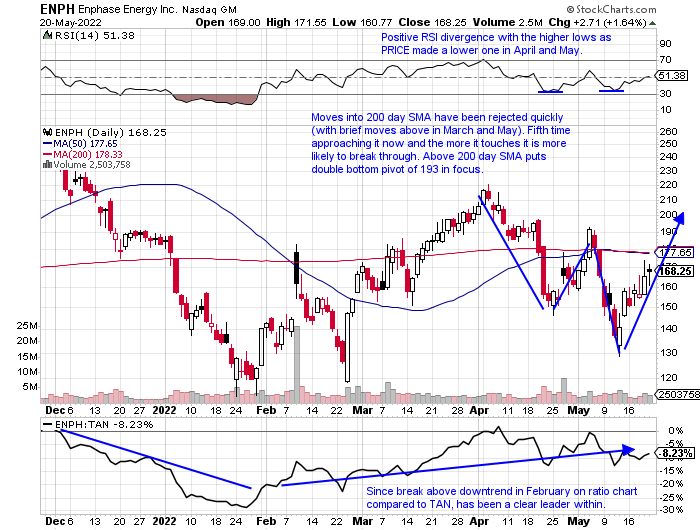
- Solar (with semiconductor exposure as well) play down 8% YTD and up 19% over last one year period.
- Name 40% off most recent 52 week highs but last 2 weeks have CLOSED well into upper half of WEEKLY range. Still working through 10 week losing streak weeks ending between 11/26/21-1/28.
- FOUR straight positive earnings reactions up 7.7, 12, 24.6 and 4.9% on 4/27, 2/9, 10/27 and 7/28/21.
- Enter with buy stop above 200 day SMA.
- Entry ENPH 178. Stop 160.
Biotech Bounce?
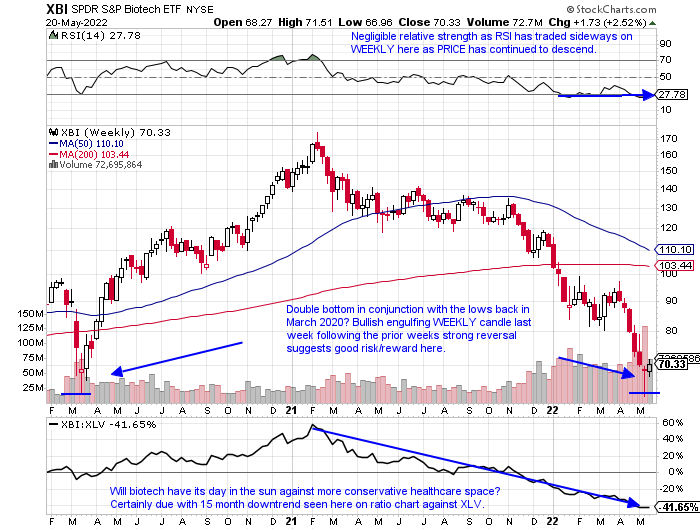
- Healthcare Friday was the best major S&P sector with the XLV rising by 1.2%, and on a YTD basis is now the third-best of 11, although it is still lower in 2022 by 7.6% thus far. Of course, this is a very diverse space, and holding up the group this year has been the pharma names, with the PPH up 7%. Four of the other five groups within healthcare are underwater with the first half nearly complete including medical equipment, medical supplies, healthcare providers, and biotech. The chart below of the XBI is at an attractive level to play a bounce. The ETF is still 50% off highs made last summer but could be making a double bottom at the March 2020 lows. If we were to play this group as always we want it to be best of breed names. Let's take a look at a couple below.
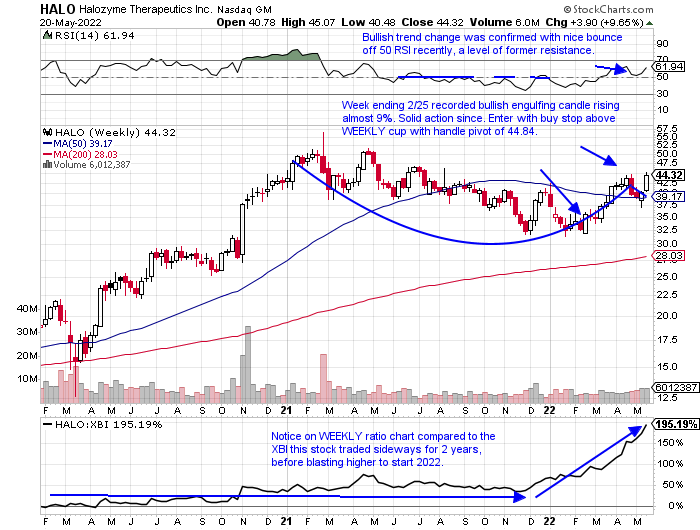
HALO:
- Biotech leader higher by 10% YTD and 4% over last one year period.
- Name 5% off most recent 52-week highs, excellent relative strength as XBI is 50% off its own. Up 10% last week (XBI added "just" 2.6%), after gain of 3% the prior week, both coming on the strongest WEEKLY volume of '22 thus far.
- FOUR straight positive earnings reactions up 1, 2.9, 1.4, and 2% on 5/11, 2/23, 11/3, and 8/10/21.
- Enter with buy stop above WEEKLY cup with handle pattern.
- Entry HALO 44.84. Stop 39.
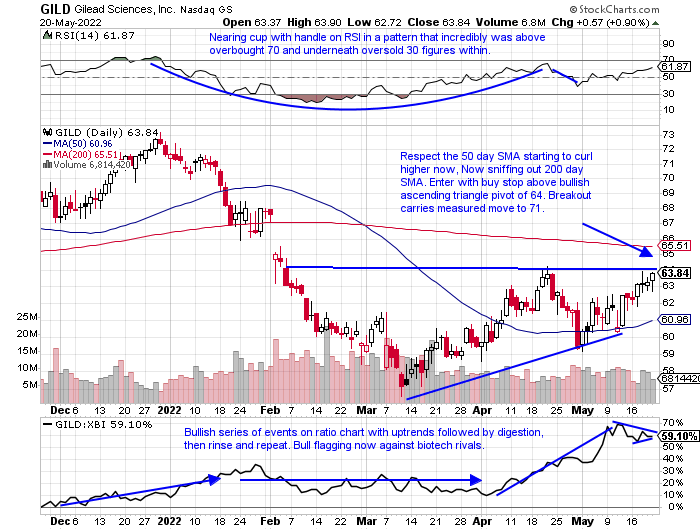
GILD:
- Mature biotech down 12% YTD and 8% over last one year period. Dividend yield of 4.6%.
- Name 14% off most recent 52-week highs, but has advanced 7 of last 10 weeks while the XBI has declined 7 of the last 10 weeks. Over last one month period GILD UNCH, good relative strength as XBI has dropped 17% during timeframe.
- FIVE consecutive negative earnings reactions down 3.6, 1.5, 3.6, 2.2 and .6% on 4/29, 2/2, 10/29, 7/30 and 4/30/21.
- Enter with buy stop above bullish ascending triangle.
- Entry GILD 64. Stop 61.
Good luck.
This article requires a Chartsmarter membership. Please click here to join.
The Week Ahead:
Energy Rotation Underway?
- There are some circumstances when one looks back in retrospect that they see the light. Since we are on the theme of commodities I remember when the KOL stopped trading in December 2020, and since then coal stocks have soared overall. For example, CEIX was trading with a 5 handle when the ETF shut down and is now trading just above the very round 50 number, 10X higher. The tweet below that came out this week to me said this may be the top of the energy as BlackRock is about to embark on letting go of technology, which is at extremely depressed levels in favor of an energy group that has soared over the last couple years. We obviously will not know until well after the fact, but we may look back on this tweet as an aha moment.
- Here is another tweet from this past week regarding how things tend to be reshuffled at extremes and are often wrong. Rebalancing the Dow in late August 2020 Exxon Mobil was taken out just shy of being a part of the index for one century. "Since Salesforce replaced Exxon in the Dow - Exxon is up 88% and Salesforce is down 20%". Over the last one-year period XOM has advanced 56% and sports a dividend yield of 3.8%, while CRM is lower by 28% over the same time frame. Like the first paragraph shunning technology for energy may happen at an inopportune time, and from a contrarian perspective makes me want to look for places to start allocating capital to technology.
Feast Or Famine:
- Below is the chart of how the 11 major S&P sectors have acted on a yearly basis dating back to 2007. Here we can see since 2014 energy has either been the best or more often than not the worst of the bunch. In fact, in 7 of the last 8 years, it was the strongest actor, in 2016 and 2021, and in 2014-15 and again between 2018-2020 it was dead last (2017 it was the 10th best of 11 S&P groups). Now I frequently like to mention that trends once in place are much more likely to persist than they are to reverse and that is the case so far in 2022 as the XLE is again trouncing the competition up 49%, with just one other group being in the green as the utilities are up less than 1%. Markets tend to look 6 months ahead, basically 2023 from here, so it wouldn't surprise me if some mean reversion was about to take place and energy loses its luster and falls back into its yearly habit of feast or famine.
FOMO:
- This chart from BAC this week caught my attention as fund managers have their largest cash positions dating back to 9/11, more than 2 decades ago. If the major averages start to put in some bottoming action this can add some fuel to the fire with the lethal combination of organic buying and short covering. If the cash going to move into places other than energy, then the market will lose its leadership. Let's see where some potential places where well-deserved capital may lend. Renewable energy equipment and biotech may be attractive.
Where Will Capital Be Deployed?
- This is a rhetorical question as we do not if that will occur or where potentially money will be put to work. One thing we can do is see what acted best this past week on another fragile overall tape. Groups that somewhat shrug off the weakness may be a tell. If we think that it might be headed into technology, one can look to the renewable energy equipment space. It does seem strange that this group is within technology, but it makes sense if one thinks that traditional, overcrowded energy may start to mean revert this would be a logical group to benefit. Below is the chart of TAN and although it still trades 34% off most recent 52-week highs the ETF rose 9% last week on a fragile tape. This fund has the capacity to run firmly, last witnessed by a PRICE run from 21 to 126 between March '20-February '21.
CSIQ:
- Canadian solar name is lower by 6% YTD and 25% over last one year period.
- Name 39% off most recent 52 week highs and last week jumped higher by more than 20%, creating possible double bottom with time frame that recorded a 10 week winning streak weeks ending between 1/28-4/1.
- REPORTS earnings this coming Tuesday before the open so best to wait, but respect it has gained ground on FIVE consecutive times folliwing the announcement up 2.3, .9, .3, 6.3 and 3.5% on 3/17, 11/18, 8/12, 5/20 and 3/18/21.
- Enter on pullback into WEEKLY bullish engulfing candle.
- Entry CSIQ 28. Stop 24.
ENPH:
- Solar (with semiconductor exposure as well) play down 8% YTD and up 19% over last one year period.
- Name 40% off most recent 52 week highs but last 2 weeks have CLOSED well into upper half of WEEKLY range. Still working through 10 week losing streak weeks ending between 11/26/21-1/28.
- FOUR straight positive earnings reactions up 7.7, 12, 24.6 and 4.9% on 4/27, 2/9, 10/27 and 7/28/21.
- Enter with buy stop above 200 day SMA.
- Entry ENPH 178. Stop 160.
Biotech Bounce?
- Healthcare Friday was the best major S&P sector with the XLV rising by 1.2%, and on a YTD basis is now the third-best of 11, although it is still lower in 2022 by 7.6% thus far. Of course, this is a very diverse space, and holding up the group this year has been the pharma names, with the PPH up 7%. Four of the other five groups within healthcare are underwater with the first half nearly complete including medical equipment, medical supplies, healthcare providers, and biotech. The chart below of the XBI is at an attractive level to play a bounce. The ETF is still 50% off highs made last summer but could be making a double bottom at the March 2020 lows. If we were to play this group as always we want it to be best of breed names. Let's take a look at a couple below.
HALO:
- Biotech leader higher by 10% YTD and 4% over last one year period.
- Name 5% off most recent 52-week highs, excellent relative strength as XBI is 50% off its own. Up 10% last week (XBI added "just" 2.6%), after gain of 3% the prior week, both coming on the strongest WEEKLY volume of '22 thus far.
- FOUR straight positive earnings reactions up 1, 2.9, 1.4, and 2% on 5/11, 2/23, 11/3, and 8/10/21.
- Enter with buy stop above WEEKLY cup with handle pattern.
- Entry HALO 44.84. Stop 39.
GILD:
- Mature biotech down 12% YTD and 8% over last one year period. Dividend yield of 4.6%.
- Name 14% off most recent 52-week highs, but has advanced 7 of last 10 weeks while the XBI has declined 7 of the last 10 weeks. Over last one month period GILD UNCH, good relative strength as XBI has dropped 17% during timeframe.
- FIVE consecutive negative earnings reactions down 3.6, 1.5, 3.6, 2.2 and .6% on 4/29, 2/2, 10/29, 7/30 and 4/30/21.
- Enter with buy stop above bullish ascending triangle.
- Entry GILD 64. Stop 61.
Good luck.