When Wisdom Speaks:
- The book below is a must-read in my opinion, and it speaks to investor psychology of being frightened to buy stocks on the way down in a fierce drawdown. But can the quote be viewed as instrumental on the upside as well? I seem to be in the minority after Friday's action and the chorus of a near-term top being in has grown deafening. The negativity is pervasive. As 13Fs were filed recently the media made a big deal of Michael Burry holding almost zero stocks. JPM Kolanovic said this week to dump stocks and buy commodities. Then a Zerohedge article came out today saying the squeeze is over as new shorts have come back to life. I will focus on growth as that has been the driver since the June low and yes the QQQ did record a doji candle this Tuesday (also a bearish harami cross, but the breadth thrusts we have witnessed were still recorded. My feeling is that the 21-day EMA needs to hold about 1% lower from Friday's CLOSING PRICE (if not a retest of the 314 area on the break above an ascending triangle may come into play). Then the growth spurt can spread its wings again. When that time comes will investors want to buy, or will they be too scared waiting for the big pullback and not want to?

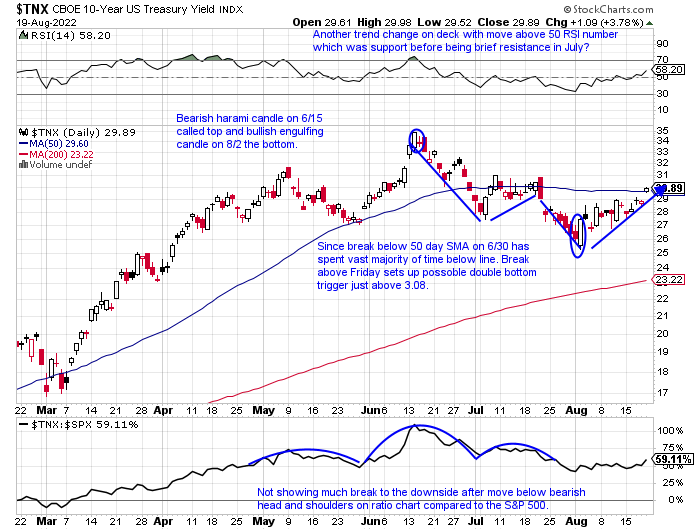
Ten Year In Focus:
- All eyes continue to watch the ten-year yield like a hawk, and with good reason. When rates topped back on 6/15 is when the market commenced with its nascent rally. Growth in particular. Tech stocks love a lower cost of capital especially. Below on the chart one can see the double bottom possibly taking shape on the ten-year. It CLOSED above its 50-day SMA for the first time in about a month and it is trading right into the teeth of a bearish engulfing candle from 7/21. Many have been keying in on the TLT as well for clues to the direction of the QQQ. The direction of that instrument has been negative since a reversal at the round 120 number on 8/2. A weak bullish inverse head and shoulders breakout never gained any momentum and that was a red flag not only for it but for growth, as we know the best breakouts tend to work right away. This past week they traded almost in perfect tandem with the QQQ off 2.3% and the TLT down by 2.2%. Next week will be key and it is interesting out of the big four index ETFs, the old stodgy DIA was the only one to CLOSE above its 200-day SMA Friday (QQQ SPY and IWM could not). Value about to come back into vogue?
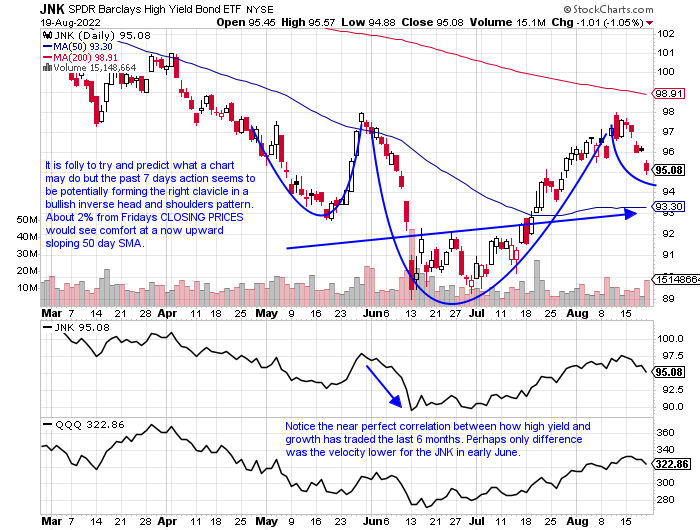
Junk In The Trunk:
- Yet another way to judge risk appetite is by the PRICE action in the JNK. If the ETF is acting well you can be pretty sure markets are following suit. This week's drop of 2.6% was its second largest WEEKLY drop in almost 2 1/2 years. In mid-July, it broke ABOVE a bear flag, and not surprisingly it witnessed a strong reaction to the upside. A couple of handles lower in PRICE may find some cushion for the fund. Again I think then on a possible "turnaround Tuesday" we can see the rally regain its composure. Inflation is most likely peaking here with such obscure goods like eggs and chicken wings PRICES plummeting, but abroad the picture is a bit murkier. Energy in Europe should continue to skyrocket with the winter on deck, exacerbating inflation. So from that perspective, we may see the old acronym TINA come into play with our domestic names looking rosier by default. That will be reflected in junk bond PRICES so keep a close eye on them.
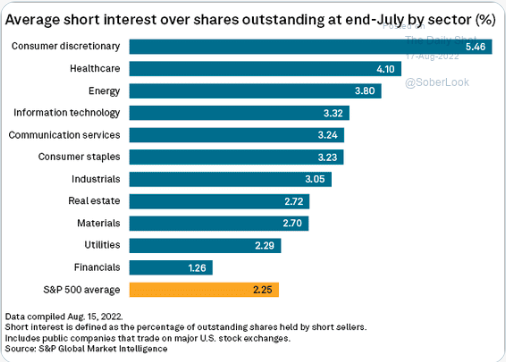
What Works If Inflation Has Peaked?
- Of course, overall many groups will benefit, but obviously consumer discretionary as goods become more affordable. The XLY was the worst performer on Friday, but without having a myopic view the sector is still the second best major S&P sector over the last one-month period and the best over the last 3-month timeframe. Couple that strong action with the chart below from SoberLook showing an oversized short position and that could be a lethal combination if market participants begin to cover. Two names that will have a big say in that are the top 2 components with AMZN and TSLA. The latter is sporting a bull flag that is spooning its 200-day SMA with a range between the round 850-950 numbers since the beginning of August. AMZN was never above to CLOSE above its own secular line as it was above it intraday Tuesday but could not finish north of it. A bright spot this week that should not go overlooked is the home improvement retail space with both HD and LOW reporting. Overlooked in that arena is FND which was stopped cold at the very round par number, and BECN the only one of the quartet to CLOSE above its 200-day SMA.
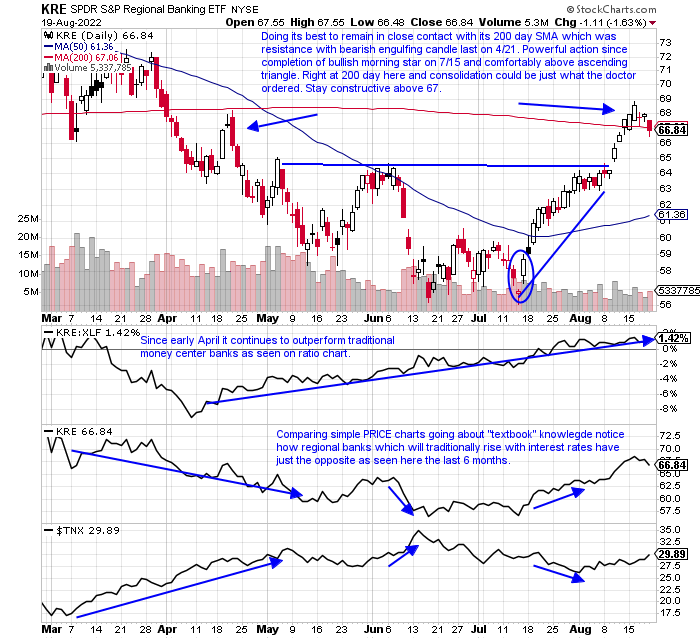
Regional Resolve:
- Financials historically prevail in an environment of rising interest rates. Simply put their net interest margins improve. But common sense rarely works in markets as they do their best to confound the most. As technicians, we focus solely on PRICE action and leave the "why" for others to solve. Within the diverse financial space, there has been some interesting divergence over the last 4 months. The regional banks via the KRE have been outshining their traditional money center bank cousins in the XLF. The KRE over the last one and three-month time frame is higher by 10 and 11% respectively while the XLF is up 7 and 6% over the same period (and the KRE has a slightly better dividend yield of 2.1% compared to the XLF at 1.9%). And from a pure PRICE perspective, the KRE has been spending time recently above its 200-day SMA (CLOSED fractionally below it Friday) while the XLF has not come into contact at all with it in August.
Financial Leaders:
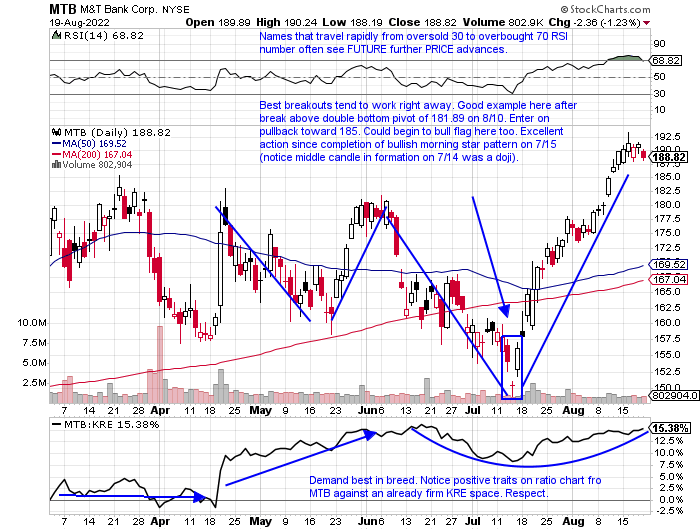
- Regional bank play up 23% YTD and 40% over the last one-year period. Dividend yield of 2.5%.
- Name just 2% off most recent 52-week highs and rose 20% during 4-week winning streak weeks ending between 7/22-8/12. Fell .5% this week, good relative strength as the KRE fell by double that.
- Earnings mostly higher up .5, 8.8, and 5.8% on 7/20, 4/20, and 10/20/21, and fell 5.4% on 1/20.
- Enter on pullback into double bottom breakout.
- Entry MTB 185. Stop 176.
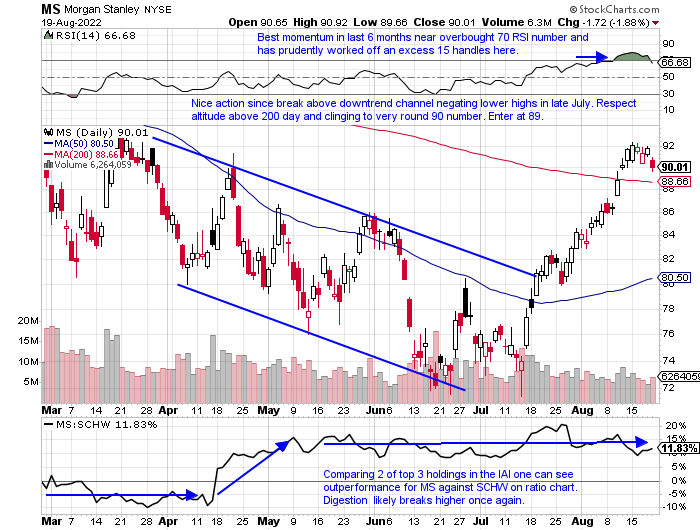
- Financial services play down 8% YTD and 10% over last one-year period. Dividend yield of 3.4%.
- Name 18% off most recent 52-week highs and last week fell 1.8% ending prior 5-week winning streak. Look for the stock to gravitate toward very round par number in the near term.
- Earnings mostly higher up .7, 1.8, and 2.5% on 4/14, 1/19, and 10/14/21, and fell .4% on 7/14.
- Enter on pullback into 200-day SMA.
- Entry MS 89. Stop 85.
Good luck.
This article requires a Chartsmarter membership. Please click here to join.
When Wisdom Speaks:
- The book below is a must-read in my opinion, and it speaks to investor psychology of being frightened to buy stocks on the way down in a fierce drawdown. But can the quote be viewed as instrumental on the upside as well? I seem to be in the minority after Friday's action and the chorus of a near-term top being in has grown deafening. The negativity is pervasive. As 13Fs were filed recently the media made a big deal of Michael Burry holding almost zero stocks. JPM Kolanovic said this week to dump stocks and buy commodities. Then a Zerohedge article came out today saying the squeeze is over as new shorts have come back to life. I will focus on growth as that has been the driver since the June low and yes the QQQ did record a doji candle this Tuesday (also a bearish harami cross, but the breadth thrusts we have witnessed were still recorded. My feeling is that the 21-day EMA needs to hold about 1% lower from Friday's CLOSING PRICE (if not a retest of the 314 area on the break above an ascending triangle may come into play). Then the growth spurt can spread its wings again. When that time comes will investors want to buy, or will they be too scared waiting for the big pullback and not want to?
Ten Year In Focus:
- All eyes continue to watch the ten-year yield like a hawk, and with good reason. When rates topped back on 6/15 is when the market commenced with its nascent rally. Growth in particular. Tech stocks love a lower cost of capital especially. Below on the chart one can see the double bottom possibly taking shape on the ten-year. It CLOSED above its 50-day SMA for the first time in about a month and it is trading right into the teeth of a bearish engulfing candle from 7/21. Many have been keying in on the TLT as well for clues to the direction of the QQQ. The direction of that instrument has been negative since a reversal at the round 120 number on 8/2. A weak bullish inverse head and shoulders breakout never gained any momentum and that was a red flag not only for it but for growth, as we know the best breakouts tend to work right away. This past week they traded almost in perfect tandem with the QQQ off 2.3% and the TLT down by 2.2%. Next week will be key and it is interesting out of the big four index ETFs, the old stodgy DIA was the only one to CLOSE above its 200-day SMA Friday (QQQ SPY and IWM could not). Value about to come back into vogue?
Junk In The Trunk:
- Yet another way to judge risk appetite is by the PRICE action in the JNK. If the ETF is acting well you can be pretty sure markets are following suit. This week's drop of 2.6% was its second largest WEEKLY drop in almost 2 1/2 years. In mid-July, it broke ABOVE a bear flag, and not surprisingly it witnessed a strong reaction to the upside. A couple of handles lower in PRICE may find some cushion for the fund. Again I think then on a possible "turnaround Tuesday" we can see the rally regain its composure. Inflation is most likely peaking here with such obscure goods like eggs and chicken wings PRICES plummeting, but abroad the picture is a bit murkier. Energy in Europe should continue to skyrocket with the winter on deck, exacerbating inflation. So from that perspective, we may see the old acronym TINA come into play with our domestic names looking rosier by default. That will be reflected in junk bond PRICES so keep a close eye on them.
What Works If Inflation Has Peaked?
- Of course, overall many groups will benefit, but obviously consumer discretionary as goods become more affordable. The XLY was the worst performer on Friday, but without having a myopic view the sector is still the second best major S&P sector over the last one-month period and the best over the last 3-month timeframe. Couple that strong action with the chart below from SoberLook showing an oversized short position and that could be a lethal combination if market participants begin to cover. Two names that will have a big say in that are the top 2 components with AMZN and TSLA. The latter is sporting a bull flag that is spooning its 200-day SMA with a range between the round 850-950 numbers since the beginning of August. AMZN was never above to CLOSE above its own secular line as it was above it intraday Tuesday but could not finish north of it. A bright spot this week that should not go overlooked is the home improvement retail space with both HD and LOW reporting. Overlooked in that arena is FND which was stopped cold at the very round par number, and BECN the only one of the quartet to CLOSE above its 200-day SMA.
Regional Resolve:
- Financials historically prevail in an environment of rising interest rates. Simply put their net interest margins improve. But common sense rarely works in markets as they do their best to confound the most. As technicians, we focus solely on PRICE action and leave the "why" for others to solve. Within the diverse financial space, there has been some interesting divergence over the last 4 months. The regional banks via the KRE have been outshining their traditional money center bank cousins in the XLF. The KRE over the last one and three-month time frame is higher by 10 and 11% respectively while the XLF is up 7 and 6% over the same period (and the KRE has a slightly better dividend yield of 2.1% compared to the XLF at 1.9%). And from a pure PRICE perspective, the KRE has been spending time recently above its 200-day SMA (CLOSED fractionally below it Friday) while the XLF has not come into contact at all with it in August.
Financial Leaders:
- Regional bank play up 23% YTD and 40% over the last one-year period. Dividend yield of 2.5%.
- Name just 2% off most recent 52-week highs and rose 20% during 4-week winning streak weeks ending between 7/22-8/12. Fell .5% this week, good relative strength as the KRE fell by double that.
- Earnings mostly higher up .5, 8.8, and 5.8% on 7/20, 4/20, and 10/20/21, and fell 5.4% on 1/20.
- Enter on pullback into double bottom breakout.
- Entry MTB 185. Stop 176.
- Financial services play down 8% YTD and 10% over last one-year period. Dividend yield of 3.4%.
- Name 18% off most recent 52-week highs and last week fell 1.8% ending prior 5-week winning streak. Look for the stock to gravitate toward very round par number in the near term.
- Earnings mostly higher up .7, 1.8, and 2.5% on 4/14, 1/19, and 10/14/21, and fell .4% on 7/14.
- Enter on pullback into 200-day SMA.
- Entry MS 89. Stop 85.
Good luck.