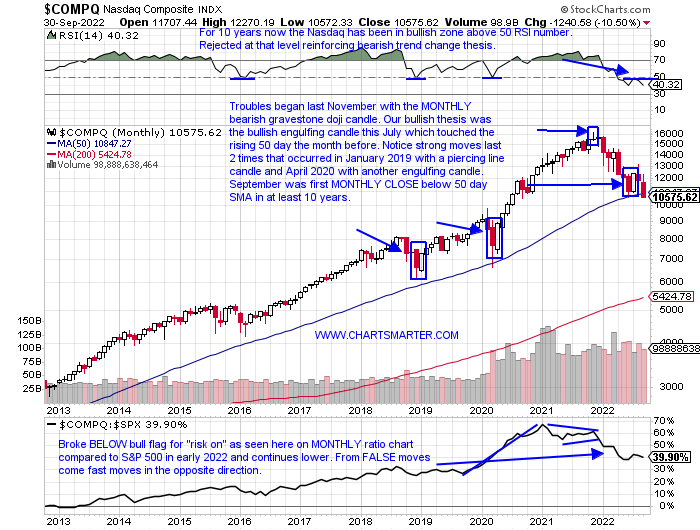
MONTHLY Nasdaq Chart Revisit:
- We frequently like to say PRICE is omnipotent. You can use all the indicators you want but at the end of the day that is how we are judged/paid and all of the "signals" we like to use react to PRICE too. We have heard the breadth thrusts, the percentage of stocks above their 200-day SMA falling to single digits, no bear markets which recaptured 50% of the down move went on to test the lows, etc plenty. But PRICE overcame those all, to the downside. I was bullish following the July bullish engulfing candle which came into contact with the rising 50-day SMA, a rare occurrence as seen on the chart below (just the third time in the last decade) but that sanguine outlook must be reined in now as that candle was negated in September. Sure positive seasonality is kicking in with the Stock Trader's Almanac stating that October "turned the tide in 12 post-WWII bear markets: 1946, 1957, 1960, 1962, 1966, 1974, 1987, 1990, 1998, 2001, 2002, and 2011." (the Nasdaq tends to be firm in mid-term election years too). But unless this CLOSE below the 50-day SMA this month turns out to be a bear trap market participants should err on the side of caution. At the very least the "V-shaped" bottoms we became accustomed to in 2018 and 2020 are in the rearview mirror.
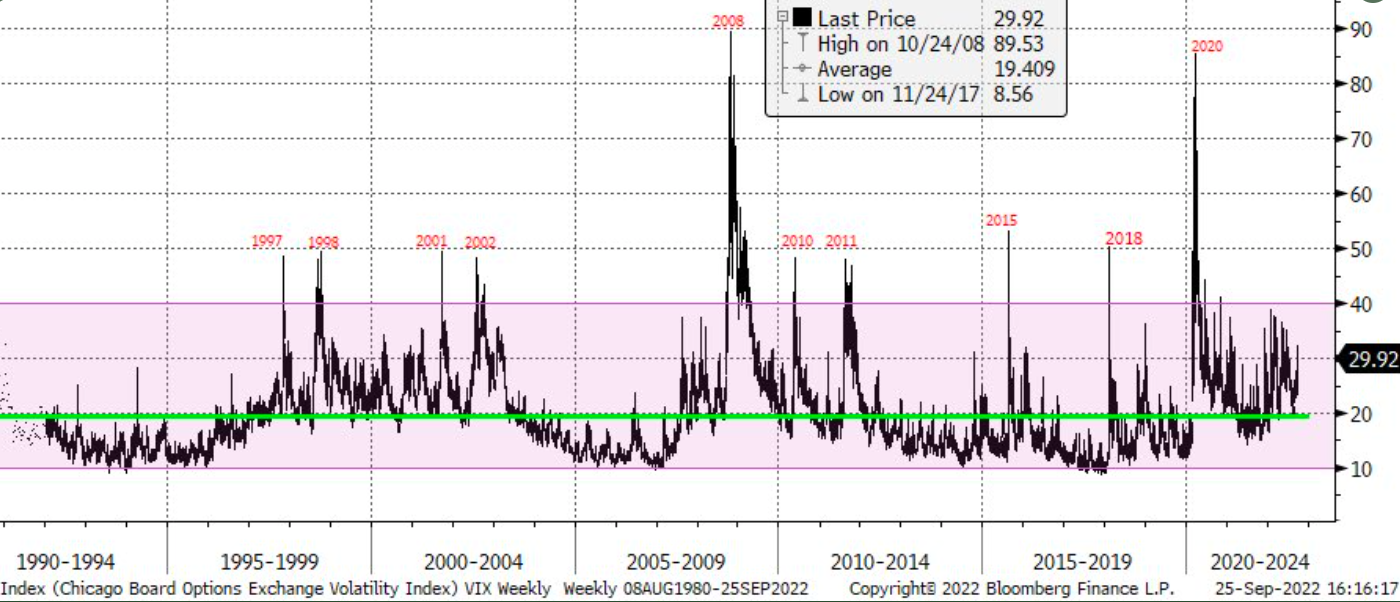
Sleeping Giant?
- The chart below (from earlier this week as it CLOSED Friday at 31.62) from J. Roque illustrates that the VIX could be ready for a "beachball held underwater" break to the upside. Round number theory is interesting here with the 2 big spikes toward the very round 90 number in 2008 and 2020 and the rejections at the 50 figure in the other 8 years during market meltdowns (look at the single-digit low in November 2017). We hear all the time that there is too much complacency and that the VIX needs to participate more to the upside to get the proverbial "flush" and potential capitulation. And it is true with the obvious firm drawdown we have witnessed the decline has seen orderly, but to me, I am still hearing too many calls that the risk to the downside is small after the 20% haircut for the Nasdaq from the 8/16 peak. But this could just be getting started to the downside as objects that are oversold could easily become more so. I am in the camp that we need to see a move toward 50 again as history tends to repeat itself before we can put in a meaningful "bottom".
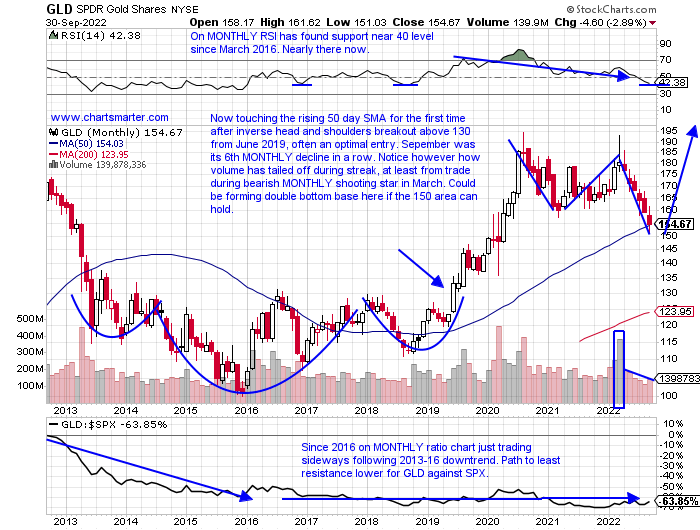
"Glittery" Bottom?
- Is gold about to start acting like the inflation hedge it has claimed to be? Of course, no one knows that answer, but the updated MONTHLY chart below of the GLD is now at a good risk/reward entry in my opinion. This is now 20% off the peak from its blowoff top this March (volume that month was the fourth largest in the last 10 years) and more importantly, it has caught up in PRICE to its rising 50-day SMA for the first time in nearly 3 years (notice bounce off very round par number in December 2016). If one were to take a look at the GDX WEEKLY chart it recorded a bullish outside week in the second best WEEKLY volume since the first week of 2021. The round 40 number on the NEM MONTHLY chart is important as it recorded a bullish inverted hammer in September, and that level was former resistance in August 2016. Of the large-cap plays within I tend to prefer GOLD and AEM to RGLD and FNV as the former names attempted to peak their heads above their 50-day SMAs Friday but did CLOSE below. Looks for several consecutive CLOSES above in them.
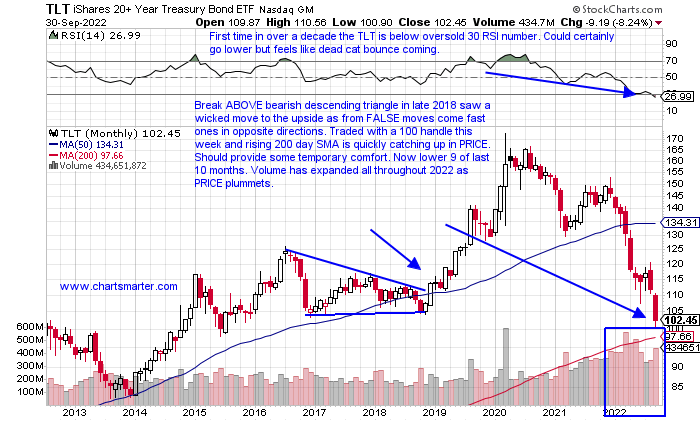
Bond Bullying:
- "I used to think if there was reincarnation, I wanted to come back as the president or the pope or a .400 baseball hitter. But now I want to come back as the bond market. You can intimidate everybody." That was a quote by James Carville and I am already thinking about how I can make this fixed-income market my Halloween costume (suggestions welcome). There has been a lot of chatter about how Truss was the first to "pivot" but we quickly found out that was not the case as she simply needed to save Britain's pensions. But it does make one think the Fed is "trapped" and may be out of bullets even if they do decide to "pivot". Below is the chart of the TLT and we can see just how precipitous the decline has been since the March 2020 top in enormous volume with a 40 handle intra-month range. Will the very round par figure provide some temporary refuge? No one will know until hindsight, but when this finally makes a turn the move will be furious in the other direction. Bob Farrells quote comes to mind with this thinking "parabolic advances usually go further than you think, but they do not correct by going sideways."
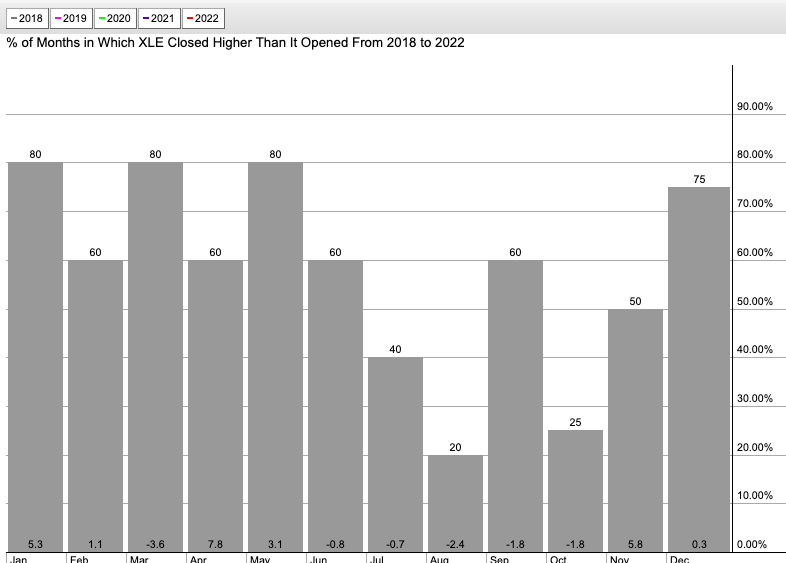
Energized Seasonality:
- Whoever coined the phrase "sell in May and go away" must have been referring to the energy group. As one can see from the seasonality of the XLE the last 5 years would have been a prescient call. The expression insinuates that from May-October is would be prudent to be underweight, and after May the ETF has been lower for 5 straight months between June-October. This coming month tends to be weak with an average loss of 1.8% over the last 4 years and has finished the month lower than where it started 3 of the last 4 Octobers. But investors tend to look ahead and notice that 5 of the next 6 months tend to CLOSE higher than where they began and the months of November, January, and April favor the bold with average MONTHLY gains of 5.8, 5.3, and 7.8%. Of course, the vast majority of the fund is CVX and XOM and there is some slight divergence between the two notably this week as XOM rose 2% while CVX fell by .6%. Overall give the group credit as the XLE was the only major S&P sector of 11 to advance last week up more than 2%. Let's take a look at two of the better names in the arena.
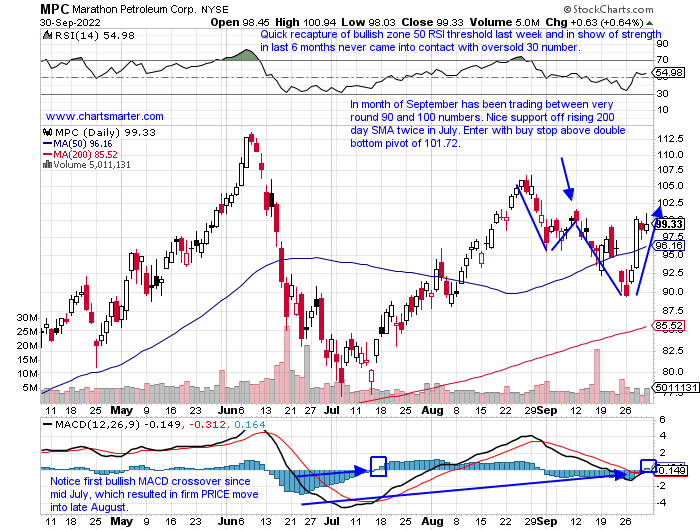
- Integrated energy play up 55% YTD and 61% over last one year period. Dividend yield of 2.3%.
- Name 19% off most recent 52-week highs and bullish engulfing WEEKLY candle last week (WEEKLY chart could be considered cup with handle base). Great relative strength last week up 8.6% doubling gain of HES 4.2%.
- Earnings mostly higher up 3.6, 4, and 6% on 8/2, 5/3, and 2/2 after a loss of 3.9% on 11/2/21.
- Enter with buy stop above double bottom pivot.
- Entry MPC 101.72. Stop 95.
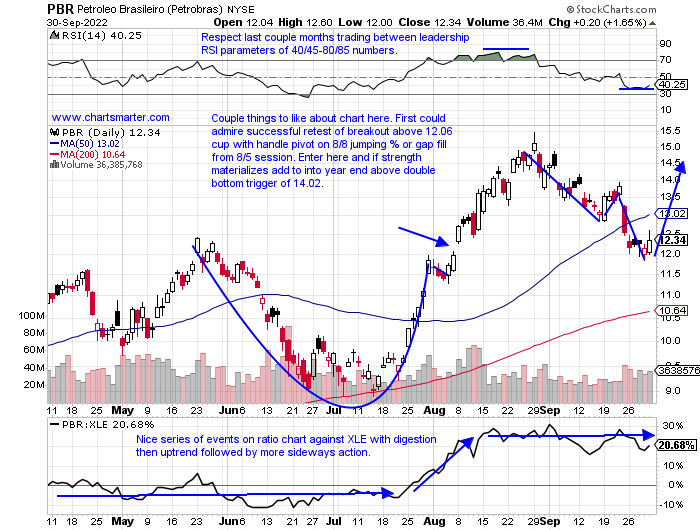
- Brazilian energy giant up 12% YTD and 19% over last one year period. Dividend yield of 51%.
- Name 20% off most recent 52-week highs and on current 5-week losing streak but has cut halfway into big 6-week winning streak weeks ending between 7/22-8/26 that rose by more than 60% top to bottom of range.
- Earnings mixed with gains of 6.6 and 3.1% on 7/29 and 5/6 and losses of 4.2 and 7% on 2/24 and 10/29/21.
- Enter after successful cup with handle retest/gap fill.
- Entry PBR here. Stop 11.50.
Good luck.
This article requires a Chartsmarter membership. Please click here to join.
MONTHLY Nasdaq Chart Revisit:
- We frequently like to say PRICE is omnipotent. You can use all the indicators you want but at the end of the day that is how we are judged/paid and all of the "signals" we like to use react to PRICE too. We have heard the breadth thrusts, the percentage of stocks above their 200-day SMA falling to single digits, no bear markets which recaptured 50% of the down move went on to test the lows, etc plenty. But PRICE overcame those all, to the downside. I was bullish following the July bullish engulfing candle which came into contact with the rising 50-day SMA, a rare occurrence as seen on the chart below (just the third time in the last decade) but that sanguine outlook must be reined in now as that candle was negated in September. Sure positive seasonality is kicking in with the Stock Trader's Almanac stating that October "turned the tide in 12 post-WWII bear markets: 1946, 1957, 1960, 1962, 1966, 1974, 1987, 1990, 1998, 2001, 2002, and 2011." (the Nasdaq tends to be firm in mid-term election years too). But unless this CLOSE below the 50-day SMA this month turns out to be a bear trap market participants should err on the side of caution. At the very least the "V-shaped" bottoms we became accustomed to in 2018 and 2020 are in the rearview mirror.
Sleeping Giant?
- The chart below (from earlier this week as it CLOSED Friday at 31.62) from J. Roque illustrates that the VIX could be ready for a "beachball held underwater" break to the upside. Round number theory is interesting here with the 2 big spikes toward the very round 90 number in 2008 and 2020 and the rejections at the 50 figure in the other 8 years during market meltdowns (look at the single-digit low in November 2017). We hear all the time that there is too much complacency and that the VIX needs to participate more to the upside to get the proverbial "flush" and potential capitulation. And it is true with the obvious firm drawdown we have witnessed the decline has seen orderly, but to me, I am still hearing too many calls that the risk to the downside is small after the 20% haircut for the Nasdaq from the 8/16 peak. But this could just be getting started to the downside as objects that are oversold could easily become more so. I am in the camp that we need to see a move toward 50 again as history tends to repeat itself before we can put in a meaningful "bottom".
"Glittery" Bottom?
- Is gold about to start acting like the inflation hedge it has claimed to be? Of course, no one knows that answer, but the updated MONTHLY chart below of the GLD is now at a good risk/reward entry in my opinion. This is now 20% off the peak from its blowoff top this March (volume that month was the fourth largest in the last 10 years) and more importantly, it has caught up in PRICE to its rising 50-day SMA for the first time in nearly 3 years (notice bounce off very round par number in December 2016). If one were to take a look at the GDX WEEKLY chart it recorded a bullish outside week in the second best WEEKLY volume since the first week of 2021. The round 40 number on the NEM MONTHLY chart is important as it recorded a bullish inverted hammer in September, and that level was former resistance in August 2016. Of the large-cap plays within I tend to prefer GOLD and AEM to RGLD and FNV as the former names attempted to peak their heads above their 50-day SMAs Friday but did CLOSE below. Looks for several consecutive CLOSES above in them.
Bond Bullying:
- "I used to think if there was reincarnation, I wanted to come back as the president or the pope or a .400 baseball hitter. But now I want to come back as the bond market. You can intimidate everybody." That was a quote by James Carville and I am already thinking about how I can make this fixed-income market my Halloween costume (suggestions welcome). There has been a lot of chatter about how Truss was the first to "pivot" but we quickly found out that was not the case as she simply needed to save Britain's pensions. But it does make one think the Fed is "trapped" and may be out of bullets even if they do decide to "pivot". Below is the chart of the TLT and we can see just how precipitous the decline has been since the March 2020 top in enormous volume with a 40 handle intra-month range. Will the very round par figure provide some temporary refuge? No one will know until hindsight, but when this finally makes a turn the move will be furious in the other direction. Bob Farrells quote comes to mind with this thinking "parabolic advances usually go further than you think, but they do not correct by going sideways."
Energized Seasonality:
- Whoever coined the phrase "sell in May and go away" must have been referring to the energy group. As one can see from the seasonality of the XLE the last 5 years would have been a prescient call. The expression insinuates that from May-October is would be prudent to be underweight, and after May the ETF has been lower for 5 straight months between June-October. This coming month tends to be weak with an average loss of 1.8% over the last 4 years and has finished the month lower than where it started 3 of the last 4 Octobers. But investors tend to look ahead and notice that 5 of the next 6 months tend to CLOSE higher than where they began and the months of November, January, and April favor the bold with average MONTHLY gains of 5.8, 5.3, and 7.8%. Of course, the vast majority of the fund is CVX and XOM and there is some slight divergence between the two notably this week as XOM rose 2% while CVX fell by .6%. Overall give the group credit as the XLE was the only major S&P sector of 11 to advance last week up more than 2%. Let's take a look at two of the better names in the arena.
- Integrated energy play up 55% YTD and 61% over last one year period. Dividend yield of 2.3%.
- Name 19% off most recent 52-week highs and bullish engulfing WEEKLY candle last week (WEEKLY chart could be considered cup with handle base). Great relative strength last week up 8.6% doubling gain of HES 4.2%.
- Earnings mostly higher up 3.6, 4, and 6% on 8/2, 5/3, and 2/2 after a loss of 3.9% on 11/2/21.
- Enter with buy stop above double bottom pivot.
- Entry MPC 101.72. Stop 95.
- Brazilian energy giant up 12% YTD and 19% over last one year period. Dividend yield of 51%.
- Name 20% off most recent 52-week highs and on current 5-week losing streak but has cut halfway into big 6-week winning streak weeks ending between 7/22-8/26 that rose by more than 60% top to bottom of range.
- Earnings mixed with gains of 6.6 and 3.1% on 7/29 and 5/6 and losses of 4.2 and 7% on 2/24 and 10/29/21.
- Enter after successful cup with handle retest/gap fill.
- Entry PBR here. Stop 11.50.
Good luck.