Something Feels Different:
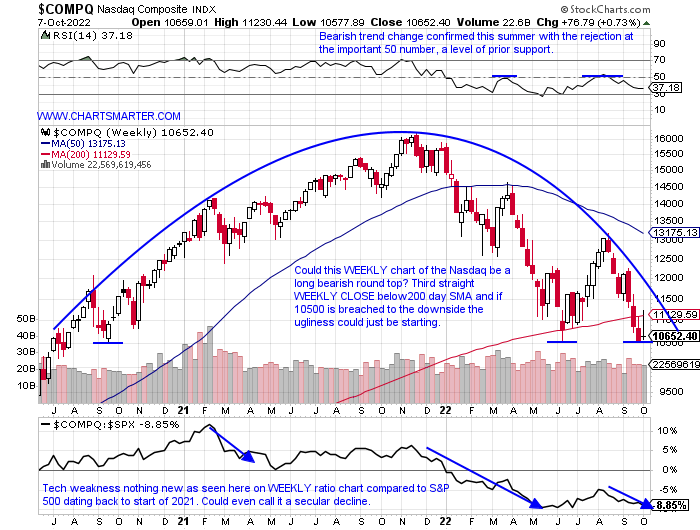
- As many attempts to decipher when the bottom may be in, a fruitless endeavor, PRICE action is clearly telling one that is not the case. Things can change pretty quickly but anyone fighting the trend this year has realized that bottom fishing is the most expensive sport. I was always taught that tops form in a very volatile manner and bottoms in the opposite tone with very smooth action, hardly what we are seeing today. Technology which is usually an investor's focus has been heavy this year and the chart below brings to mind the old adage that there "is no such thing as a triple bottom." And remember yields give a certain rivalry to equities and with the 2-year now yielding well more than 4% it is presenting a problem, especially for technology (greenback is another issue) which abhors rising rates. This week, a great example of this was the reaction in AMD which guided down and was torpedoed 14% on Friday. In the not-to-distant past, MU was able to shrug off doing the same. There is no reason to be a hero in this market on the long side. Preserving capital and cash is paramount here.
Seasonality Overload:
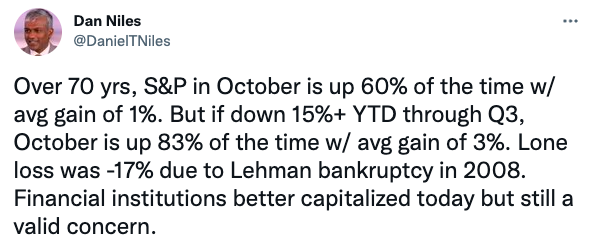
- Market participants by now have heard all the seasonality tailwinds ad nauseam as the start of Q4/October kicks off. And markets have not responded kindly. Many seem to have thrown in the towel on that belief as Monday and Tuesday soared, only to end the week with the S&P giving back 4% on Thursday and Friday. But as in life, when many abandon hope in a certain concept could that finally mean it could happen? Below is a tweet from Dan Niles on the subject that presents a bit of nuance. If October is down 15% through October YTD the average gain could be amplified. I remember another mention that within the month of October it does not ordinarily do so until the 9th. Of course, that is this Sunday when the market is not open so perhaps we will see another anemic Monday following through from Friday's sickly session (remember markets do not usually bottom on Fridays). Also, keep in mind the full moon is this weekend which may wreck some further havoc. Or could we witness another outlier like October did in 2008? As always let PRICE be your cue.
One By One:
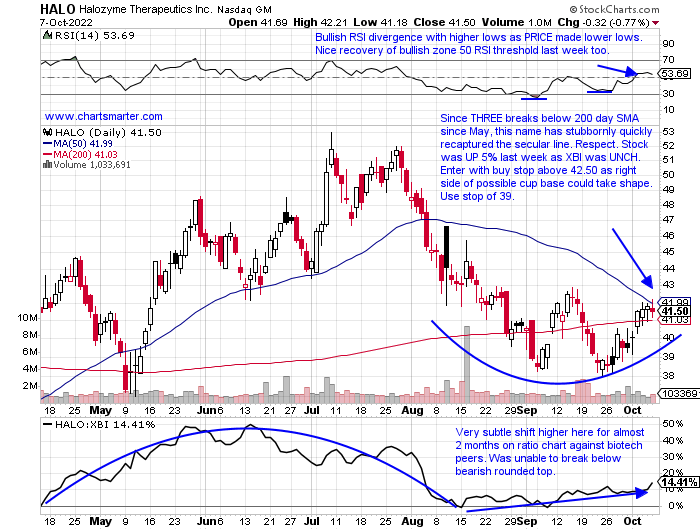
- Bear markets grind one's psyche not just with PRICE but time as well. Eventually, they get to all groups and we spoke of the possibility of a break below a bearish head and shoulders in the XBI in our Weekend Note a couple of weeks back. The abrupt move above its 200-day SMA with a bull flag taking shape never in early August was never taken out to the upside, and that was most likely a canary in the coal mine. The 50-day on the ETF now looks like it's ready to start curling lower again and some names that have taken a bruising include SGEN. It was rumored a few months back to be possibly taken over by MRK and it is now below the PRICE from the week ending 6/17 which jumped 19%. Some names have bucked the trend like an NBIX which we spoke about in our 9/28 Healthcare Note, but it reversed hard this past Tuesday and Friday. Below is an interesting former leader that was not affected much in Friday's selloff and that in my opinion is something to monitor very closely.
Where's The "Safety?":
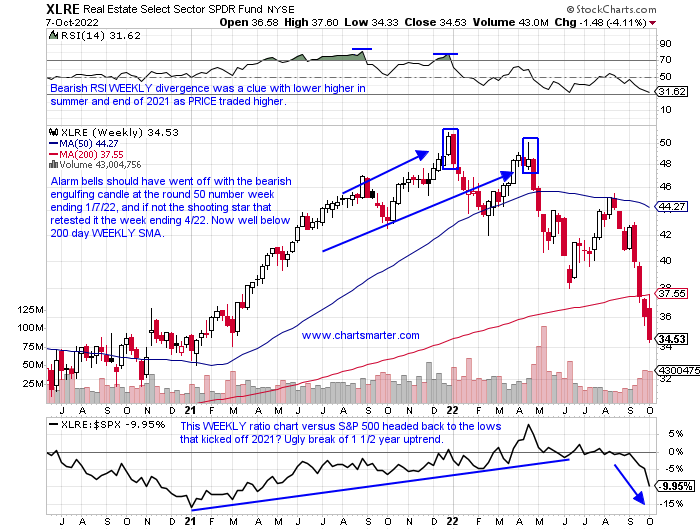
- For those old enough to remember the WEN slogan "Where's The Beef" that phrase was for you. Cover did not exist this past week and the chart below of the XLRE demonstrates the theme. The ETF is now yielding almost 5% and is a good example of why one should not invest solely for that purpose as it normally is joined by a vulnerable PRICE. It is interesting however that round number theory and candlesticks in the first half of 2022 would have avoided pain for shareholders. Enough of the Monday morning quarterbacking and last week the fund was the worst performer down more than 4% (the XLU was the second worst actor of the major 11 S&P sectors and it has advanced just 5 sessions over the last one month period) and volume trends are horrific with the last week of accumulation recorded the first week of September 2021. Stocks like RDFN, in the real estate services group, not a REIT, looks like it may travel to being nearly worthless after breaking below a bear flag. This name was at par in February 2021.
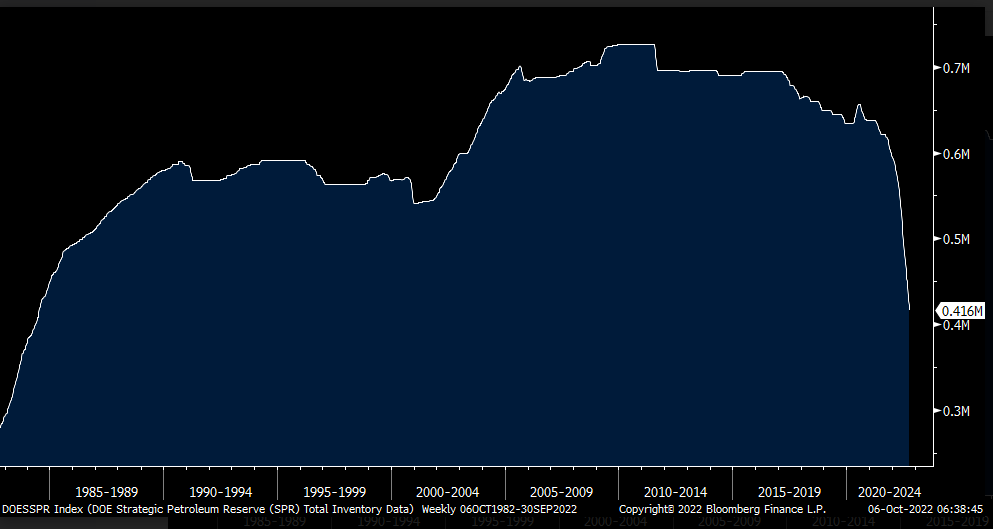
Energy Has Plenty Going For It:
- We can name a myriad of things that are providing the tailwind for the space, but momentum plain and simple should be at the top of the list. The XLE is now higher by more than 50% YTD, and its second nearest competitor is the utilities lower by 9%, an astounding divergence. Are we going back to the earlier regime where energy was the only game in town? This could very well be the case as the discrepancy was on display again this week with XLE up 13%, 10 points better than the second-best in industrials. We hear what happens if China comes back online, and this week was the OPEC snub, and the chart below this week from Peter Boockvar shows just how depleted the SPR is, back to nominal levels in 1984. No sector goes up in a straight line. Even energy registered some wild drawdowns with the 30% top to bottom-of-range haircut after a bearish evening star at the very round 90 number was completed on 6/9. Be patient and let us look at some possible opportunities when some softness emerges in the space. Keep in mind that XLE never came close to violating its bullish island reversal from 10/3.
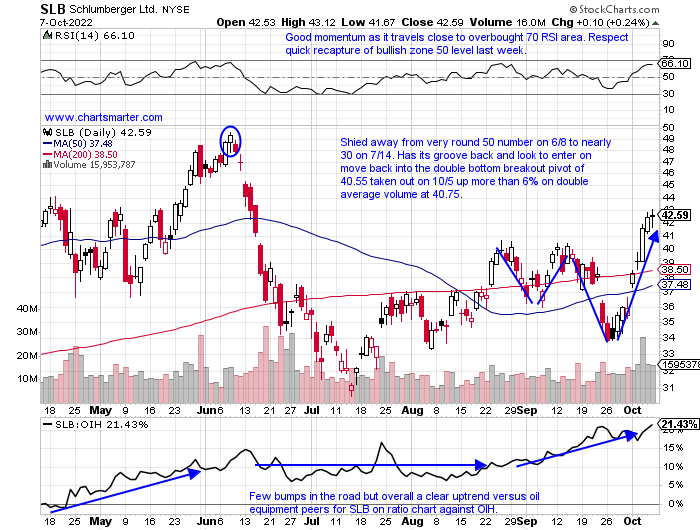
Leaders Within:
- Equipment name up 42% YTD and 37% over last one-year period. Dividend yield of 1.6%.
- Name 14% off most recent 52-week highs (peer HAL is 31% off its own annual peak) and the stock rose every day last week and on a WEEKLY basis rose almost 19%. Nice WEEKLY CLOSE above round 40 number.
- Earnings reactions mixed up 4.3 and 2.5% on 7/22 and 4/22 and losses of 1.9 and 1.1% on 1/21 and 10/22/21.
- Enter on pullback into double bottom breakout.
- Entry SLB 40.75. Stop 37 (REPORTS 10/21 before open).
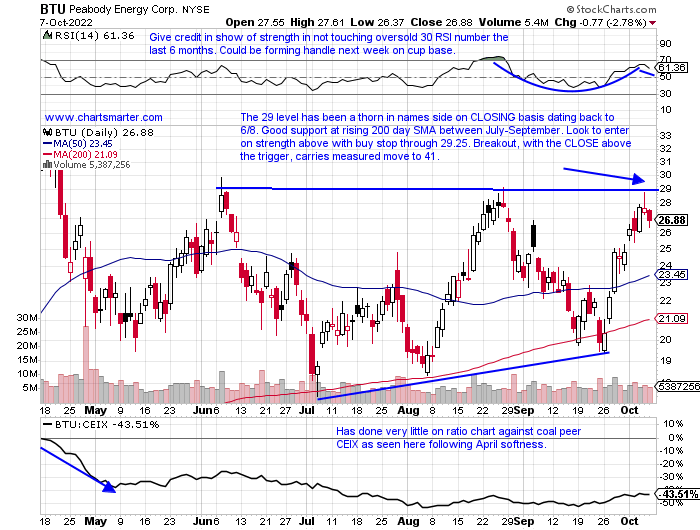
- Coal name (part of energy space) up 167% YTD and 63% over last one year period.
- Name 19% off most recent 52-week highs and this week up 8.3% but recorded spinning top after prior week jumped 25%. Bigger picture into year-end should gravitate toward WEEKLY cup base pivot of 33.39 in base that began in April.
- Earnings mostly lower off 3.1, 7.5, and 7.9% on 7/28, 4/28 and 10/28/21 (rose 9.9% on 2/10).
- Enter with buy stop above bullish ascending triangle.
- Entry BTU 29.25. Stop 26 (REPORT 10/27 before open).
Good luck.
This article requires a Chartsmarter membership. Please click here to join.
Something Feels Different:
- As many attempts to decipher when the bottom may be in, a fruitless endeavor, PRICE action is clearly telling one that is not the case. Things can change pretty quickly but anyone fighting the trend this year has realized that bottom fishing is the most expensive sport. I was always taught that tops form in a very volatile manner and bottoms in the opposite tone with very smooth action, hardly what we are seeing today. Technology which is usually an investor's focus has been heavy this year and the chart below brings to mind the old adage that there "is no such thing as a triple bottom." And remember yields give a certain rivalry to equities and with the 2-year now yielding well more than 4% it is presenting a problem, especially for technology (greenback is another issue) which abhors rising rates. This week, a great example of this was the reaction in AMD which guided down and was torpedoed 14% on Friday. In the not-to-distant past, MU was able to shrug off doing the same. There is no reason to be a hero in this market on the long side. Preserving capital and cash is paramount here.
Seasonality Overload:
- Market participants by now have heard all the seasonality tailwinds ad nauseam as the start of Q4/October kicks off. And markets have not responded kindly. Many seem to have thrown in the towel on that belief as Monday and Tuesday soared, only to end the week with the S&P giving back 4% on Thursday and Friday. But as in life, when many abandon hope in a certain concept could that finally mean it could happen? Below is a tweet from Dan Niles on the subject that presents a bit of nuance. If October is down 15% through October YTD the average gain could be amplified. I remember another mention that within the month of October it does not ordinarily do so until the 9th. Of course, that is this Sunday when the market is not open so perhaps we will see another anemic Monday following through from Friday's sickly session (remember markets do not usually bottom on Fridays). Also, keep in mind the full moon is this weekend which may wreck some further havoc. Or could we witness another outlier like October did in 2008? As always let PRICE be your cue.
One By One:
- Bear markets grind one's psyche not just with PRICE but time as well. Eventually, they get to all groups and we spoke of the possibility of a break below a bearish head and shoulders in the XBI in our Weekend Note a couple of weeks back. The abrupt move above its 200-day SMA with a bull flag taking shape never in early August was never taken out to the upside, and that was most likely a canary in the coal mine. The 50-day on the ETF now looks like it's ready to start curling lower again and some names that have taken a bruising include SGEN. It was rumored a few months back to be possibly taken over by MRK and it is now below the PRICE from the week ending 6/17 which jumped 19%. Some names have bucked the trend like an NBIX which we spoke about in our 9/28 Healthcare Note, but it reversed hard this past Tuesday and Friday. Below is an interesting former leader that was not affected much in Friday's selloff and that in my opinion is something to monitor very closely.
Where's The "Safety?":
- For those old enough to remember the WEN slogan "Where's The Beef" that phrase was for you. Cover did not exist this past week and the chart below of the XLRE demonstrates the theme. The ETF is now yielding almost 5% and is a good example of why one should not invest solely for that purpose as it normally is joined by a vulnerable PRICE. It is interesting however that round number theory and candlesticks in the first half of 2022 would have avoided pain for shareholders. Enough of the Monday morning quarterbacking and last week the fund was the worst performer down more than 4% (the XLU was the second worst actor of the major 11 S&P sectors and it has advanced just 5 sessions over the last one month period) and volume trends are horrific with the last week of accumulation recorded the first week of September 2021. Stocks like RDFN, in the real estate services group, not a REIT, looks like it may travel to being nearly worthless after breaking below a bear flag. This name was at par in February 2021.
Energy Has Plenty Going For It:
- We can name a myriad of things that are providing the tailwind for the space, but momentum plain and simple should be at the top of the list. The XLE is now higher by more than 50% YTD, and its second nearest competitor is the utilities lower by 9%, an astounding divergence. Are we going back to the earlier regime where energy was the only game in town? This could very well be the case as the discrepancy was on display again this week with XLE up 13%, 10 points better than the second-best in industrials. We hear what happens if China comes back online, and this week was the OPEC snub, and the chart below this week from Peter Boockvar shows just how depleted the SPR is, back to nominal levels in 1984. No sector goes up in a straight line. Even energy registered some wild drawdowns with the 30% top to bottom-of-range haircut after a bearish evening star at the very round 90 number was completed on 6/9. Be patient and let us look at some possible opportunities when some softness emerges in the space. Keep in mind that XLE never came close to violating its bullish island reversal from 10/3.
Leaders Within:
- Equipment name up 42% YTD and 37% over last one-year period. Dividend yield of 1.6%.
- Name 14% off most recent 52-week highs (peer HAL is 31% off its own annual peak) and the stock rose every day last week and on a WEEKLY basis rose almost 19%. Nice WEEKLY CLOSE above round 40 number.
- Earnings reactions mixed up 4.3 and 2.5% on 7/22 and 4/22 and losses of 1.9 and 1.1% on 1/21 and 10/22/21.
- Enter on pullback into double bottom breakout.
- Entry SLB 40.75. Stop 37 (REPORTS 10/21 before open).
- Coal name (part of energy space) up 167% YTD and 63% over last one year period.
- Name 19% off most recent 52-week highs and this week up 8.3% but recorded spinning top after prior week jumped 25%. Bigger picture into year-end should gravitate toward WEEKLY cup base pivot of 33.39 in base that began in April.
- Earnings mostly lower off 3.1, 7.5, and 7.9% on 7/28, 4/28 and 10/28/21 (rose 9.9% on 2/10).
- Enter with buy stop above bullish ascending triangle.
- Entry BTU 29.25. Stop 26 (REPORT 10/27 before open).
Good luck.