"If you think adventure is dangerous, try routine. It is lethal." Paulo Cuehlo
Been Around The World And I I I:
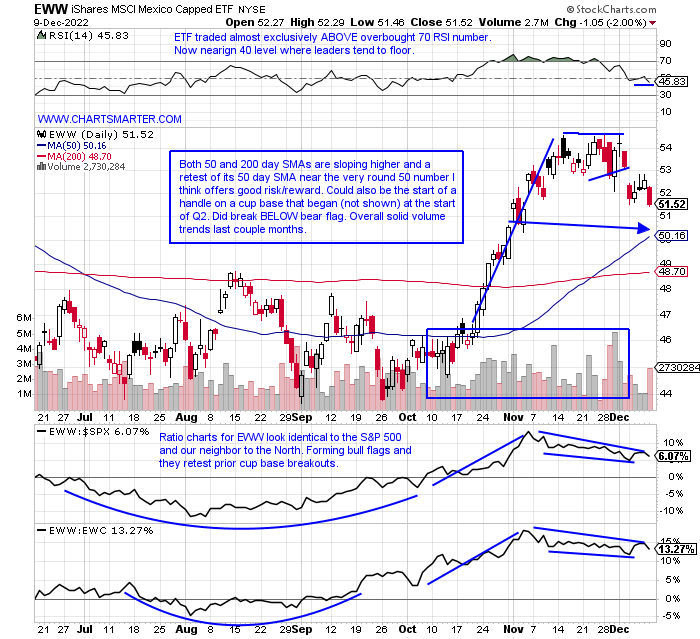
- Perhaps it is time for a trip down South. Glancing through the globe this week saw some interesting divergences. Germany via the EWG ended a 9-week winning streak, and give it credit for trading above its 50 and 200-day SMA and just above its bull flag pivot of 25 (which carries a measured move to 29). EWH (Hong Kong) actually put up a very solid week relatively speaking up almost 4%. A region that fell along with our domestic markets but is showing very good relative strength is Mexico. It is the only ETF currently less than 10% off its most recent 52-week highs, sitting 8% off its peak in early April (more than half of that came in just the last 2 weeks that slipped a combined 4.6%). That was the scene of a bearish engulfing candle the week ending 4/8 that slipped 4%. On 12/1 it recorded a bearish doji candle and has been somewhat soft since. An individual name I like in the country is FMX. It has quickly traded from 60 to 80 and has advanced 9 of the last 11 weeks. But I still think EWW at 50.50 is a solid idea into year-end.
Ten-Year Anxiety:
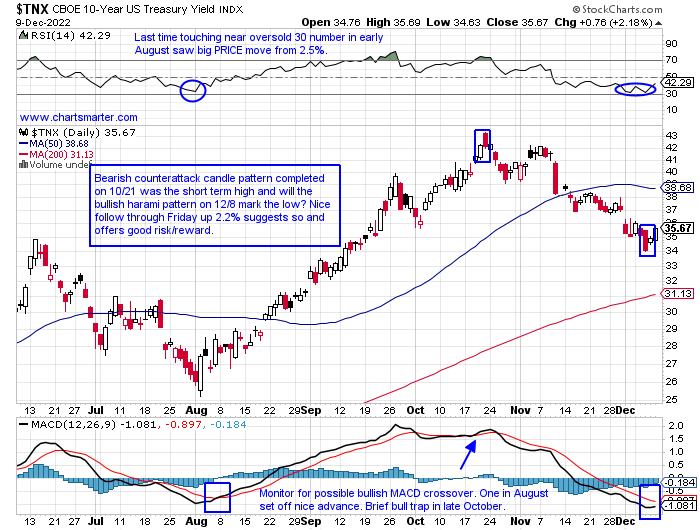
- With the ten-year yield in almost constant focus this year to look for market direction, this week may have seen a reversal of the downtrend. From a high of 4.3% in late October to its low this week of 3.4% it fell almost 21%. The instrument recorded a very strong 12-week winning streak the weeks ending between 8/5-10/21 that jumped by a total of 70.6%. The recent pullback has given back almost precisely half of that gain. The bulls would love to see a rare gap to the upside next week to complete an island reversal after the gap down on 12/1. That session also had the look of a bearish head and shoulders breakdown, but PRICE action itself is omnipotent. Friday's PRICE action I believe marked a short-term bottom and a good place to put on a long bet with good risk/reward. This could very well put a damper on a December rally. Just to demonstrate the inverse relationship between the ten-year and equities, the week ending 11/11 when the ten-year fell 8.2%, the S&P 500 screamed higher by 5.9%.
Recession Chatter:
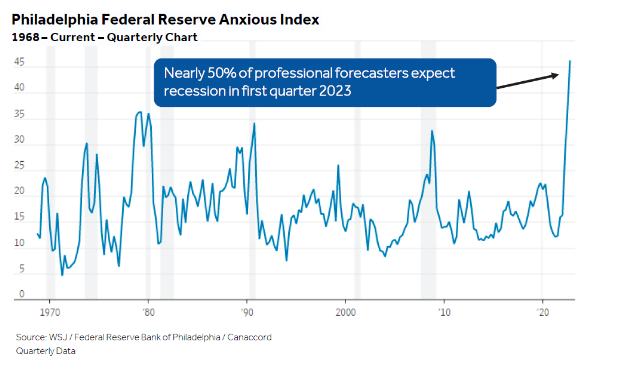
- The famous adage goes something like "that economists have predicted 5 of the last one recessions". Whether it is doom and gloom that sells or they are just pessimists by nature, no one knows, but the more people anticipate something I have found the less likely it is to occur. Below is the chart of professional forecasters, I believe it may be portfolio managers and the like (different from economists as they actually manage money), and notice that 1 in 2 believe we will see a recession in the first quarter of 2023, the highest level going back to 1968. Over my many years in the business I have found the more investors presume something it is already PRICED in, and if it does not come to fruition there could be a violent move in the opposite direction as positions are unwound. The weakness in energy over the last one month period, being the only major S&P sector of 11 in the red for the time period, may be saying softness in the economy is coming but it may just be giving back some of its extraordinary gains over the last couple years.
Anti-Recessionary Signal?
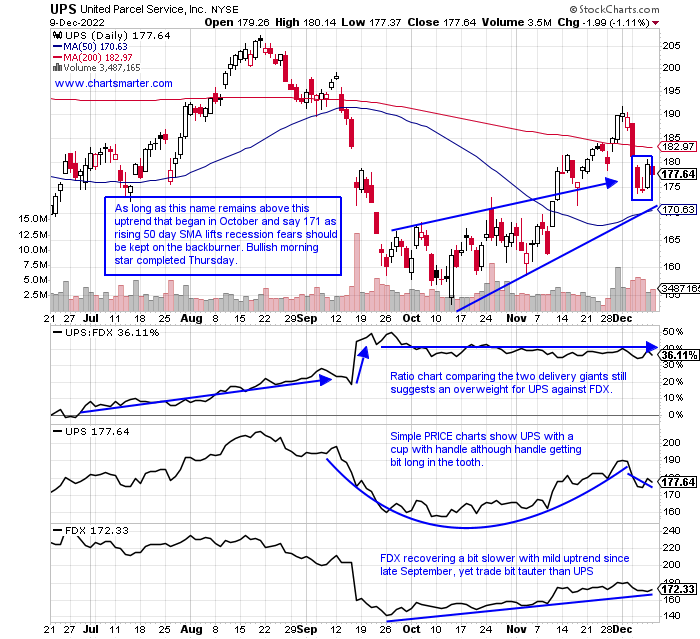
- Looking at the possibility of why a recession may not happen from the chart above, is the action in the chart below of UPS. Last week the stock fell more than 6% ending a 4 week winning streak and Monday slipped back below the 200 day SMA. But overall one would think this name would not be making higher lows the last 3 months if a recession was imminent. That bullish theme is negated with a drop below 171. FDX has been underperforming its peer UPS but I could see that filling in an upside gap at the very round 200 number from the 9/15 session into year-end before another potential leg lower. Being openminded softness within the XLY (consumer spending accounts for 2/3rds of GDP) from AMZN and TSLA is not the only concern within the sector. The "equal weighted" XRT is now sporting a short bear flag after a promising bullish inverse head and shoulders formation unraveled last week. LULU certainly did not inspire confidence with a 13% hair cut Friday after earnings slicing below a 337.24 cup with handle breakout pivot in the process.
Equipment Failure:
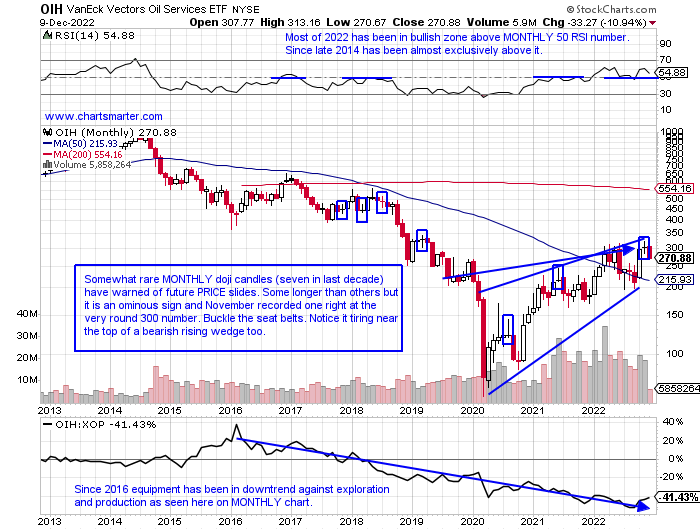
- Is it a dangerous sign for the overall markets that it is losing its one steady leader in energy in the last 2 years now? Are investors looking to liquidate wherever they may still have profits here? Below is the MONTHLY chart of the OIH and I have highlighted the doji candles. They are normally adept at signaling trend changes and often signal exhaustion. Has the move from 65 to above 300 last month been fatiguing? The last 2 doji candles came during the MONTHS of August 2020 and June 2021, both gravestone dojis candles, and fell the very next months respectively by 21.9 and 15.5%. If we take that into account this month we could see a move back toward the lower end of this range between the very round 200-300 numbers, which began this January with the push above 200. If the OIH does show some softness after last month's doji candle into year-end the microcap of Forum Energy Technologies near 27 may be worth a long look. We analyze its chart at the bottom of this note.
Sell In May And Go Away?
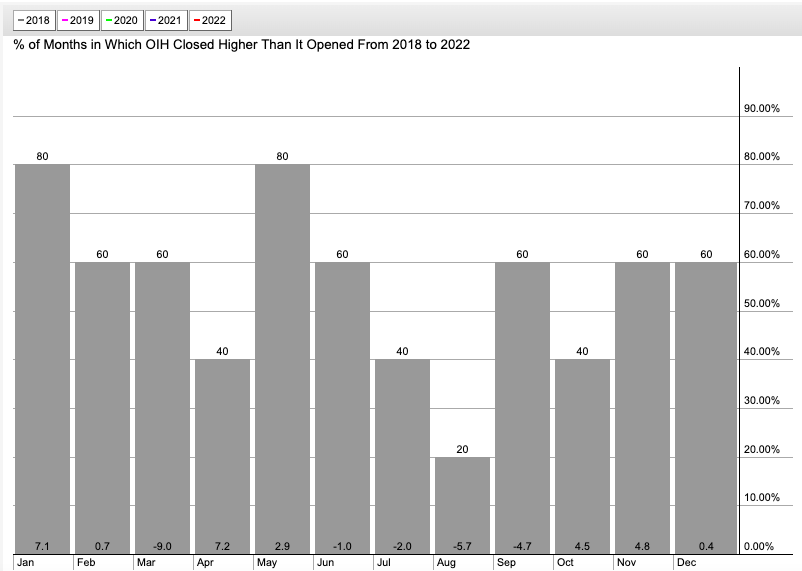
- In recent years market strength in November may just be the "Santa Rally" coming early. It is prevalent across all sectors, even the energy equipment names. Notice below that the OIH has recorded nice returns since 2018 in October-November only to have a flat December. Perhaps it is just digesting the combined 9% return the prior two months before January takes off like a rocket, CLOSING the month higher than where it started 4 of the last 5 years averaging a gain of 7.1%. Seasonality also shows some interesting data here with the first months of each of the first 2 quarters of the year rising at least 7% (April). And the old adage "sell in May and go away" seems to hold some truth, at least with the OIH the last 5 years as it has registered FOUR straight negative average MONTHLY losses between June-September. The outlier month is March which is down 9%.
Forum Energy Technologies:
- Energy equipment play up 79% YTD and 64% over last one year period.
- Microcap now 7% off most recent 52-week highs as OIH is 16% off its annual peak. Good relative strength last week off 4.7% as the OIH dipped 12.1%. Since 8/29 has been above 30 intraday 9 sessions but just 2 CLOSED above figure.
- Three straight positive earnings reactions up .9%, 17%, and 1.2% on 11/9, 8/5 and 5/6.
- Enter on pullback into bullish WEEKLY ascending triangle breakout.
- Entry FET 27. Stop 24.
Good luck.
This article requires a Chartsmarter membership. Please click here to join.
"If you think adventure is dangerous, try routine. It is lethal." Paulo Cuehlo
Been Around The World And I I I:
- Perhaps it is time for a trip down South. Glancing through the globe this week saw some interesting divergences. Germany via the EWG ended a 9-week winning streak, and give it credit for trading above its 50 and 200-day SMA and just above its bull flag pivot of 25 (which carries a measured move to 29). EWH (Hong Kong) actually put up a very solid week relatively speaking up almost 4%. A region that fell along with our domestic markets but is showing very good relative strength is Mexico. It is the only ETF currently less than 10% off its most recent 52-week highs, sitting 8% off its peak in early April (more than half of that came in just the last 2 weeks that slipped a combined 4.6%). That was the scene of a bearish engulfing candle the week ending 4/8 that slipped 4%. On 12/1 it recorded a bearish doji candle and has been somewhat soft since. An individual name I like in the country is FMX. It has quickly traded from 60 to 80 and has advanced 9 of the last 11 weeks. But I still think EWW at 50.50 is a solid idea into year-end.
Ten-Year Anxiety:
- With the ten-year yield in almost constant focus this year to look for market direction, this week may have seen a reversal of the downtrend. From a high of 4.3% in late October to its low this week of 3.4% it fell almost 21%. The instrument recorded a very strong 12-week winning streak the weeks ending between 8/5-10/21 that jumped by a total of 70.6%. The recent pullback has given back almost precisely half of that gain. The bulls would love to see a rare gap to the upside next week to complete an island reversal after the gap down on 12/1. That session also had the look of a bearish head and shoulders breakdown, but PRICE action itself is omnipotent. Friday's PRICE action I believe marked a short-term bottom and a good place to put on a long bet with good risk/reward. This could very well put a damper on a December rally. Just to demonstrate the inverse relationship between the ten-year and equities, the week ending 11/11 when the ten-year fell 8.2%, the S&P 500 screamed higher by 5.9%.
Recession Chatter:
- The famous adage goes something like "that economists have predicted 5 of the last one recessions". Whether it is doom and gloom that sells or they are just pessimists by nature, no one knows, but the more people anticipate something I have found the less likely it is to occur. Below is the chart of professional forecasters, I believe it may be portfolio managers and the like (different from economists as they actually manage money), and notice that 1 in 2 believe we will see a recession in the first quarter of 2023, the highest level going back to 1968. Over my many years in the business I have found the more investors presume something it is already PRICED in, and if it does not come to fruition there could be a violent move in the opposite direction as positions are unwound. The weakness in energy over the last one month period, being the only major S&P sector of 11 in the red for the time period, may be saying softness in the economy is coming but it may just be giving back some of its extraordinary gains over the last couple years.
Anti-Recessionary Signal?
- Looking at the possibility of why a recession may not happen from the chart above, is the action in the chart below of UPS. Last week the stock fell more than 6% ending a 4 week winning streak and Monday slipped back below the 200 day SMA. But overall one would think this name would not be making higher lows the last 3 months if a recession was imminent. That bullish theme is negated with a drop below 171. FDX has been underperforming its peer UPS but I could see that filling in an upside gap at the very round 200 number from the 9/15 session into year-end before another potential leg lower. Being openminded softness within the XLY (consumer spending accounts for 2/3rds of GDP) from AMZN and TSLA is not the only concern within the sector. The "equal weighted" XRT is now sporting a short bear flag after a promising bullish inverse head and shoulders formation unraveled last week. LULU certainly did not inspire confidence with a 13% hair cut Friday after earnings slicing below a 337.24 cup with handle breakout pivot in the process.
Equipment Failure:
- Is it a dangerous sign for the overall markets that it is losing its one steady leader in energy in the last 2 years now? Are investors looking to liquidate wherever they may still have profits here? Below is the MONTHLY chart of the OIH and I have highlighted the doji candles. They are normally adept at signaling trend changes and often signal exhaustion. Has the move from 65 to above 300 last month been fatiguing? The last 2 doji candles came during the MONTHS of August 2020 and June 2021, both gravestone dojis candles, and fell the very next months respectively by 21.9 and 15.5%. If we take that into account this month we could see a move back toward the lower end of this range between the very round 200-300 numbers, which began this January with the push above 200. If the OIH does show some softness after last month's doji candle into year-end the microcap of Forum Energy Technologies near 27 may be worth a long look. We analyze its chart at the bottom of this note.
Sell In May And Go Away?
- In recent years market strength in November may just be the "Santa Rally" coming early. It is prevalent across all sectors, even the energy equipment names. Notice below that the OIH has recorded nice returns since 2018 in October-November only to have a flat December. Perhaps it is just digesting the combined 9% return the prior two months before January takes off like a rocket, CLOSING the month higher than where it started 4 of the last 5 years averaging a gain of 7.1%. Seasonality also shows some interesting data here with the first months of each of the first 2 quarters of the year rising at least 7% (April). And the old adage "sell in May and go away" seems to hold some truth, at least with the OIH the last 5 years as it has registered FOUR straight negative average MONTHLY losses between June-September. The outlier month is March which is down 9%.
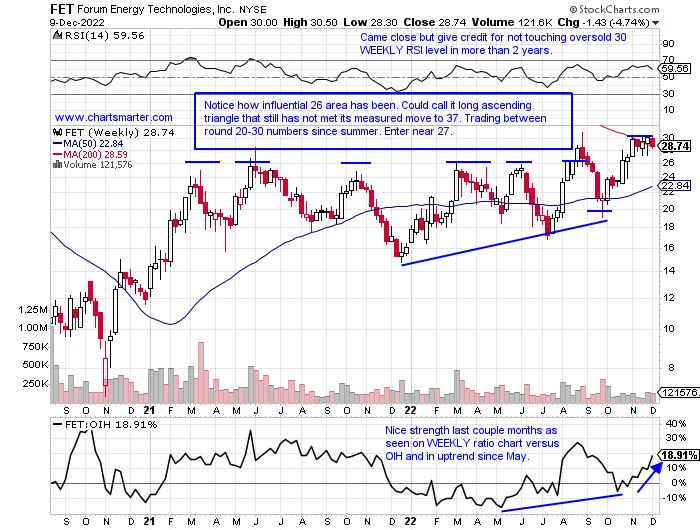
Forum Energy Technologies:
- Energy equipment play up 79% YTD and 64% over last one year period.
- Microcap now 7% off most recent 52-week highs as OIH is 16% off its annual peak. Good relative strength last week off 4.7% as the OIH dipped 12.1%. Since 8/29 has been above 30 intraday 9 sessions but just 2 CLOSED above figure.
- Three straight positive earnings reactions up .9%, 17%, and 1.2% on 11/9, 8/5 and 5/6.
- Enter on pullback into bullish WEEKLY ascending triangle breakout.
- Entry FET 27. Stop 24.
Good luck.