"Many problems are minor when you solve them right away, but grow into an enormous conflict when you let them linger." -James Clear
Unlucky Number 13:
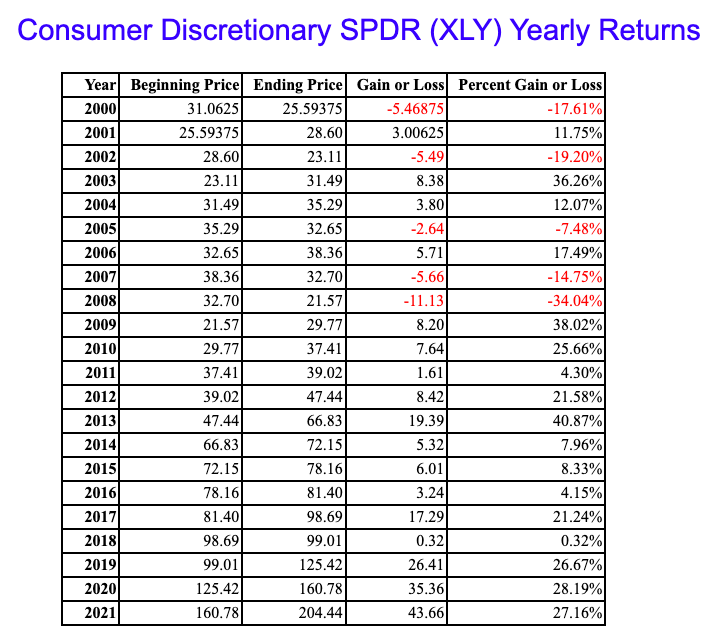
- The above quote is attributable to what can potentially happen in bear markets if you do not honor PRICE action. Below is a chart of the annual returns of the XLY from 1stock1.com, and notice 2022 will put an end to a very impressive 13-year winning streak (2018 barely eked out a gain). Technology is the only other major S&P sector that almost matched that feat, but fell by a scant .3% in 2018. Notice negative yearly returns for the XLY tend to come in bunches with 5 of the 9 years between 2000-2008 being down, with some significantly. Is this a sign that the consumer sector is in for a rough patch over the next several years? Of course, we will not learn of that until hindsight. AMZN will have a big say in that although the more it declines the lesser the bearish impact will be. But the chart is sporting a bear flag and a move below 85 will carry a measured move to the very round 50 number. Both AMZN and TSLA recorded stock splits this year and in recent times stocks have not fared well following them.
Fatigued Consumer:
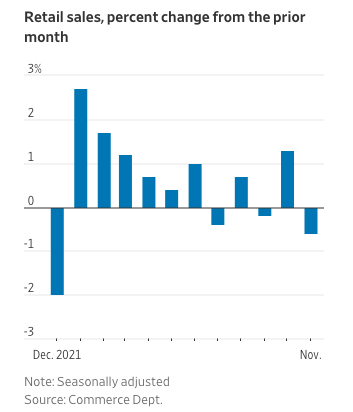
- This past week retail sales data for the month of November came in very soft. In fact, it was the biggest decline of 2022. Perhaps they will rebound with the holiday season in full swing in December but notice the trend all year has been anything but sanguine. The first 5 months of 2022 all fell more than the last, and the last 6 were in a one-up one-down pattern. Food and healthcare and restaurant purchases were the lone bright spot but obviously, these are examples of basic needs. This could be why casual diners have been somewhat of a bright spot in the discretionary sector. Over the last one month period, we witnessed nice gains from WEN up 12% and it has been the subject of takeover chatter. It is acting well POST breakout from a 21.60 double bottom with handle pivot from 11/22. YUMC is bull flagging and ARMK is coming back to retest an impressive cup base pivot of 23.27 taken out on 11/10. Bon appetit. Pay attention to names doing their best to shrug off the softness.
Uncanny Correlation:
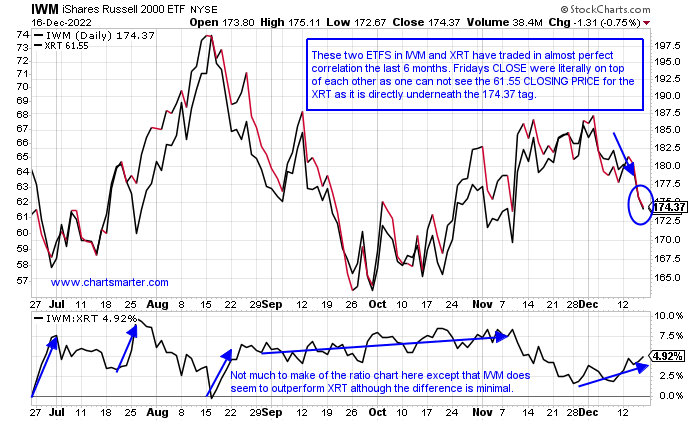
- I am a believer that small-cap stocks tend to lead. The IWM is always a good barometer of the space and the Russell 2000 is having a tough time in 2022 as ZIRP is now firmly in the rearview mirror, as they thrived on cheap interest costs. Continuing the consumer-related theme in this note, could one now simply interchange the IWM with the XRT? I often call the latter the "equal weighted" and smaller cap discretionary ETF. The largest holdings in the fund are now more than 1.5% compared to the top-heavy XLY where TSLA and AMZN make up more than 40%, so it gives a broader view of the overall space. The similarities between the IWM and XRT were present throughout most of 2021 too. They both traded sideways from roughly February-November that year and each recorded good-looking breakouts through long flat bases that proved to be bull traps as they fell apart almost instantly. The XRT screamed higher by 7.8% the week ending 11/5/21 and just a fortnight later lost more than a combined 10% the weeks ending between 11/26-12/3. That very same week the IWM jumped 6% before cratering as well. The Dow and S&P 500 waited another whole month before encountering weakness. Keep an eye on the IWM and XRT for some outsized strength in the coming weeks to see if the overall markets are ready to make a meaningful low.
Housing Headache Ahead?
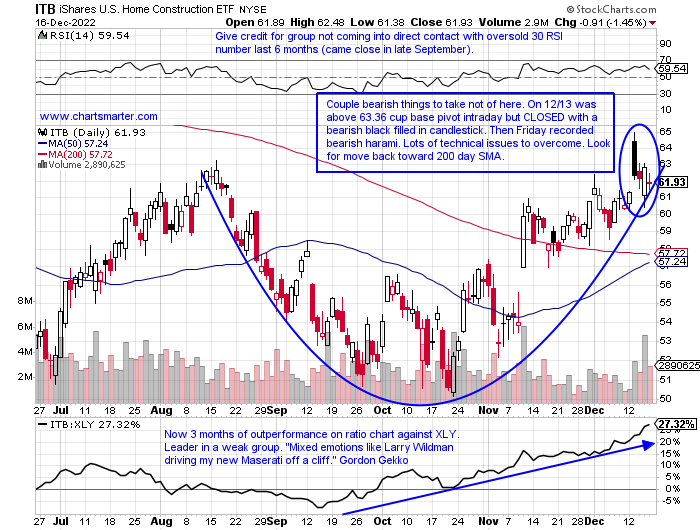
- In the very diverse consumer discretionary sector this past week the only subsectors that rose were the home builders and home improvements names. That kind of strength should be commended as the XLY was easily the worst-performing major S&P sector off by 4%. Both HD and LOW were higher for the week and inside the home construction arena, nearly every name rose at least 1%. LEN was most responsible for the move advancing more than 4% this week and has risen 6 of the last 8, including two double-digit WEEKLY gainers ending 10/28 and 1/11. Below is the chart of the ITB and we know when a promising breakout unravels quickly it is a warning. Technically the ETF never CLOSED above the 63.36 pivot (was above intraday on 12/13), but the fact that two bearish candlesticks occurred in such close proximity this week is worrisome. Buying leaders in a bear market climate is something many investors struggle with (best to maintain large cash positions and trade tactically), but its relative strength should be noted. Keep in mind this is a group that has a genuine pulse on the potential direction of interest rates. A deterioration here could signal that they may resume their uptrend.
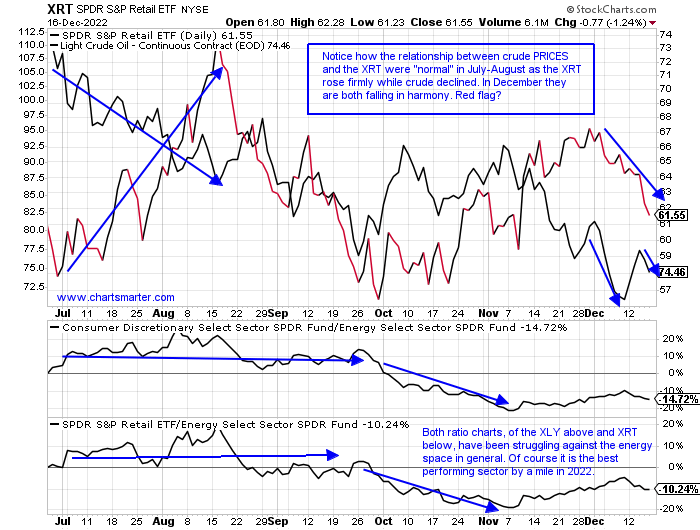
Crude Awakening:
- Successful strategies/theories of the past of any kind tend to lose their luster the more they are followed. One of the intermarket relationships that were eyeballed plenty previously was that between crude PRICES and the consumer sector. Logically it made sense as the more consumers paid at the pump the weaker their desire would be to purchase goods. Below is the PRICE chart comparing the XRT to WTI crude. The association was on point this summer in July-August as the XLY rose handsomely with crude dropping. Presently one can see this month so far both are declining. Is that a canary in the coal mine of further weakness in consumer names if it can not act well in the face of that softening? My bet is yes. It is already a weak group and we know trends once in place tend to remain that way more likely than they are to reverse. And another negative clue recently was the strength of some real laggards. When action gets frothy in names like GRWG which rose more than 72% the week ending 11/11 and another 37% the week ending 12/2 it's a wake-up call. Or a RENT which last week jumped 33% on top of the prior week screaming upward of 95%. Lets take a look at 2 names that look attractive.
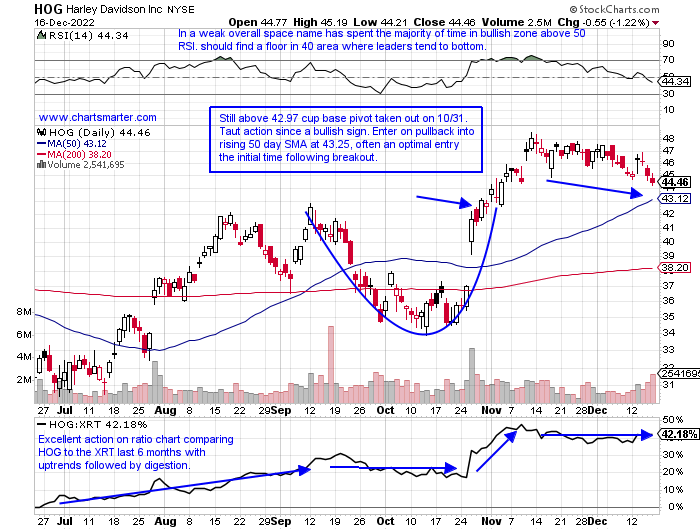
Harley Davidson:
- Lesiure/auto play up 18% YTD and 20% over the last one year period. Dividend yield of 1.4%.
- Name just 9% off most recent 52-week highs (XRT 34% off its annual peak) and on 3-week losing streak but losses minimal overall. Right back to WEEKLY 44.56 double bottom pivot taken out week ending 11/4 in 1 1/2 year base.
- Earnings mostly higher up 12.6, 7.8, and 15.5% on 10/26, 7/28, and 2/8 and small drop of .5% on 4/27.
- Enter on pullback into rising 50-day SMA after recent breakout.
- Entry HOG 43.25. Stop 41.
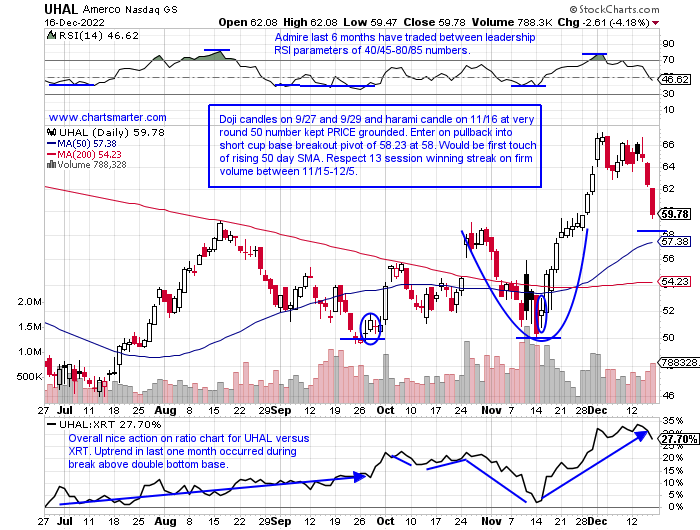
Amerco:
- Rental play lower by 18% YTD and 16% over last one year period.
- Fell more than 7% last week but is still in the upper half of 3-week winning streak between weeks ending 11/18-12/2 that jumped by a combined 25%.
- Earnings mixed up 1.3 and 1.2% on 11/9 and 8/4 and fell 3.9 and 3.6% on 5/26 and 2/10.
- Enter on pullback into rising 50-day SMA after recent breakout.
- Entry UHAL 58. Stop 54.
Good luck.
This article requires a Chartsmarter membership. Please click here to join.
"Many problems are minor when you solve them right away, but grow into an enormous conflict when you let them linger." -James Clear
Unlucky Number 13:
- The above quote is attributable to what can potentially happen in bear markets if you do not honor PRICE action. Below is a chart of the annual returns of the XLY from 1stock1.com, and notice 2022 will put an end to a very impressive 13-year winning streak (2018 barely eked out a gain). Technology is the only other major S&P sector that almost matched that feat, but fell by a scant .3% in 2018. Notice negative yearly returns for the XLY tend to come in bunches with 5 of the 9 years between 2000-2008 being down, with some significantly. Is this a sign that the consumer sector is in for a rough patch over the next several years? Of course, we will not learn of that until hindsight. AMZN will have a big say in that although the more it declines the lesser the bearish impact will be. But the chart is sporting a bear flag and a move below 85 will carry a measured move to the very round 50 number. Both AMZN and TSLA recorded stock splits this year and in recent times stocks have not fared well following them.
Fatigued Consumer:
- This past week retail sales data for the month of November came in very soft. In fact, it was the biggest decline of 2022. Perhaps they will rebound with the holiday season in full swing in December but notice the trend all year has been anything but sanguine. The first 5 months of 2022 all fell more than the last, and the last 6 were in a one-up one-down pattern. Food and healthcare and restaurant purchases were the lone bright spot but obviously, these are examples of basic needs. This could be why casual diners have been somewhat of a bright spot in the discretionary sector. Over the last one month period, we witnessed nice gains from WEN up 12% and it has been the subject of takeover chatter. It is acting well POST breakout from a 21.60 double bottom with handle pivot from 11/22. YUMC is bull flagging and ARMK is coming back to retest an impressive cup base pivot of 23.27 taken out on 11/10. Bon appetit. Pay attention to names doing their best to shrug off the softness.
Uncanny Correlation:
- I am a believer that small-cap stocks tend to lead. The IWM is always a good barometer of the space and the Russell 2000 is having a tough time in 2022 as ZIRP is now firmly in the rearview mirror, as they thrived on cheap interest costs. Continuing the consumer-related theme in this note, could one now simply interchange the IWM with the XRT? I often call the latter the "equal weighted" and smaller cap discretionary ETF. The largest holdings in the fund are now more than 1.5% compared to the top-heavy XLY where TSLA and AMZN make up more than 40%, so it gives a broader view of the overall space. The similarities between the IWM and XRT were present throughout most of 2021 too. They both traded sideways from roughly February-November that year and each recorded good-looking breakouts through long flat bases that proved to be bull traps as they fell apart almost instantly. The XRT screamed higher by 7.8% the week ending 11/5/21 and just a fortnight later lost more than a combined 10% the weeks ending between 11/26-12/3. That very same week the IWM jumped 6% before cratering as well. The Dow and S&P 500 waited another whole month before encountering weakness. Keep an eye on the IWM and XRT for some outsized strength in the coming weeks to see if the overall markets are ready to make a meaningful low.
Housing Headache Ahead?
- In the very diverse consumer discretionary sector this past week the only subsectors that rose were the home builders and home improvements names. That kind of strength should be commended as the XLY was easily the worst-performing major S&P sector off by 4%. Both HD and LOW were higher for the week and inside the home construction arena, nearly every name rose at least 1%. LEN was most responsible for the move advancing more than 4% this week and has risen 6 of the last 8, including two double-digit WEEKLY gainers ending 10/28 and 1/11. Below is the chart of the ITB and we know when a promising breakout unravels quickly it is a warning. Technically the ETF never CLOSED above the 63.36 pivot (was above intraday on 12/13), but the fact that two bearish candlesticks occurred in such close proximity this week is worrisome. Buying leaders in a bear market climate is something many investors struggle with (best to maintain large cash positions and trade tactically), but its relative strength should be noted. Keep in mind this is a group that has a genuine pulse on the potential direction of interest rates. A deterioration here could signal that they may resume their uptrend.
Crude Awakening:
- Successful strategies/theories of the past of any kind tend to lose their luster the more they are followed. One of the intermarket relationships that were eyeballed plenty previously was that between crude PRICES and the consumer sector. Logically it made sense as the more consumers paid at the pump the weaker their desire would be to purchase goods. Below is the PRICE chart comparing the XRT to WTI crude. The association was on point this summer in July-August as the XLY rose handsomely with crude dropping. Presently one can see this month so far both are declining. Is that a canary in the coal mine of further weakness in consumer names if it can not act well in the face of that softening? My bet is yes. It is already a weak group and we know trends once in place tend to remain that way more likely than they are to reverse. And another negative clue recently was the strength of some real laggards. When action gets frothy in names like GRWG which rose more than 72% the week ending 11/11 and another 37% the week ending 12/2 it's a wake-up call. Or a RENT which last week jumped 33% on top of the prior week screaming upward of 95%. Lets take a look at 2 names that look attractive.
Harley Davidson:
- Lesiure/auto play up 18% YTD and 20% over the last one year period. Dividend yield of 1.4%.
- Name just 9% off most recent 52-week highs (XRT 34% off its annual peak) and on 3-week losing streak but losses minimal overall. Right back to WEEKLY 44.56 double bottom pivot taken out week ending 11/4 in 1 1/2 year base.
- Earnings mostly higher up 12.6, 7.8, and 15.5% on 10/26, 7/28, and 2/8 and small drop of .5% on 4/27.
- Enter on pullback into rising 50-day SMA after recent breakout.
- Entry HOG 43.25. Stop 41.
Amerco:
- Rental play lower by 18% YTD and 16% over last one year period.
- Fell more than 7% last week but is still in the upper half of 3-week winning streak between weeks ending 11/18-12/2 that jumped by a combined 25%.
- Earnings mixed up 1.3 and 1.2% on 11/9 and 8/4 and fell 3.9 and 3.6% on 5/26 and 2/10.
- Enter on pullback into rising 50-day SMA after recent breakout.
- Entry UHAL 58. Stop 54.
Good luck.