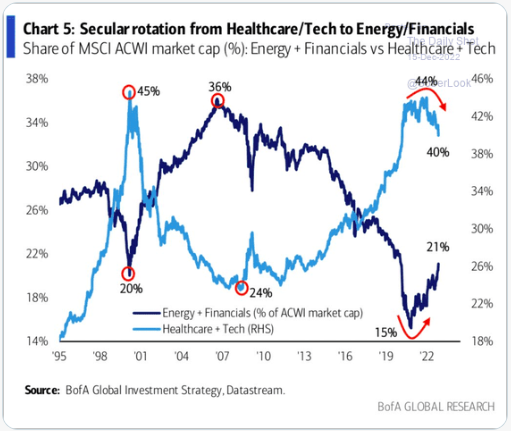
Is Tech Impotence Just Getting Started?
- Technology weakness was on full display in 2022. After annual gains of 39, 50, and 44, and 35% respectively in 2017, 2019, 2020, and 2021 could it be the beginning of some mean reversion out of the group (and healthcare) into financials and energy? We are all aware of just how powerful energy has been in the last couple of years and notice how in 2020-21 the market cap share (for financials and energy) undercut the previous two lows near the very round 20 number from 2000 and 2008. Was that a blowoff bottom for energy and financials, as the latter may benefit from rising interest rates too? Notice the dark blue line that began at 20% and rose to 36% took several years before it peaked. Perhaps this is values time to shine against growth that we have heard all too much about. If that is the case let's take a look at one name from each sector that we think has outperformed its peers and will continue to do so going forward.
Valaris Ltd:
- Oil equipment leader up 85% YTD and 84% over last one year period.
- Name 5% off most recent 52-week highs and nice relative strength last week up 10.5% nearly doubling WEEKLY gain of 5.6%. Round 60 number which was resistance in May-June on WEEKLY now looks like firm support.
- FOUR straight positive earnings reactions up 2.8, 5.5, .4 and .1% on 10/25, 7/27, 4/26, and 2/22.
- Enter with buy stop above double bottom pivot.
- Entry VAL 68.07. Stop 64.

Affiliated Managers Group:
- Investment manager down 5% YTD and 2% over last one year period.
- Name 8% off most recent 52-week highs and up 7 of last 10 weeks. Holding huge WEEKLY gain of 24.2% week ending 11/11 very well. Add to above WEEKLY cup with handle pivot of 163.46.
- Earnings mostly higher up 11.4, 2.5, 3.6% on 11/7, 8/1, and 5/2, and lower by .3% on 2/7.
- Enter on break back above bull flag.
- Entry AMG 161. Stop 153.

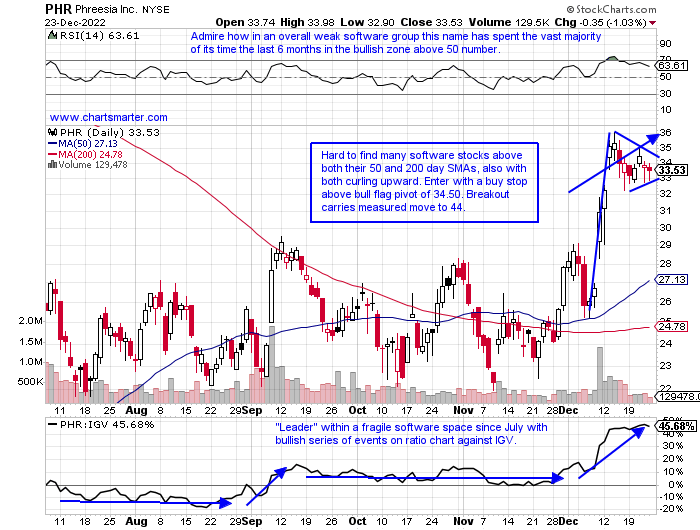
Value or Value Trap?
- Of course, software stocks are not considered your traditional value stocks. And there are a plethora of them after so many of them have come public over the years. In 2022 there has been some decent M&A activity with stocks such as COUP BNFT KNBE EVOP SGFY FORG and ONEM being taken over. Does this action mean companies are seeing value in software or is it a value trap? Many were much higher like a COUP that was near 400 in early 2021. ONEM was trading in the 60 neighborhood in early 2021 and was bought as a teenager. FORG which came public in September 2021 was close to 50 and will be bought for about half of that. Sure if one purchased recently they may be very happy. But if this is a sign that software is undervalued, not my opinion, perhaps we should be looking for leaders in the space. Never should one buy based on that assumption, rather PRICE action alone and below could be a good candidate with PHR. On 12/16 it filled in a gap from the 12/12 session and use a stop of 32 if entering with a CLOSE above the 34.50 bull flag pivot. On its MONTHLY chart, it looks similar to the stalling action near the round 30 number in 2020 before taking off. Deja vu?
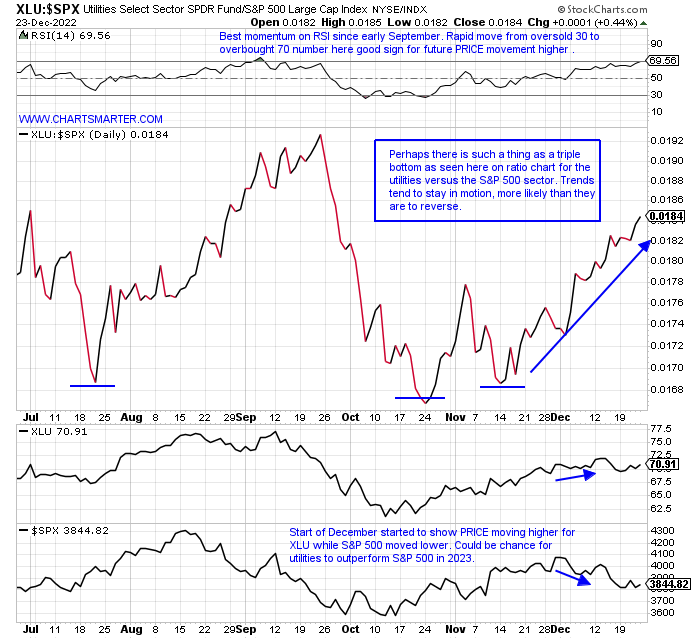
Utility Allure:
- A bit of an oxymoron with the headline above stating a "boring" mundane group in the same breath as a sexy word. But give credit where it is due as the XLU is the best major S&P sector performer over the last one month period, and second best over the last week and YTD. The group known for its hefty dividend yields has been seen in 2022 as in deep competition with rising rates, but this space can often be viewed as a sense of comfort in most market environments. This year with a few sessions left it is just 1 of 3 sector ETFs higher and sports a dividend yield close to 3%. Uncharacteristically it showed it was not immune to the overall market fragility with a deep 5-week losing streak with the weeks ending between 9/16-10/14 falling by a combined 21%. The ETF has shown nice action since a bullish piercing line candle on 10/13 (the rest of the market recorded a more attractive engulfing candle that day) at the round 60 number and it is above both its 50 and 200-day SMAs. The last 5 weeks have CLOSED taut within just .55 of each other and this group may show soome stability once again in 2023.
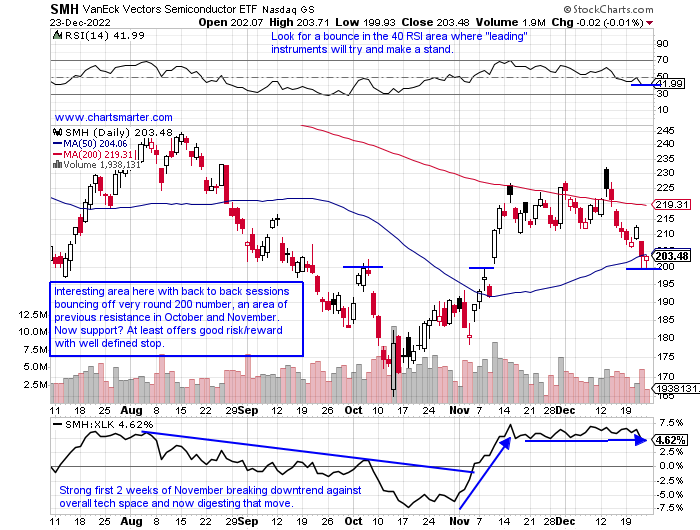
Semis Stepping Up in 2023?
- Any chance for technology to make a meaningful move higher next year must include the semiconductors. Their presence is felt in practically every device we use in our daily lives. The SMH is lower by 36% from its most recent 52-week highs and did attempt to CLOSE above its 200-day SMA in the last several weeks but the move gained no traction. The big black filled-in candlestick on 12/13 was a warning as it reversed from an almost 4-month high that traded into another nasty reversal candle from 8/26 that slumped almost 6%. The ETF is now on a 7 of 8 session losing streak, and overall many individual names have suffered and just a few are higher thus far in 2022 (RMBS and ACLS come to mind). Others like AMD and MRVL are lower by more than 50% in 2022. After the SMH's abrupt drop of 30 handles it may be ready to step up here at the very round 200 number. If so we have 2 names that may participate below in AMBA and MU.
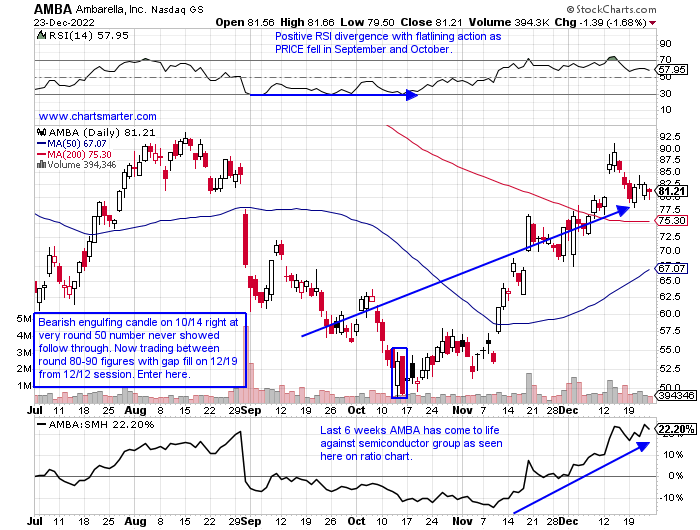
Ambarella:
- Semi play down 60% YTD and 59% over last one year period.
- Name 63% off most recent 52 week highs and "good" relative strength last week falling 1.7% as SMH slipped 4.7%. Prior week recorded bearish shooting star losing although rising 5.8% as SMH dropped 2.9%.
- Earnings mostly lower with 3 straght losses of 19.7, 2.1 and 31.3% on 8/31, 6/1 and 3/1, before recent gain of 3.3% on 12/2.
- Enter after recent gap fill/completion of island reversal (gap higher on 12/13 afte gap lower on 8/31).
- Entry AMBA here. Stop 75.
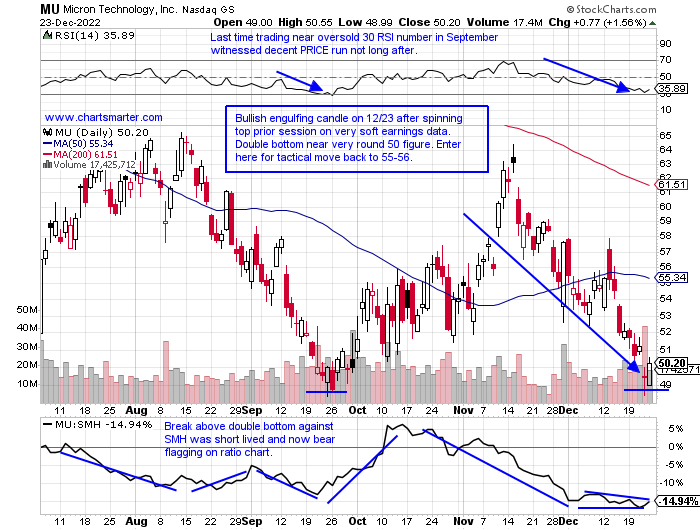
Micron Technology:
- "Old tech" semi play down 46% YTD and 47% over last one year period. Dividend yield of .9%.
- Name 49% off most recent 52 week highs and down 5 of last 6 weeks. Very round 50 number on WEEKLY CLOSING basis very important as weeks ending 9/23, 9/30 and last week were all below intraweek, but all CLOSED above figure.
- Earnings mostly lower off 3.4, 2.9 and 3.5% on 12/22, 7/1 and 3/30 and rose .2% on 9/30.
- Enter after recent spinning top/bullish engulfing candle/double bottom.
- Entry MU here. Stop 48.75.
Good luck.
This article requires a Chartsmarter membership. Please click here to join.
Is Tech Impotence Just Getting Started?
- Technology weakness was on full display in 2022. After annual gains of 39, 50, and 44, and 35% respectively in 2017, 2019, 2020, and 2021 could it be the beginning of some mean reversion out of the group (and healthcare) into financials and energy? We are all aware of just how powerful energy has been in the last couple of years and notice how in 2020-21 the market cap share (for financials and energy) undercut the previous two lows near the very round 20 number from 2000 and 2008. Was that a blowoff bottom for energy and financials, as the latter may benefit from rising interest rates too? Notice the dark blue line that began at 20% and rose to 36% took several years before it peaked. Perhaps this is values time to shine against growth that we have heard all too much about. If that is the case let's take a look at one name from each sector that we think has outperformed its peers and will continue to do so going forward.
Valaris Ltd:
- Oil equipment leader up 85% YTD and 84% over last one year period.
- Name 5% off most recent 52-week highs and nice relative strength last week up 10.5% nearly doubling WEEKLY gain of 5.6%. Round 60 number which was resistance in May-June on WEEKLY now looks like firm support.
- FOUR straight positive earnings reactions up 2.8, 5.5, .4 and .1% on 10/25, 7/27, 4/26, and 2/22.
- Enter with buy stop above double bottom pivot.
- Entry VAL 68.07. Stop 64.
Affiliated Managers Group:
- Investment manager down 5% YTD and 2% over last one year period.
- Name 8% off most recent 52-week highs and up 7 of last 10 weeks. Holding huge WEEKLY gain of 24.2% week ending 11/11 very well. Add to above WEEKLY cup with handle pivot of 163.46.
- Earnings mostly higher up 11.4, 2.5, 3.6% on 11/7, 8/1, and 5/2, and lower by .3% on 2/7.
- Enter on break back above bull flag.
- Entry AMG 161. Stop 153.
Value or Value Trap?
- Of course, software stocks are not considered your traditional value stocks. And there are a plethora of them after so many of them have come public over the years. In 2022 there has been some decent M&A activity with stocks such as COUP BNFT KNBE EVOP SGFY FORG and ONEM being taken over. Does this action mean companies are seeing value in software or is it a value trap? Many were much higher like a COUP that was near 400 in early 2021. ONEM was trading in the 60 neighborhood in early 2021 and was bought as a teenager. FORG which came public in September 2021 was close to 50 and will be bought for about half of that. Sure if one purchased recently they may be very happy. But if this is a sign that software is undervalued, not my opinion, perhaps we should be looking for leaders in the space. Never should one buy based on that assumption, rather PRICE action alone and below could be a good candidate with PHR. On 12/16 it filled in a gap from the 12/12 session and use a stop of 32 if entering with a CLOSE above the 34.50 bull flag pivot. On its MONTHLY chart, it looks similar to the stalling action near the round 30 number in 2020 before taking off. Deja vu?
Utility Allure:
- A bit of an oxymoron with the headline above stating a "boring" mundane group in the same breath as a sexy word. But give credit where it is due as the XLU is the best major S&P sector performer over the last one month period, and second best over the last week and YTD. The group known for its hefty dividend yields has been seen in 2022 as in deep competition with rising rates, but this space can often be viewed as a sense of comfort in most market environments. This year with a few sessions left it is just 1 of 3 sector ETFs higher and sports a dividend yield close to 3%. Uncharacteristically it showed it was not immune to the overall market fragility with a deep 5-week losing streak with the weeks ending between 9/16-10/14 falling by a combined 21%. The ETF has shown nice action since a bullish piercing line candle on 10/13 (the rest of the market recorded a more attractive engulfing candle that day) at the round 60 number and it is above both its 50 and 200-day SMAs. The last 5 weeks have CLOSED taut within just .55 of each other and this group may show soome stability once again in 2023.
Semis Stepping Up in 2023?
- Any chance for technology to make a meaningful move higher next year must include the semiconductors. Their presence is felt in practically every device we use in our daily lives. The SMH is lower by 36% from its most recent 52-week highs and did attempt to CLOSE above its 200-day SMA in the last several weeks but the move gained no traction. The big black filled-in candlestick on 12/13 was a warning as it reversed from an almost 4-month high that traded into another nasty reversal candle from 8/26 that slumped almost 6%. The ETF is now on a 7 of 8 session losing streak, and overall many individual names have suffered and just a few are higher thus far in 2022 (RMBS and ACLS come to mind). Others like AMD and MRVL are lower by more than 50% in 2022. After the SMH's abrupt drop of 30 handles it may be ready to step up here at the very round 200 number. If so we have 2 names that may participate below in AMBA and MU.
Ambarella:
- Semi play down 60% YTD and 59% over last one year period.
- Name 63% off most recent 52 week highs and "good" relative strength last week falling 1.7% as SMH slipped 4.7%. Prior week recorded bearish shooting star losing although rising 5.8% as SMH dropped 2.9%.
- Earnings mostly lower with 3 straght losses of 19.7, 2.1 and 31.3% on 8/31, 6/1 and 3/1, before recent gain of 3.3% on 12/2.
- Enter after recent gap fill/completion of island reversal (gap higher on 12/13 afte gap lower on 8/31).
- Entry AMBA here. Stop 75.
Micron Technology:
- "Old tech" semi play down 46% YTD and 47% over last one year period. Dividend yield of .9%.
- Name 49% off most recent 52 week highs and down 5 of last 6 weeks. Very round 50 number on WEEKLY CLOSING basis very important as weeks ending 9/23, 9/30 and last week were all below intraweek, but all CLOSED above figure.
- Earnings mostly lower off 3.4, 2.9 and 3.5% on 12/22, 7/1 and 3/30 and rose .2% on 9/30.
- Enter after recent spinning top/bullish engulfing candle/double bottom.
- Entry MU here. Stop 48.75.
Good luck.