"Everything has beauty, but not everyone sees it." Confucius
Beauty Is In The Eye Of The Beholder:
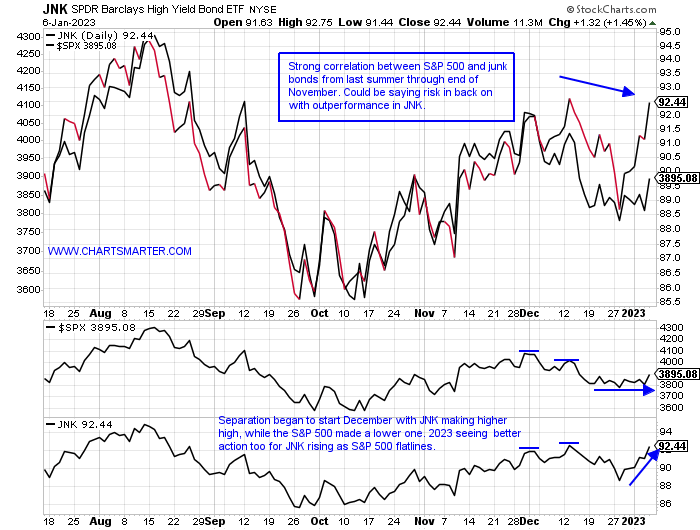
- One man's trash is another's treasure. Is junk back in vogue? The PRICE chart below shows how the JNK is leading the S&P 500 and it may be a good sign. It could be market participants are expressing they are willing to take on a bit more risk. Last week the ETF recaptured its 200-day SMA and has now advanced 5 of the last 6 sessions. The fund rose 2.7% last week nearly doubling the rise in the S&P 500 and over the last month's period the JNK has added 1.3%, while the S&P 500 has declined 1.2%. It is also now back above the WEEKLY CLOSE ending 10/28 that rose 3% in the second-best WEEKLY volume dating back to the COVID lows of early 2020. For investors that can stomach the risk, the JNK is paying a dividend yield of almost 6%. It is still way too early to tell if the downtrend is over and quite frankly we will not know until hindsight, but some little positives are beginning to add up.
Technology Coming Out Of Hibernation?
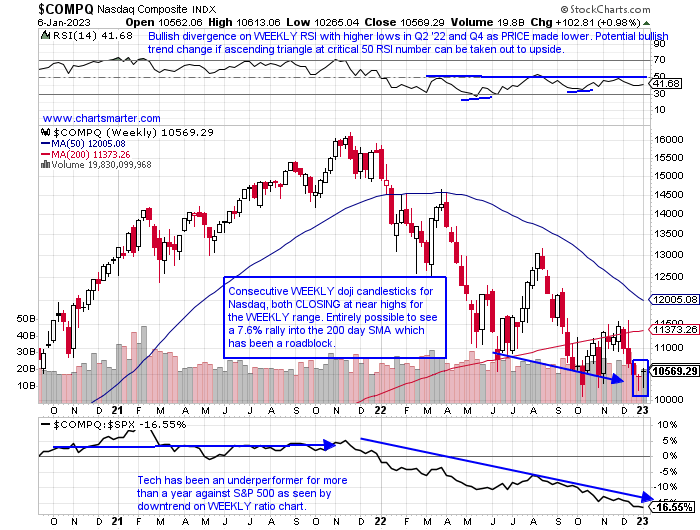
- To be clear this would be one of the longest hibernation periods on record, but have the bears overplayed their hands and gone to the honey jar a bit too often? Of course, no one knows but we have now seen back-to-back WEEKLY doji candles which are adept at signaling trend changes. And I say it all the time that trends are more likely to persist than the reverse, so PRICE still has to prove itself but with the JNK chart above some green shoots are making their presence felt. It may not feel like it but trade has also tightened up dramatically with the last 3 CLOSES on the WEEKLY chart within roughly 100 handles of each other. That has not even come close to happening since the top during the 3 weeks ending between 11/5-19/21, which managed to CLOSE within 200 points of each other, at the very round 16000 number. Could this be a tradeable bottom as PRICE stabilizes? Semis will have to play a role, and they have so far held the very round 200 number with the SMH that we spoke of in our last WEEK AHEAD NOTE. MU jumped almost 14% last week.
Bountiful Bond Bounce:
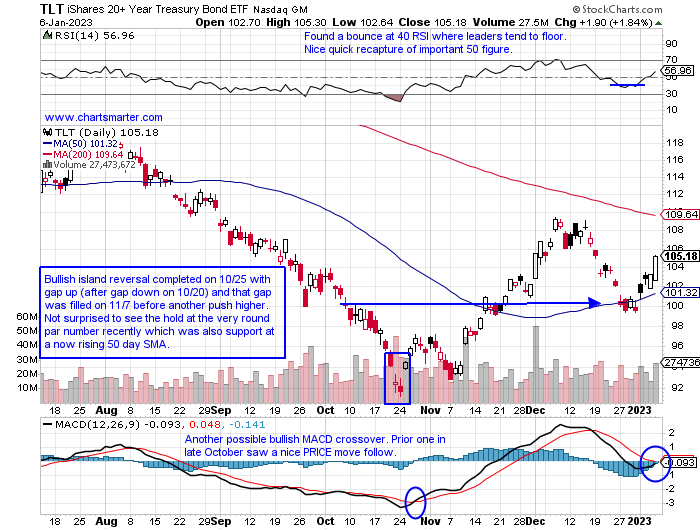
- Last week witnessed a power surge with the TLT advancing every day up 5.6%. That was a rare gain as reported by Steve Deppe on Twitter and should not be used for investment advice. For me, this is just a testament to how technical analysis can help in identifying possible bottoms. The bullish island reversal that was recorded on 10/25, after the huge reversal candles for the major stock indexes on 10/13, was interesting as the bond market tends to lead and on that 10/13 session, the TLT essentially yawned. One should take note that this move occurred with the unemployment rate falling to 3.5%, so those that were in the "Fed pivot" camp may have to rethink their thesis. The more closely watched 10-year yield via the TNX fell 8% last week and its troubles began with a bearish RSI divergence last September and October, and a bearish counterattack candle on 10/21 near 4.3%. This instrument has room to the downside to the 200-day SMA which it has not come into contact with in one year.
Dr. Whoever:
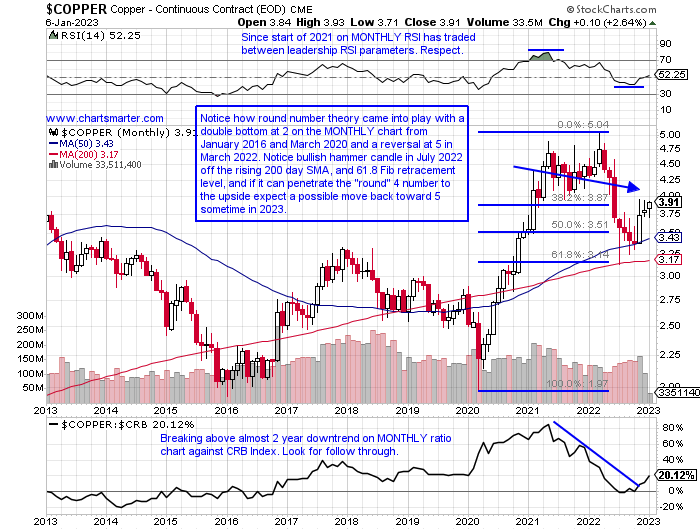
- I am tired of hearing that copper has a Ph.D. in economics. My concern is just how PRICE action is behaving, and the MONTHLY chart below of copper could be ready for a spirited run higher. It recorded a very firm move starting in April 2020 with a 12 of 14 month winning streak (and that is with September 2020 losing just 3 pennies) and ended up giving more than half of that back before finding its footing. As many know I am a fan of round number theory and if the metal can climb above 4 it could be on a path to 5 sometime in 2023. Could this be signaling the economists all on one side of the boat with almost unanimous recession forecasts are incorrect? FCX broke above a cup with handle pivot of 41.26 Friday in a 7-month base, and look for a move back toward the very round 50 number where it reversed near in early 2022. SCCO rose almost 12%, and peer BHP sports a dividend yield of almost 10%, and perhaps this trifecta is trying to convey an anti-recessionary message.
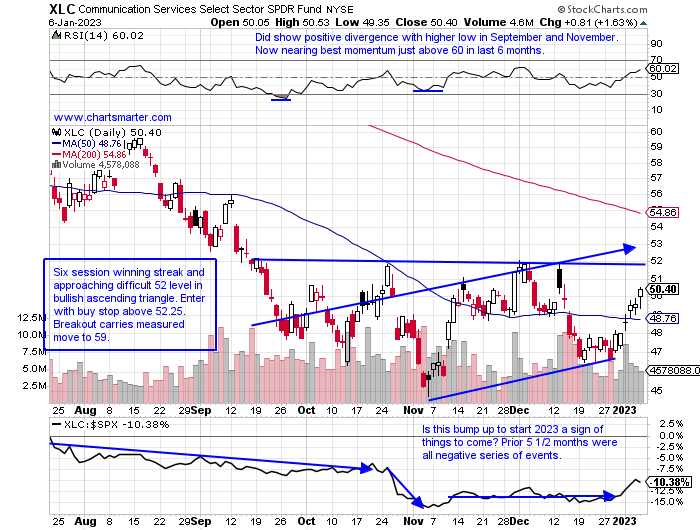
Communication Issues:
- Last year the communication services, via the XLC, were the worst-performing of the 11 major S&P sectors down nearly 40%. Can 2023 go from worst to first? Of course, we are just 4 sessions into the new year but last week the ETF was the best actor up better than 5%. Below is the daily chart and it's in no man's land until it can pierce the 52 area, but there are lots of moving parts within the diverse sector. GOOGL and META are the major focus with the latter looking somewhat promising as it is not slowing down after an upside gap fill from the 10/26 session, the day before its latest earnings reaction which slashed one-quarter of its value. NFLX has nearly doubled since the lows of a bullish hammer WEEKLY candle ending 5/13, and it too has now filled in an upside gap fill just above the very round 300 number. PINS has recorded 3 consecutive taut WEEKLY CLOSES all within just .25 of each other and the last 2 at the top of the WEEKLY range. Below we take a look at two attractive names in the space FWONA and TME.
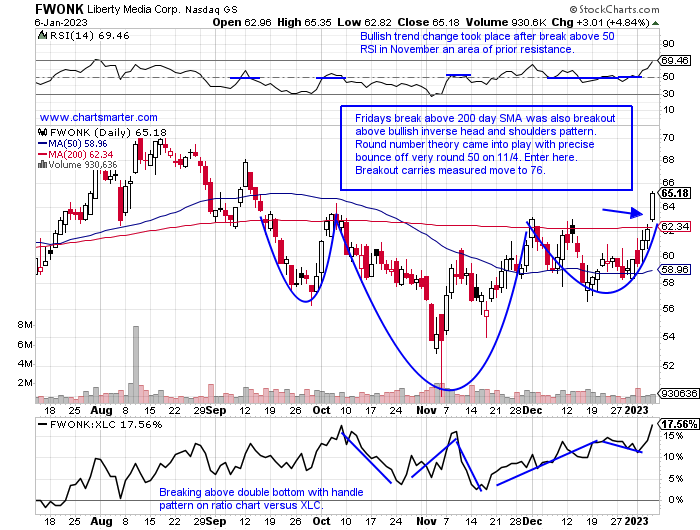
Liberty Media Corp:
- Broadcasting play up 7% YTD and down 2% over the last one year period.
- Name just 8% off most recent 52-week highs and up 9% this week almost doubling 5% move in XLC. Nearing add-on buy point above the WEEKLY double bottom pivot of 70.61. Very popular Formula 1 sport in its stable.
- Earnings mostly lower off .9, 5.8 and .1% on 11/4, 8/5, and 2/25, and rose 1% on 5/6.
- Enter after breakout above inverse head and shoulders breakout.
- Entry FWONK here. Stop 61.
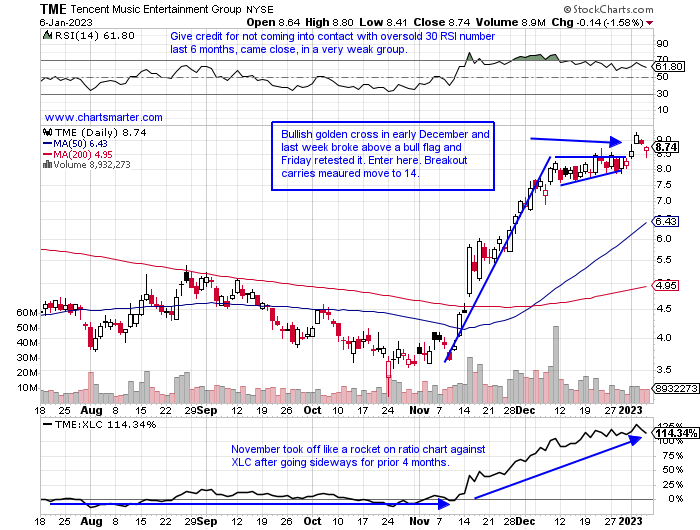
Tencent Music Entertainment:
- Chinese entertainment play up 6% YTD and 33% over last one year period.
- Name 6% off most recent 52-week highs and up 9 of last 10 weeks and has gained almost 200% from top to bottom of range since late October lows, which was also a double bottom from huge WEEKLY gain of 47% the week ending 3/18.
- Earnings mostly higher up 30.6, 2.6, and 9.7% on 11/15, 8/16, and 3/22, and fell 1.4% on 5/17.
- Enter after bull flag breakout.
- Entry TME here. Stop 7.50.
Good luck.
This article requires a Chartsmarter membership. Please click here to join.
"Everything has beauty, but not everyone sees it." Confucius
Beauty Is In The Eye Of The Beholder:
- One man's trash is another's treasure. Is junk back in vogue? The PRICE chart below shows how the JNK is leading the S&P 500 and it may be a good sign. It could be market participants are expressing they are willing to take on a bit more risk. Last week the ETF recaptured its 200-day SMA and has now advanced 5 of the last 6 sessions. The fund rose 2.7% last week nearly doubling the rise in the S&P 500 and over the last month's period the JNK has added 1.3%, while the S&P 500 has declined 1.2%. It is also now back above the WEEKLY CLOSE ending 10/28 that rose 3% in the second-best WEEKLY volume dating back to the COVID lows of early 2020. For investors that can stomach the risk, the JNK is paying a dividend yield of almost 6%. It is still way too early to tell if the downtrend is over and quite frankly we will not know until hindsight, but some little positives are beginning to add up.
Technology Coming Out Of Hibernation?
- To be clear this would be one of the longest hibernation periods on record, but have the bears overplayed their hands and gone to the honey jar a bit too often? Of course, no one knows but we have now seen back-to-back WEEKLY doji candles which are adept at signaling trend changes. And I say it all the time that trends are more likely to persist than the reverse, so PRICE still has to prove itself but with the JNK chart above some green shoots are making their presence felt. It may not feel like it but trade has also tightened up dramatically with the last 3 CLOSES on the WEEKLY chart within roughly 100 handles of each other. That has not even come close to happening since the top during the 3 weeks ending between 11/5-19/21, which managed to CLOSE within 200 points of each other, at the very round 16000 number. Could this be a tradeable bottom as PRICE stabilizes? Semis will have to play a role, and they have so far held the very round 200 number with the SMH that we spoke of in our last WEEK AHEAD NOTE. MU jumped almost 14% last week.
Bountiful Bond Bounce:
- Last week witnessed a power surge with the TLT advancing every day up 5.6%. That was a rare gain as reported by Steve Deppe on Twitter and should not be used for investment advice. For me, this is just a testament to how technical analysis can help in identifying possible bottoms. The bullish island reversal that was recorded on 10/25, after the huge reversal candles for the major stock indexes on 10/13, was interesting as the bond market tends to lead and on that 10/13 session, the TLT essentially yawned. One should take note that this move occurred with the unemployment rate falling to 3.5%, so those that were in the "Fed pivot" camp may have to rethink their thesis. The more closely watched 10-year yield via the TNX fell 8% last week and its troubles began with a bearish RSI divergence last September and October, and a bearish counterattack candle on 10/21 near 4.3%. This instrument has room to the downside to the 200-day SMA which it has not come into contact with in one year.
Dr. Whoever:
- I am tired of hearing that copper has a Ph.D. in economics. My concern is just how PRICE action is behaving, and the MONTHLY chart below of copper could be ready for a spirited run higher. It recorded a very firm move starting in April 2020 with a 12 of 14 month winning streak (and that is with September 2020 losing just 3 pennies) and ended up giving more than half of that back before finding its footing. As many know I am a fan of round number theory and if the metal can climb above 4 it could be on a path to 5 sometime in 2023. Could this be signaling the economists all on one side of the boat with almost unanimous recession forecasts are incorrect? FCX broke above a cup with handle pivot of 41.26 Friday in a 7-month base, and look for a move back toward the very round 50 number where it reversed near in early 2022. SCCO rose almost 12%, and peer BHP sports a dividend yield of almost 10%, and perhaps this trifecta is trying to convey an anti-recessionary message.
Communication Issues:
- Last year the communication services, via the XLC, were the worst-performing of the 11 major S&P sectors down nearly 40%. Can 2023 go from worst to first? Of course, we are just 4 sessions into the new year but last week the ETF was the best actor up better than 5%. Below is the daily chart and it's in no man's land until it can pierce the 52 area, but there are lots of moving parts within the diverse sector. GOOGL and META are the major focus with the latter looking somewhat promising as it is not slowing down after an upside gap fill from the 10/26 session, the day before its latest earnings reaction which slashed one-quarter of its value. NFLX has nearly doubled since the lows of a bullish hammer WEEKLY candle ending 5/13, and it too has now filled in an upside gap fill just above the very round 300 number. PINS has recorded 3 consecutive taut WEEKLY CLOSES all within just .25 of each other and the last 2 at the top of the WEEKLY range. Below we take a look at two attractive names in the space FWONA and TME.
Liberty Media Corp:
- Broadcasting play up 7% YTD and down 2% over the last one year period.
- Name just 8% off most recent 52-week highs and up 9% this week almost doubling 5% move in XLC. Nearing add-on buy point above the WEEKLY double bottom pivot of 70.61. Very popular Formula 1 sport in its stable.
- Earnings mostly lower off .9, 5.8 and .1% on 11/4, 8/5, and 2/25, and rose 1% on 5/6.
- Enter after breakout above inverse head and shoulders breakout.
- Entry FWONK here. Stop 61.
Tencent Music Entertainment:
- Chinese entertainment play up 6% YTD and 33% over last one year period.
- Name 6% off most recent 52-week highs and up 9 of last 10 weeks and has gained almost 200% from top to bottom of range since late October lows, which was also a double bottom from huge WEEKLY gain of 47% the week ending 3/18.
- Earnings mostly higher up 30.6, 2.6, and 9.7% on 11/15, 8/16, and 3/22, and fell 1.4% on 5/17.
- Enter after bull flag breakout.
- Entry TME here. Stop 7.50.
Good luck.