"Just when you thought it was over, it was really only just beginning," -Unknown
Technology Renaissance:
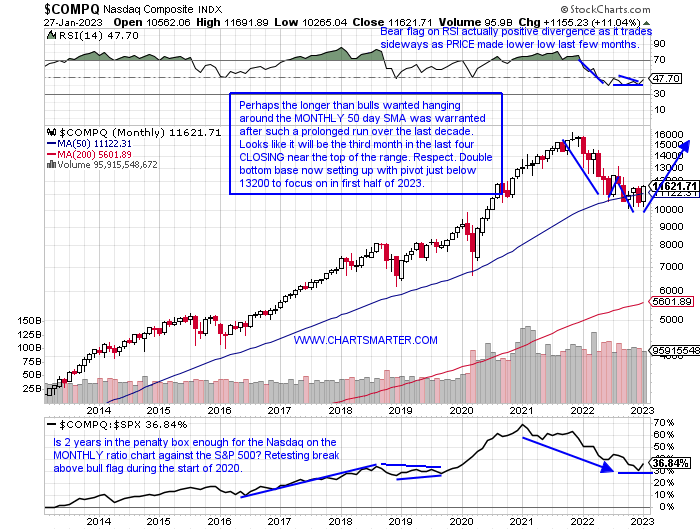
- Bulls have been conditioned over the last year that each time they think the bear is over it swiftly reared its ugly head again. Can the scarcity of true market believers this time around, lathered in recency bias, actually be a good thing? The MONTHLY chart of the Nasdaq below is turning from a negative to a positive (of course there is one more session this coming Monday). I was a skeptic as I felt it was lingering too long riding its 50-day SMA, with now 8 months in close contact with the line, unlike the springboard it served as 3 times since early 2016. Last Friday on its daily chart it CLOSED above its 200-day SMA for the first time in over a year, and next week will be a true test for this nascent turnaround when AAPL REPORTS Thursday after the CLOSE (AMD META and GOOG also release numbers next week). The largest company on Earth, and the only $2T market cap has CLOSED at the top of the WEEKLY range the last FIVE weeks. And although volume was somewhat tepid, which is normal in an incipient rally as cynics abound, the volume will come later as bears are forcefully converted into bulls.
Seasonality Factors:
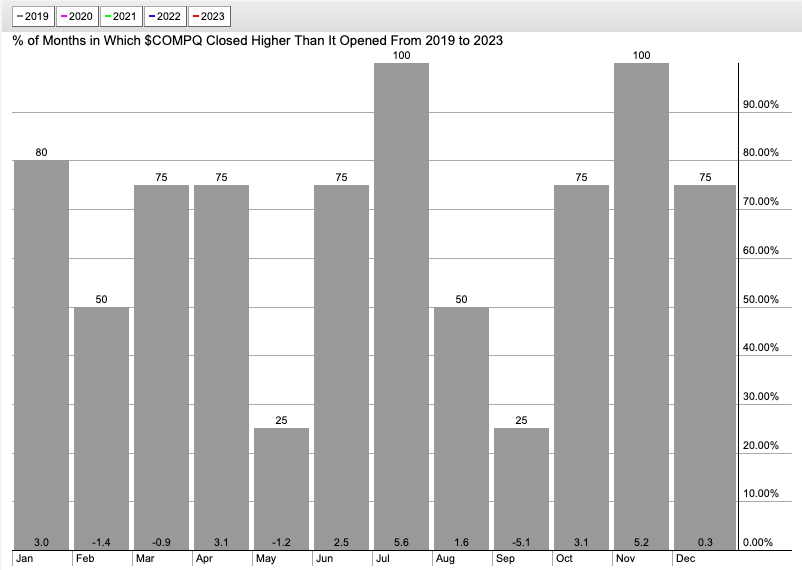
- The Nasdaq is higher by 10% with just Monday left and this makes it one of the best MONTHLY gains in years. Over the last few years, there have been few precedents for this but the Nasdaq rose 11.9% in January 2019 and 19.2% in April 2020, and led to respective MONTHLY win streaks of three and four. The most recent example was in July of 2022 which jumped 12.6% but witnessed no follow-through. Perhaps some more digestion would be the best scenario and the seasonality chart below shows that in modern years February and March on average are lower by 1.4 and .9%, and this would be welcomed by the bulls to let the tech-heavy benchmark catch its breath after its fresh vault higher. That would be a great start and a welcome response after the repeated failures. Other unrelated takeaways from this seasonality chart show huge average advances of more than 5% in the supposedly "summer doldrum" month of July, and November as the "Santa Rally" seems to come earlier and earlier every year with December flat.
Sleeping Giant Or Tired Has-Been?
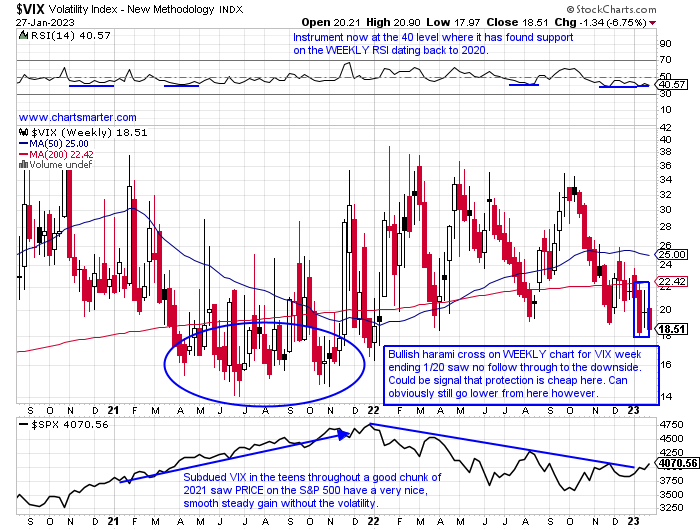
- The VIX has now been chopped in half, not a typo, from the peak made at the end of Q3 '22. Since the week ending 10/21 it has declined 11 of the last 15 weeks and has not recorded back to back WEEKLY gains since a 3 week win streak that ended with a doji candle the week ending 10/14. That candle correctly predicted the VIX was fatigued and a downtrend that is still ongoing was ready to occur. Two weeks ago it registered another doji candle, which was a bullish harami cross, and is this going to be accurate once again in predicting a very possible change in the prevailing trend, and start a new climb upward? Anything is possible, but if that is so it will most likely be short lived. The first week of December broke a long string of higher WEEKLY lows dating back to the summer of 2021. A more plausible direction would be a move into the mid teens where the VIX resided in for most of 2021 and produced a very calm, and stabile upward trajectory for the S&P 500 as seen at the bottom of the VIX chart below. Not many are forecasting an energetic advance for the major averages, and we know the benchmarks do there best to confound the most.
Social Media Frenzy:
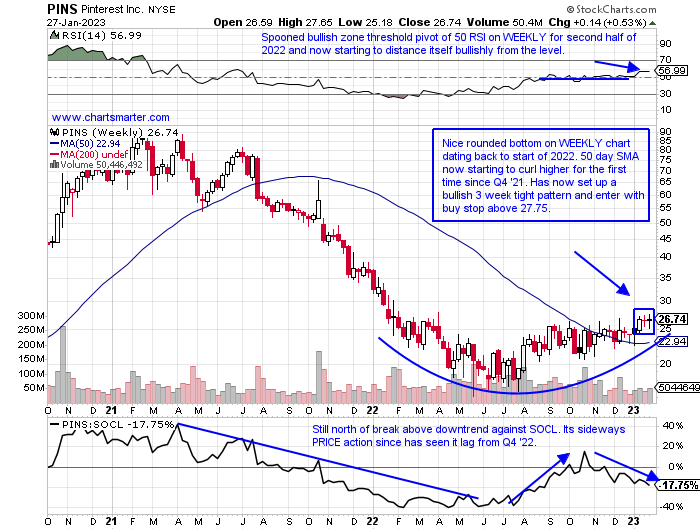
- The rage not too long ago was on the TWTR takeout by Elon Musk, but the group has put on quite the show recently. The SOCL which hit a high near the round 80 number almost 2 years ago subsequently underwent a nasty retreat and during a period between the weeks ending 7/9/21-10/28/22 advanced on a WEEKLY basis just 23 times (and remember 2021 was a bullish year overall for markets). The ETF has gained now 10 of the last 13 weeks and rose well more than 50% during the process. Of course, the number two holding in META has been on fire since the completion of a WEEKLY bullish morning star pattern the week ending 11/11 that jumped 25%. The stock has almost doubled from its Q4 lows but is still 54% off its annual peak. SPOT is now retesting a WEEKLY bull flag breakdown at the very round par number with the flag pole starting at the 300 figure in late 2021. Below is the chart I am watching the most as has lost some of its luster, but has formed a bullish 3-week tight pattern as the last 3 weeks all CLOSED within just .14 of each other. It REPORTS on 2/6 after the close and has recorded FIVE straight positive earnings reactions.
Consumer Delight:
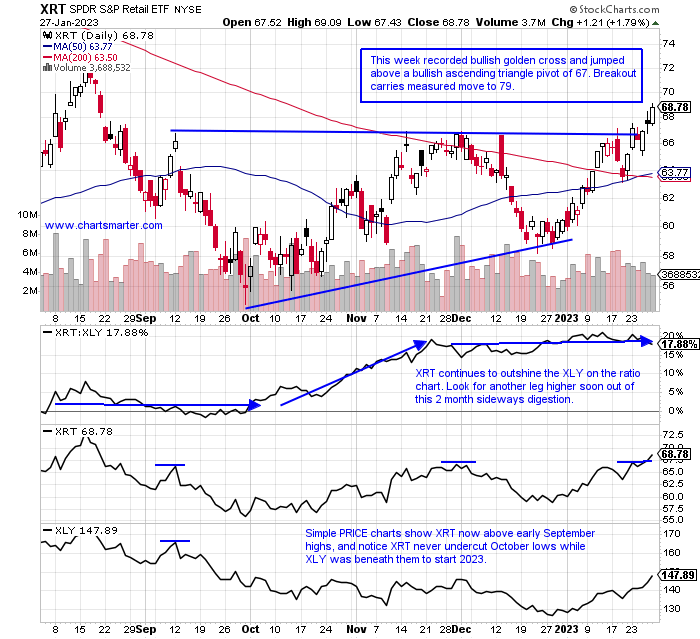
- The consumer discretionary space has been on fire in 2023 with the XLY up 14%. Perhaps this is just a dead cat bounce as in 2022 it fell nearly 40% making it just the 10th best of 11 major S&P sector groups. As nicely as the XLY has performed the chart below of the XRT to me is the better vehicle. It is now above a bullish ascending triangle and trades 18% off its most recent 52-week highs compared to the XLY down 23% from its own annual peak. Keep in mind the XRT carries a much better dividend yield of 3.3%, whereas the XLY pays .9%. And the outperformance has occurred on the back of the huge move from TSLA up 80% from top to bottom of the range so far in 2023. TSLA jumped 33% this week, and the largest holding in AMZN rose a pedestrian 5%. With the recent slump into the end of 2022, Tesla nearly became just the third largest component in the fund as HD is catching up very quickly in its weighting.
Best Buy:
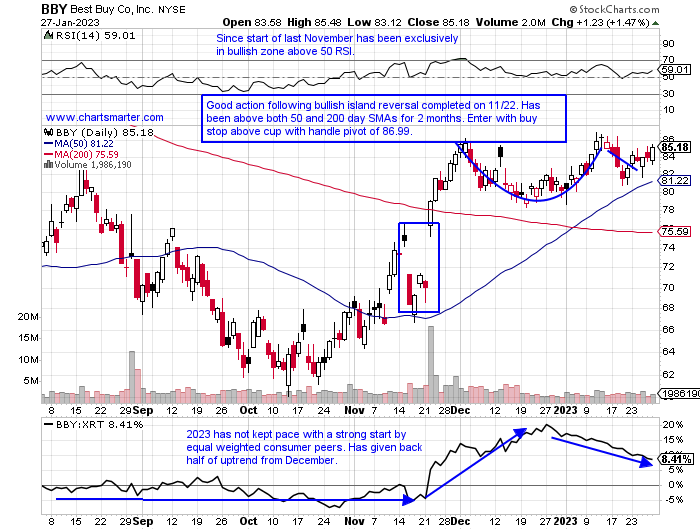
- Retailer up 6% YTD and down 11% over last one year period. Dividend yield of 4.1%.
- Name 25% off most recent 52-week highs and still acting well following combined gain of 20% the 2 weeks ending 11/25-12/2. Same pivot on daily has look of bull flag and breakout carries a measured move to 114.
- FOUR straight positive earnings reactions up 12.8, 1.6, 1.2, and 9.2% on 11/22, 8/30, 5/24, and 3/3.
- Enter with buy stop above cup with handle pivot.
- Entry BBY 86.99. Stop 82.
Tempur Pedic:
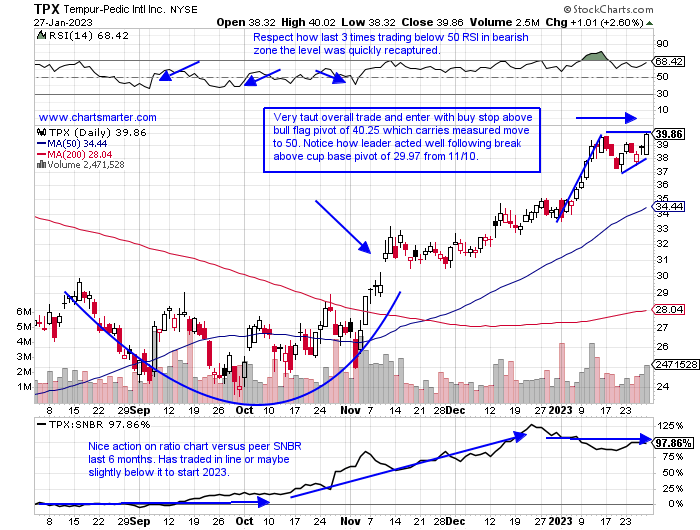
- Retail name up 16% YTD and 8% over last one year period. Dividend yield of .4%.
- Name % off most recent 52-week highs and up a very impressive 12 of the last 15 weeks. Nice accumulation with above average WEEKLY volume the weeks ending 11/4, 11/11 and 1/13 that rose 6, 12.5 and 11%.
- Three straight positive gains of 7.7, 4.2 and 5.9% on 11/3, 7/27 and 4/28 and fell 19.4% on 2/22.
- Enter with buy stop above bull flag.
- Entry TPX 40.25. Stop 37.50.
Good luck.
This article requires a Chartsmarter membership. Please click here to join.
"Just when you thought it was over, it was really only just beginning," -Unknown
Technology Renaissance:
- Bulls have been conditioned over the last year that each time they think the bear is over it swiftly reared its ugly head again. Can the scarcity of true market believers this time around, lathered in recency bias, actually be a good thing? The MONTHLY chart of the Nasdaq below is turning from a negative to a positive (of course there is one more session this coming Monday). I was a skeptic as I felt it was lingering too long riding its 50-day SMA, with now 8 months in close contact with the line, unlike the springboard it served as 3 times since early 2016. Last Friday on its daily chart it CLOSED above its 200-day SMA for the first time in over a year, and next week will be a true test for this nascent turnaround when AAPL REPORTS Thursday after the CLOSE (AMD META and GOOG also release numbers next week). The largest company on Earth, and the only $2T market cap has CLOSED at the top of the WEEKLY range the last FIVE weeks. And although volume was somewhat tepid, which is normal in an incipient rally as cynics abound, the volume will come later as bears are forcefully converted into bulls.
Seasonality Factors:
- The Nasdaq is higher by 10% with just Monday left and this makes it one of the best MONTHLY gains in years. Over the last few years, there have been few precedents for this but the Nasdaq rose 11.9% in January 2019 and 19.2% in April 2020, and led to respective MONTHLY win streaks of three and four. The most recent example was in July of 2022 which jumped 12.6% but witnessed no follow-through. Perhaps some more digestion would be the best scenario and the seasonality chart below shows that in modern years February and March on average are lower by 1.4 and .9%, and this would be welcomed by the bulls to let the tech-heavy benchmark catch its breath after its fresh vault higher. That would be a great start and a welcome response after the repeated failures. Other unrelated takeaways from this seasonality chart show huge average advances of more than 5% in the supposedly "summer doldrum" month of July, and November as the "Santa Rally" seems to come earlier and earlier every year with December flat.
Sleeping Giant Or Tired Has-Been?
- The VIX has now been chopped in half, not a typo, from the peak made at the end of Q3 '22. Since the week ending 10/21 it has declined 11 of the last 15 weeks and has not recorded back to back WEEKLY gains since a 3 week win streak that ended with a doji candle the week ending 10/14. That candle correctly predicted the VIX was fatigued and a downtrend that is still ongoing was ready to occur. Two weeks ago it registered another doji candle, which was a bullish harami cross, and is this going to be accurate once again in predicting a very possible change in the prevailing trend, and start a new climb upward? Anything is possible, but if that is so it will most likely be short lived. The first week of December broke a long string of higher WEEKLY lows dating back to the summer of 2021. A more plausible direction would be a move into the mid teens where the VIX resided in for most of 2021 and produced a very calm, and stabile upward trajectory for the S&P 500 as seen at the bottom of the VIX chart below. Not many are forecasting an energetic advance for the major averages, and we know the benchmarks do there best to confound the most.
Social Media Frenzy:
- The rage not too long ago was on the TWTR takeout by Elon Musk, but the group has put on quite the show recently. The SOCL which hit a high near the round 80 number almost 2 years ago subsequently underwent a nasty retreat and during a period between the weeks ending 7/9/21-10/28/22 advanced on a WEEKLY basis just 23 times (and remember 2021 was a bullish year overall for markets). The ETF has gained now 10 of the last 13 weeks and rose well more than 50% during the process. Of course, the number two holding in META has been on fire since the completion of a WEEKLY bullish morning star pattern the week ending 11/11 that jumped 25%. The stock has almost doubled from its Q4 lows but is still 54% off its annual peak. SPOT is now retesting a WEEKLY bull flag breakdown at the very round par number with the flag pole starting at the 300 figure in late 2021. Below is the chart I am watching the most as has lost some of its luster, but has formed a bullish 3-week tight pattern as the last 3 weeks all CLOSED within just .14 of each other. It REPORTS on 2/6 after the close and has recorded FIVE straight positive earnings reactions.
Consumer Delight:
- The consumer discretionary space has been on fire in 2023 with the XLY up 14%. Perhaps this is just a dead cat bounce as in 2022 it fell nearly 40% making it just the 10th best of 11 major S&P sector groups. As nicely as the XLY has performed the chart below of the XRT to me is the better vehicle. It is now above a bullish ascending triangle and trades 18% off its most recent 52-week highs compared to the XLY down 23% from its own annual peak. Keep in mind the XRT carries a much better dividend yield of 3.3%, whereas the XLY pays .9%. And the outperformance has occurred on the back of the huge move from TSLA up 80% from top to bottom of the range so far in 2023. TSLA jumped 33% this week, and the largest holding in AMZN rose a pedestrian 5%. With the recent slump into the end of 2022, Tesla nearly became just the third largest component in the fund as HD is catching up very quickly in its weighting.
Best Buy:
- Retailer up 6% YTD and down 11% over last one year period. Dividend yield of 4.1%.
- Name 25% off most recent 52-week highs and still acting well following combined gain of 20% the 2 weeks ending 11/25-12/2. Same pivot on daily has look of bull flag and breakout carries a measured move to 114.
- FOUR straight positive earnings reactions up 12.8, 1.6, 1.2, and 9.2% on 11/22, 8/30, 5/24, and 3/3.
- Enter with buy stop above cup with handle pivot.
- Entry BBY 86.99. Stop 82.
Tempur Pedic:
- Retail name up 16% YTD and 8% over last one year period. Dividend yield of .4%.
- Name % off most recent 52-week highs and up a very impressive 12 of the last 15 weeks. Nice accumulation with above average WEEKLY volume the weeks ending 11/4, 11/11 and 1/13 that rose 6, 12.5 and 11%.
- Three straight positive gains of 7.7, 4.2 and 5.9% on 11/3, 7/27 and 4/28 and fell 19.4% on 2/22.
- Enter with buy stop above bull flag.
- Entry TPX 40.25. Stop 37.50.
Good luck.