"These expressions of emotion have within them the seeds of destruction." Victor Neiderhoffer
Silver Lining:
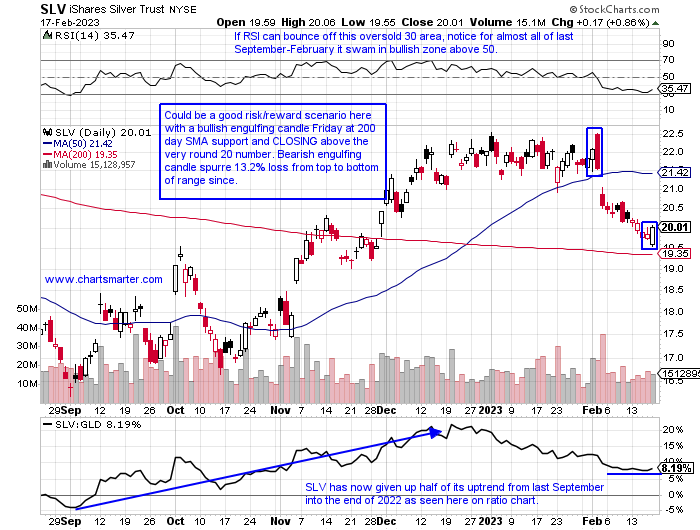
- Can the PRICE of silver be a good sign for the stock market? Although it is thought of as a precious metal, more than half of its use comes from "industrial purposes" which shows a possible positive development for the global economy (silver will be found in semiconductors of all things which I did not realize). Gold which is seen as more of a store of value, has been acting a bit better than silver with the GLD off by 3% YTD and the SLV is down by 9% in 2023 so far. Looking at the chart below of the SLV shows some distribution as it is on a current 5 week losing streak with the week ending 2/3 off more than 5%. It has been under pressure as the greenback tries to steady itself above the very round par number. But the dollar recorded a shooting star candle after a doji candle Thursday after a $4 jump in February so silver may not be facing as stiff a headwind going forward. Like the GLD, the SLV recorded a bullish engulfing candle Friday and perhaps that may be equities in a glittery light, pun intended.
Crystal Clear Set Up:
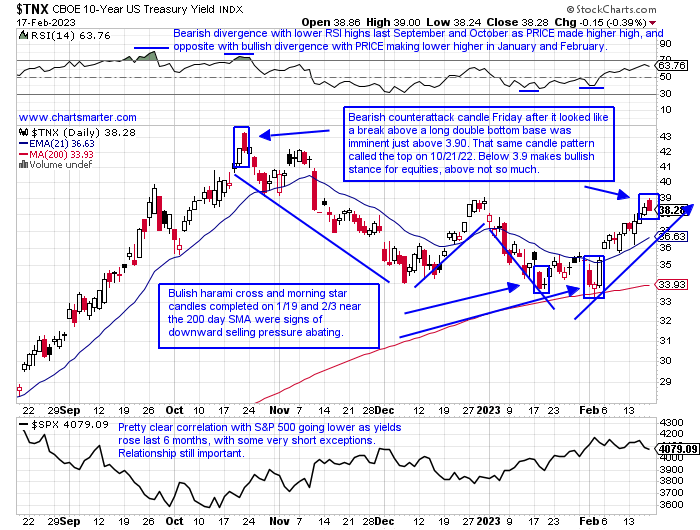
- With an abundance of eyes on the 10-year, the daily chart below of the instrument demonstrates why. Friday provided a stalemate between bulls and bears. Just as it seemed a breakout above the long double bottom base near 3.9% PRICE backed off. If this can not climb above 3.9 next week I think that could really signal a regime change for the bulls to solidify their sanguine stance. Remember there is nothing more bearish that a bullish setup that fails. If one were to look at the WEEKLY chart this still looks like there is room to the upside. It is on a 4-week winning streak, and quite frankly it looks like a healthy pause following the 12-week win streak between last August and October (and is comfortably back above its 21-day EMA which it rode higher between last August-November). But the bulls have a chance here if last week proves to be a fourth lower high since a bearish counterattack candle late last October. That same candle was recorded last Friday. Something for the equity bears to ponder over the long weekend.
Winds Of Change:
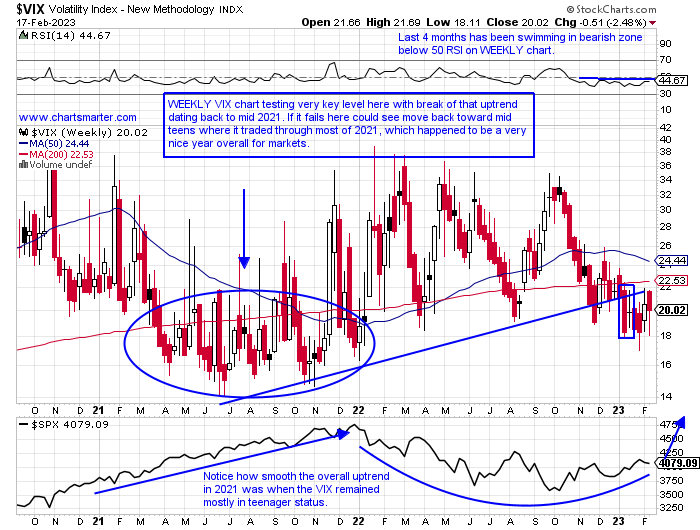
- For the last 3 months, the WEEKLY VIX chart has resided below the 200 WEEKLY SMA. To show just how soft it has been since the start of Q4 '22 it has not recorded back-to-back positive weeks and has gained ground just 6 times. It is now 47% off most recent 52-week highs and last week CLOSED just above the very round 20 number. On the chart below one can see that it is testing a break of a long uptrend that began in June 2021. If it fails here where I think it is likely we could return to the mid-teen territory when the VIX resided throughout most of 2021 which was a very favorable environment for markets. On its daily chart, it is making the bearish habit of CLOSING at lows for the daily range 5 of the last 6 sessions with the exception of Thursday which advanced more than 10%. The VIX bulls have one notch in their belt with 2 of the last 3 WEEKLY gains being bullish harami cross candles, but neither has garnered any follow-through.
Mister Softee Must Firm:
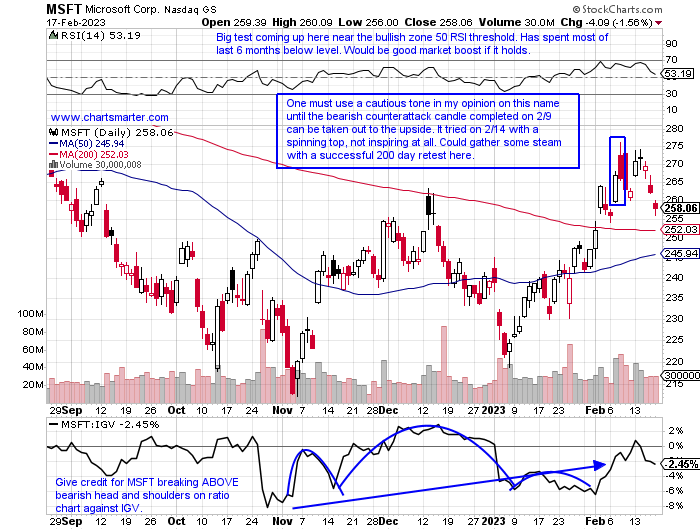
- Scouring over the 13F reports this week it brought back to mind the quote, "the more things change the more they stay the same". I was not too surprised that many funds are still pinning their hopes on the mega-cap tech names with top holdings in AMZN GOOGL META and the chart below of MSFT (the lack of creativity in searching for new potential leadership baffles me). Microsoft which late this week dropped to the third largest market cap company (behind Aramco) on the planet, no doubt still carries clout, but for it to be taken seriously in my opinion it must negate the bearish counterattack candle from 2/9. A rest here along possible 200-day SMA support, a line that rejected the stock's advance last August and December must hold. Bulls do not want this to look like the brief period where it jumped above that secular line for a short time last March before falling back below it again in April. Give it credit for breaking above the downtrend of lower highs since November '21, but this 250 area is a big line in the sand.
David Versus Goliath:
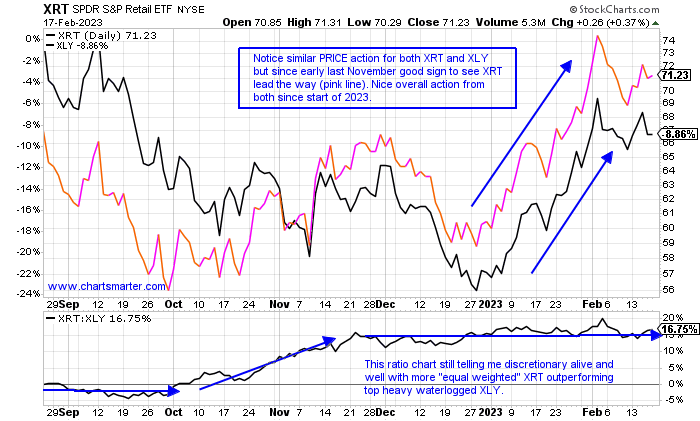
- Even with the nascent, welcomed rebound in technology in 2023, the creme of the crop if one is judging that by the major S&P sector leaderboard is still consumer discretionary. On a YTD basis, the XLY has risen more than 16%, the best of 11, and topping communication services and technology up 15 and 12% respectively to round out the top 3. But if we look under the surface just a bit more we will see the "smaller cap" more equal-weighted XRT outshining the XLY higher by 18% this year so far (it carries a better dividend yield above 3% as well). And this performance takes into consideration TSLA (15% of the XLY) doubling since the 1/6 bullish engulfing candle right at the very round par number. The XRT rose 3.4% last week, twice as much as the XLY gain, and it is "just" 13% from its most recent 52-week highs compared to the XLY 22% off its own annual peak. The ratio chart at the bottom of the chart below shows this strength for the XRT over the XLY is nothing new. But remember this does not mean both can not perform well on an absolute basis, it is just stating on a relative basis one may want to overweight the XRT. Let's take a look at 2 individual names in the space.
JD.com
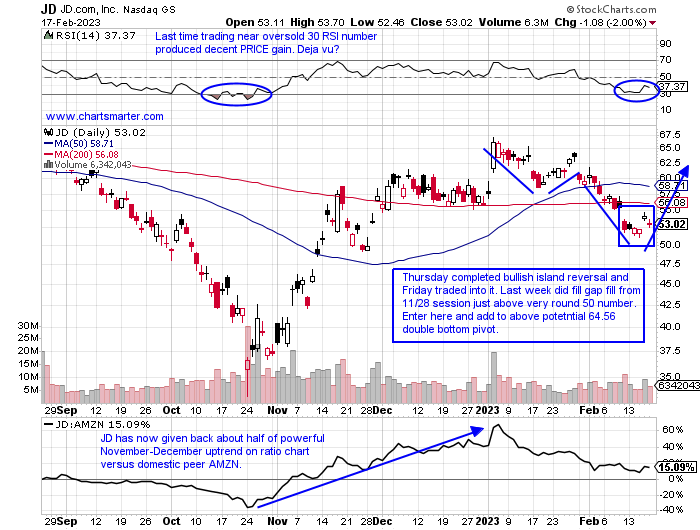
- Chinese internet retail play down 6% YTD and 29% over last one year period.
- Name 29% off most recent 52-week highs and decent relative strength last week up 1.4% as the KWEB declined by the nearly same amount. To be fair JD dropped 9% the prior 2 weeks while KWEB fell by a combined 12%.
- Earnings reactions mixed up 3.4 and 4.1% on 8/23 and 5/17/22 and fell 2.5 and 15.8% on 11/18 and 3/10/22.
- Enter after bullish island reversal/gap fill.
- Entry JD here. Stop 49.
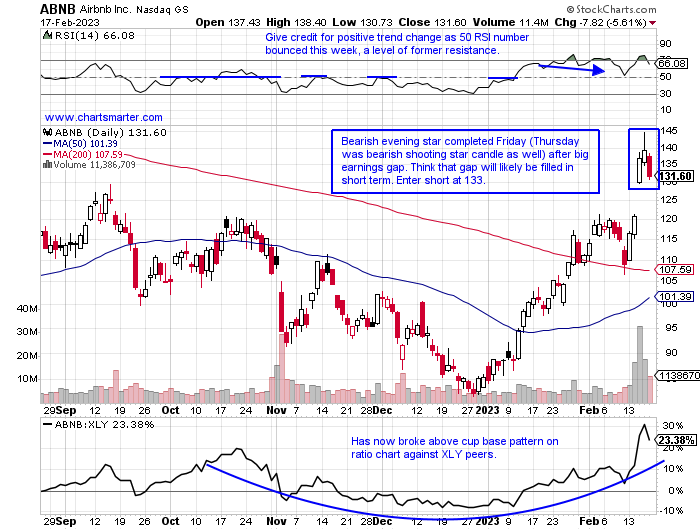
Airbnb:
- Leisure play up 54% YTD and lower by 28% over last one year period.
- Name 28% off most recent 52-week highs and has advanced 7 of last 8 weeks. Last week rose 20.9% on the third-best WEEKLY volume ever. Backed off last week near 140 level which was support between coming public in late 2020-March 2022.
- Earnings reactions mixed with gains of 13.3 and 7.7% on 2/15 and 5/4/22 and fell 13.4 and 1.1% on 11/2 and 8/3/22.
- Enter short into bearish evening star pattern.
- Entry ABNB 133. Buy stop 139.
Good luck.
This article requires a Chartsmarter membership. Please click here to join.
"These expressions of emotion have within them the seeds of destruction." Victor Neiderhoffer
Silver Lining:
- Can the PRICE of silver be a good sign for the stock market? Although it is thought of as a precious metal, more than half of its use comes from "industrial purposes" which shows a possible positive development for the global economy (silver will be found in semiconductors of all things which I did not realize). Gold which is seen as more of a store of value, has been acting a bit better than silver with the GLD off by 3% YTD and the SLV is down by 9% in 2023 so far. Looking at the chart below of the SLV shows some distribution as it is on a current 5 week losing streak with the week ending 2/3 off more than 5%. It has been under pressure as the greenback tries to steady itself above the very round par number. But the dollar recorded a shooting star candle after a doji candle Thursday after a $4 jump in February so silver may not be facing as stiff a headwind going forward. Like the GLD, the SLV recorded a bullish engulfing candle Friday and perhaps that may be equities in a glittery light, pun intended.
Crystal Clear Set Up:
- With an abundance of eyes on the 10-year, the daily chart below of the instrument demonstrates why. Friday provided a stalemate between bulls and bears. Just as it seemed a breakout above the long double bottom base near 3.9% PRICE backed off. If this can not climb above 3.9 next week I think that could really signal a regime change for the bulls to solidify their sanguine stance. Remember there is nothing more bearish that a bullish setup that fails. If one were to look at the WEEKLY chart this still looks like there is room to the upside. It is on a 4-week winning streak, and quite frankly it looks like a healthy pause following the 12-week win streak between last August and October (and is comfortably back above its 21-day EMA which it rode higher between last August-November). But the bulls have a chance here if last week proves to be a fourth lower high since a bearish counterattack candle late last October. That same candle was recorded last Friday. Something for the equity bears to ponder over the long weekend.
Winds Of Change:
- For the last 3 months, the WEEKLY VIX chart has resided below the 200 WEEKLY SMA. To show just how soft it has been since the start of Q4 '22 it has not recorded back-to-back positive weeks and has gained ground just 6 times. It is now 47% off most recent 52-week highs and last week CLOSED just above the very round 20 number. On the chart below one can see that it is testing a break of a long uptrend that began in June 2021. If it fails here where I think it is likely we could return to the mid-teen territory when the VIX resided throughout most of 2021 which was a very favorable environment for markets. On its daily chart, it is making the bearish habit of CLOSING at lows for the daily range 5 of the last 6 sessions with the exception of Thursday which advanced more than 10%. The VIX bulls have one notch in their belt with 2 of the last 3 WEEKLY gains being bullish harami cross candles, but neither has garnered any follow-through.
Mister Softee Must Firm:
- Scouring over the 13F reports this week it brought back to mind the quote, "the more things change the more they stay the same". I was not too surprised that many funds are still pinning their hopes on the mega-cap tech names with top holdings in AMZN GOOGL META and the chart below of MSFT (the lack of creativity in searching for new potential leadership baffles me). Microsoft which late this week dropped to the third largest market cap company (behind Aramco) on the planet, no doubt still carries clout, but for it to be taken seriously in my opinion it must negate the bearish counterattack candle from 2/9. A rest here along possible 200-day SMA support, a line that rejected the stock's advance last August and December must hold. Bulls do not want this to look like the brief period where it jumped above that secular line for a short time last March before falling back below it again in April. Give it credit for breaking above the downtrend of lower highs since November '21, but this 250 area is a big line in the sand.
David Versus Goliath:
- Even with the nascent, welcomed rebound in technology in 2023, the creme of the crop if one is judging that by the major S&P sector leaderboard is still consumer discretionary. On a YTD basis, the XLY has risen more than 16%, the best of 11, and topping communication services and technology up 15 and 12% respectively to round out the top 3. But if we look under the surface just a bit more we will see the "smaller cap" more equal-weighted XRT outshining the XLY higher by 18% this year so far (it carries a better dividend yield above 3% as well). And this performance takes into consideration TSLA (15% of the XLY) doubling since the 1/6 bullish engulfing candle right at the very round par number. The XRT rose 3.4% last week, twice as much as the XLY gain, and it is "just" 13% from its most recent 52-week highs compared to the XLY 22% off its own annual peak. The ratio chart at the bottom of the chart below shows this strength for the XRT over the XLY is nothing new. But remember this does not mean both can not perform well on an absolute basis, it is just stating on a relative basis one may want to overweight the XRT. Let's take a look at 2 individual names in the space.
JD.com
- Chinese internet retail play down 6% YTD and 29% over last one year period.
- Name 29% off most recent 52-week highs and decent relative strength last week up 1.4% as the KWEB declined by the nearly same amount. To be fair JD dropped 9% the prior 2 weeks while KWEB fell by a combined 12%.
- Earnings reactions mixed up 3.4 and 4.1% on 8/23 and 5/17/22 and fell 2.5 and 15.8% on 11/18 and 3/10/22.
- Enter after bullish island reversal/gap fill.
- Entry JD here. Stop 49.
Airbnb:
- Leisure play up 54% YTD and lower by 28% over last one year period.
- Name 28% off most recent 52-week highs and has advanced 7 of last 8 weeks. Last week rose 20.9% on the third-best WEEKLY volume ever. Backed off last week near 140 level which was support between coming public in late 2020-March 2022.
- Earnings reactions mixed with gains of 13.3 and 7.7% on 2/15 and 5/4/22 and fell 13.4 and 1.1% on 11/2 and 8/3/22.
- Enter short into bearish evening star pattern.
- Entry ABNB 133. Buy stop 139.
Good luck.