Yields Ebbing?
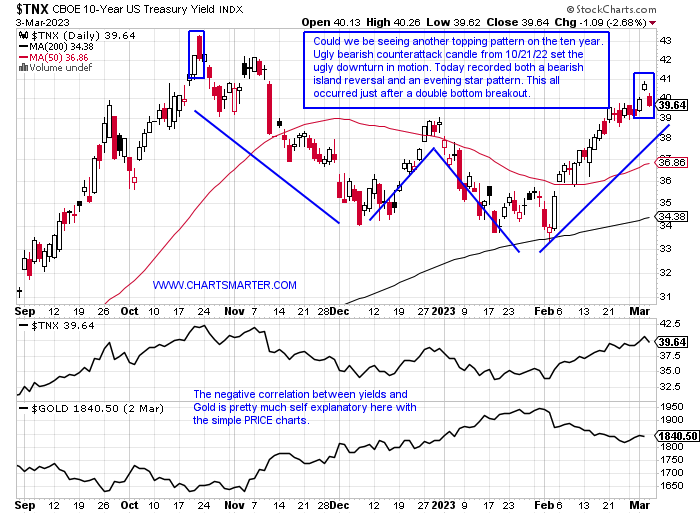
- Some intermarket relationships lose their lust as time passes and too many key in on them. Others remain intact and the chart below shows the negative correlation between the ten-year yield and Gold. We know the latter has not performed, which it is supposed to do in an inflationary environment. But if yields are really topping here, of course, we will not know until hindsight, perhaps gold will start to glitter. The TNX Friday recorded both a bearish evening star and island reversal all in one while doing so just after a breakout. Very often a failure so soon after a breakout is a red flag. If gold names can start to shine, pun intended, that would put another feather in the hat of the strengthening materials space. The GDX rose every day this week rising 6%, and ending a 6-week losing streak, and if it can CLOSE above 30 in the near term that would negate a possible bearish head and shoulders pattern. It helped the XLB to be the best-performing major S&P sector last week up 4.2%.
Packaging Signals:
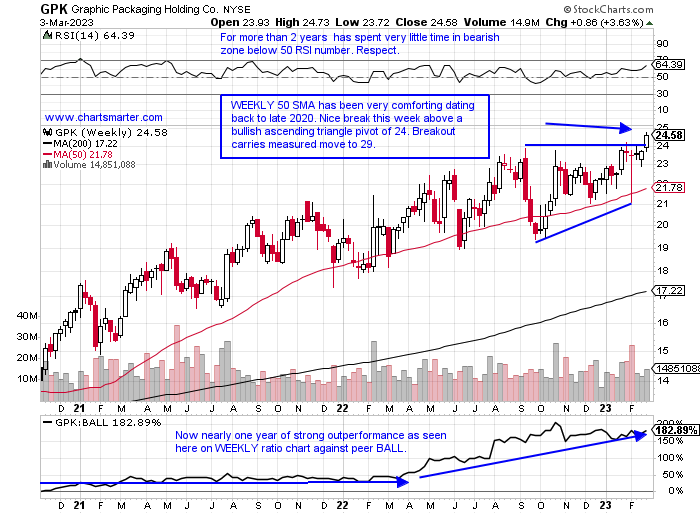
- The packaging and container names could give us a genuine look at the health of the economy. Simply put if more things are being packaged it could be a good sign. Of course, there will be bifurcation within and that speaks to whether the signal is real or is it just a function of an inferior management team for example. Stocks like OI suggest a sanguine outlook as it has broken above a WEEKLY cup base pivot of 19.56 in a pattern almost 2 years long. Great accumulation has taken place with double-digit WEEKLY gains in robust volume in the weeks ending 1/6 and 2/3 jumping 14.2 and 22.1% respectively. Contrast that action with laggards SEE and WRK now down 31 and 40% from their most recent 52-week highs. Below is the chart of GPK which is trading at highs not seen in almost 30 years. Since the COVID lows in early 2020, it has made higher highs and lows, even throughout 2022, a pretty solid stat.
Recent Examples:
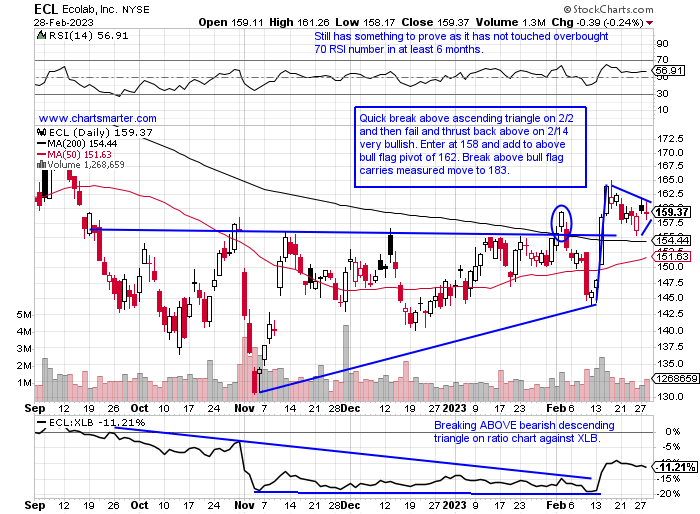
- The specialty chemicals space is witnessing some nice action among select names, indicating that perhaps a stronger economy is not too far into the future as the market tends to look 6 months ahead. WLK is sniffing out a double bottom pivot of 125.04. CBT continues its ascent after breaking above a WEEKLY bullish ascending triangle pivot above 77, which should carry a measured move to almost the very round par number. Others are trying to stabilize after weak recent earnings reports like ALB although the longer it takes to break above 260 a bear flag will take shape. Below is the chart of ECL and how it appeared in our 3/1 Materials Note. One has to admire the break above a bullish ascending triangle and then the break above a bull flag. Remember the best names will give you add-on buy points on the way UP. Respect that it has given back very little of the 11.2% gain the week ending 2/17.
Special Situations:
BHP Group:
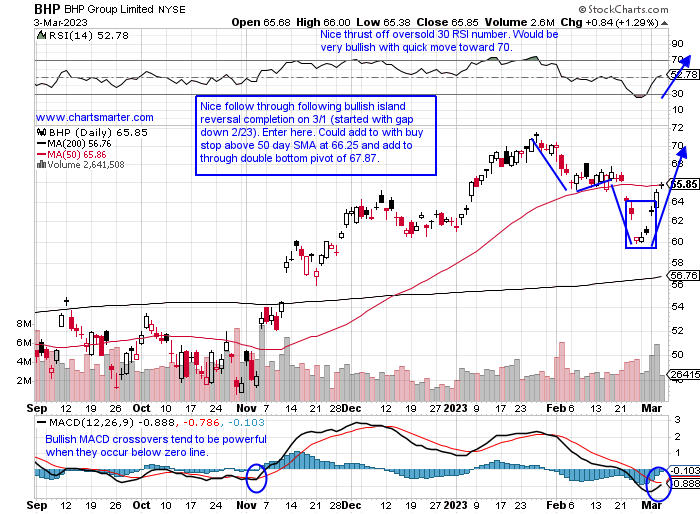
- Australian basic materials giant up 6% YTD and 1% over last one year period. Dividend yield of 8.1%.
- Name 8% off most recent 52-week highs and on WEEKLY CLOSING basis has been trading between round 60-70 numbers since first week of last December. This week rose 9% recapturing all of the prior week's slump.
- Earnings reactions mostly lower down 3.1 and 1.1% on 2/22 and 2/15/22 and rose 5.9% on 8/16.
- Enter after bullish island reversal.
- Entry BHP here. Stop 61.
Sherwin Williams:
- Specialty chemical company down 4% YTD and 11% over last one year period. Dividend yield of 1.1%.
- Name 20% off most recent 52-week highs and lower 9 of last 13 weeks. On the WEEKLY chart finding support near 61.8% Fib retracement level from last October-December PRICE advance off very round 200 number.
- Earnings reactions mixed up 3.6 and 9.4% on 10/25 and 4/26/22 and fell 8.9 and 8.8% on 1/26 and 7/27/22.
- Enter after multiple dojis/bullish engulfing candle.
- Entry SHW here. Stop 215.

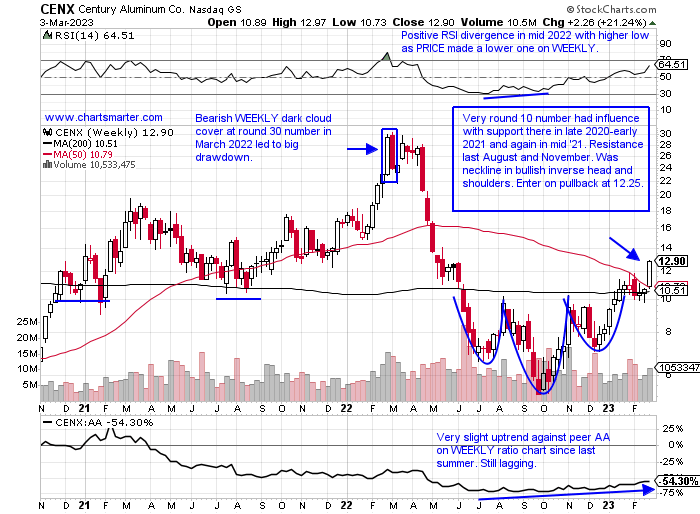
Century Aluminum:
- Aluminum play up 58% YTD and lower by 55% over last one year period.
- Name 58% off most recent 52-week highs and is up 9 of last 11 weeks and last week jumped 21.2% (fifth double-digit WEEKLY gain since last October). Has more than doubled since late 2022 lows.
- Three straight positive earnings reactions up 2.7, 8.2, and 18.6% on 2/24, 11/8, and 8/10/22 after a loss of 12.7% on 4/29/22.
- Enter on pullback into WEEKLY bullish inverse head and shoulders breakout.
- Entry CENX 12.25. Stop 10.50.
Good luck.
Entry summaries:
Buy after bullish island reversal BHP here. Stop 61.
Buy after multiple dojis/bullish engulfing candle SHW here. Stop 215.
Buy pullback into WEEKLY bullish inverse head and shoulders breakout CENX 12.25. Stop 10.50.
This article requires a Chartsmarter membership. Please click here to join.
Yields Ebbing?
- Some intermarket relationships lose their lust as time passes and too many key in on them. Others remain intact and the chart below shows the negative correlation between the ten-year yield and Gold. We know the latter has not performed, which it is supposed to do in an inflationary environment. But if yields are really topping here, of course, we will not know until hindsight, perhaps gold will start to glitter. The TNX Friday recorded both a bearish evening star and island reversal all in one while doing so just after a breakout. Very often a failure so soon after a breakout is a red flag. If gold names can start to shine, pun intended, that would put another feather in the hat of the strengthening materials space. The GDX rose every day this week rising 6%, and ending a 6-week losing streak, and if it can CLOSE above 30 in the near term that would negate a possible bearish head and shoulders pattern. It helped the XLB to be the best-performing major S&P sector last week up 4.2%.
Packaging Signals:
- The packaging and container names could give us a genuine look at the health of the economy. Simply put if more things are being packaged it could be a good sign. Of course, there will be bifurcation within and that speaks to whether the signal is real or is it just a function of an inferior management team for example. Stocks like OI suggest a sanguine outlook as it has broken above a WEEKLY cup base pivot of 19.56 in a pattern almost 2 years long. Great accumulation has taken place with double-digit WEEKLY gains in robust volume in the weeks ending 1/6 and 2/3 jumping 14.2 and 22.1% respectively. Contrast that action with laggards SEE and WRK now down 31 and 40% from their most recent 52-week highs. Below is the chart of GPK which is trading at highs not seen in almost 30 years. Since the COVID lows in early 2020, it has made higher highs and lows, even throughout 2022, a pretty solid stat.
Recent Examples:
- The specialty chemicals space is witnessing some nice action among select names, indicating that perhaps a stronger economy is not too far into the future as the market tends to look 6 months ahead. WLK is sniffing out a double bottom pivot of 125.04. CBT continues its ascent after breaking above a WEEKLY bullish ascending triangle pivot above 77, which should carry a measured move to almost the very round par number. Others are trying to stabilize after weak recent earnings reports like ALB although the longer it takes to break above 260 a bear flag will take shape. Below is the chart of ECL and how it appeared in our 3/1 Materials Note. One has to admire the break above a bullish ascending triangle and then the break above a bull flag. Remember the best names will give you add-on buy points on the way UP. Respect that it has given back very little of the 11.2% gain the week ending 2/17.
Special Situations:
BHP Group:
- Australian basic materials giant up 6% YTD and 1% over last one year period. Dividend yield of 8.1%.
- Name 8% off most recent 52-week highs and on WEEKLY CLOSING basis has been trading between round 60-70 numbers since first week of last December. This week rose 9% recapturing all of the prior week's slump.
- Earnings reactions mostly lower down 3.1 and 1.1% on 2/22 and 2/15/22 and rose 5.9% on 8/16.
- Enter after bullish island reversal.
- Entry BHP here. Stop 61.
Sherwin Williams:
- Specialty chemical company down 4% YTD and 11% over last one year period. Dividend yield of 1.1%.
- Name 20% off most recent 52-week highs and lower 9 of last 13 weeks. On the WEEKLY chart finding support near 61.8% Fib retracement level from last October-December PRICE advance off very round 200 number.
- Earnings reactions mixed up 3.6 and 9.4% on 10/25 and 4/26/22 and fell 8.9 and 8.8% on 1/26 and 7/27/22.
- Enter after multiple dojis/bullish engulfing candle.
- Entry SHW here. Stop 215.
Century Aluminum:
- Aluminum play up 58% YTD and lower by 55% over last one year period.
- Name 58% off most recent 52-week highs and is up 9 of last 11 weeks and last week jumped 21.2% (fifth double-digit WEEKLY gain since last October). Has more than doubled since late 2022 lows.
- Three straight positive earnings reactions up 2.7, 8.2, and 18.6% on 2/24, 11/8, and 8/10/22 after a loss of 12.7% on 4/29/22.
- Enter on pullback into WEEKLY bullish inverse head and shoulders breakout.
- Entry CENX 12.25. Stop 10.50.
Good luck.
Entry summaries:
Buy after bullish island reversal BHP here. Stop 61.
Buy after multiple dojis/bullish engulfing candle SHW here. Stop 215.
Buy pullback into WEEKLY bullish inverse head and shoulders breakout CENX 12.25. Stop 10.50.