“Sometimes when you’re in a dark place, you think you’ve been buried, but you’ve actually been planted.” Christine Caine
New Beginnings?
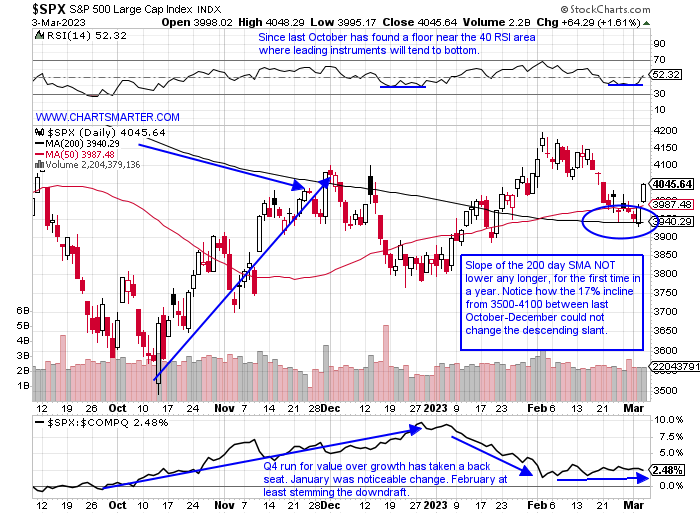
- Could the above quote be attributed to nascent bulls that feel like they have found new life as of late? While we are impressed with the move technology has made overall, below is the chart we will focus on of the S&P 500. It is one of the most widely followed benchmarks, and how many are judged by their performance. Does that old phrase "time in the market beats timing the market" come into play here? Remember the reason why it is so hard to beat the S&P 500 is that it holds onto its winners (sure it reshuffles a few names every year but you get the idea). The bulls have a reason for a bit of optimism here as the S&P 500 continues to make higher lows since last October. It recorded a bullish engulfing candle last Thursday off the 200-day SMA, and it is uncanny how this secular moving average has played such a simple yet vital role. It was resistance, last March-April, August, and last November-December. Now it is looking like support, but more importantly for the first time in a year the slope of the line is starting to flatline, and that may be a vital clue. It is how many a market prognosticator determines its true trend.
Quality Over Quantity:
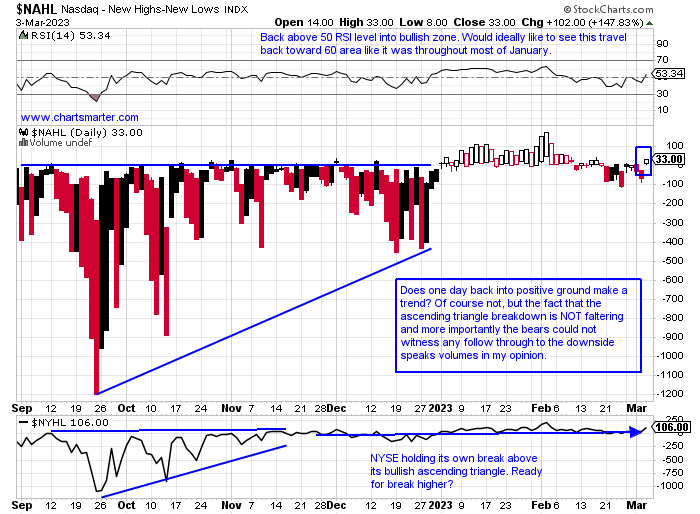
- Full disclosure in last weekend's Week Ahead Note we mentioned that the NYHL (NYSE new 52-week highs versus 52-week lows) was perhaps a better indicator when looking at possible inclusion to market strength. One of those reasons was the abundance of stocks that traded in the $1 range, not a typo, on the chart below of the NAHL. But Friday did poke its head back into positive territory but more importantly, the character of examples on the Nasdaq new 52-week highs list was impressive. They include trucking play ARCB which is poking its head above a bull flag formation just above the very round par number. Add to that list BECN BKNG CPRT FISV FSLR FWONK PCAR SRPT STLD, and those looking for some techy names would see PRGS taking out a bull flag after an ascending triangle on 2/1. Or an NXT, a renewable energy equipment IPO (fancy way of saying solar), breaking above a sideways range. Green shoots abound.
South Of The Border Strength:
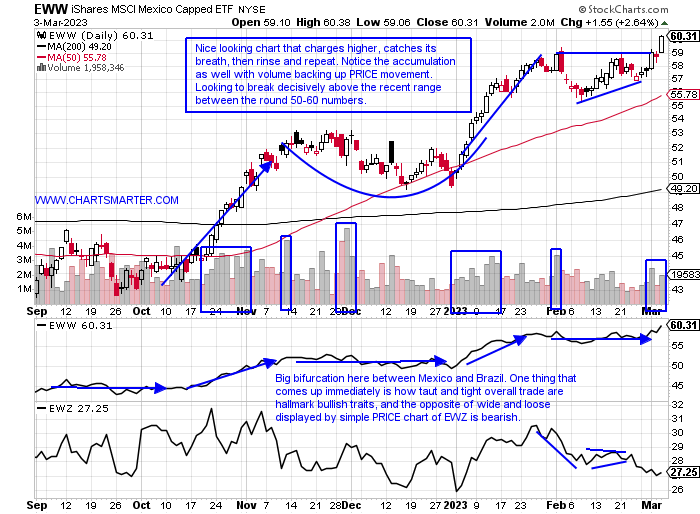
- When Willie Sutton was questioned about his robbing banks he famously quipped "because that is where the money is". If we can compare that to where money is clearly flowing in capital markets the chart below of Mexico does that theme plenty of justice. The EWW is up 22% YTD and sports a dividend yield of 2.6%. Friday it rose 2.6% clearly the best-behaved major international regional ETF performance and cleared a bull flag pivot above 59 which now carries a measured move to 69. For the week it advanced 5.4%, trouncing the 1.9% gain of the S&P 500. Accumulation is on display, and it has now negated three bearish engulfing candles from 1/27, 2/2, and 2/21 right near the 59 pivot. The ETF is devoid of technology, instead seeing a nice mix of materials, industrials, financial and communication names. Compare its PRICE behavior with that of regional rival Brazil which just broke below a bear flag trigger of 28 and trades 31% off most recent 52-week highs (EWW is currently trading right at almost decade highs).
Equipment Stamina:
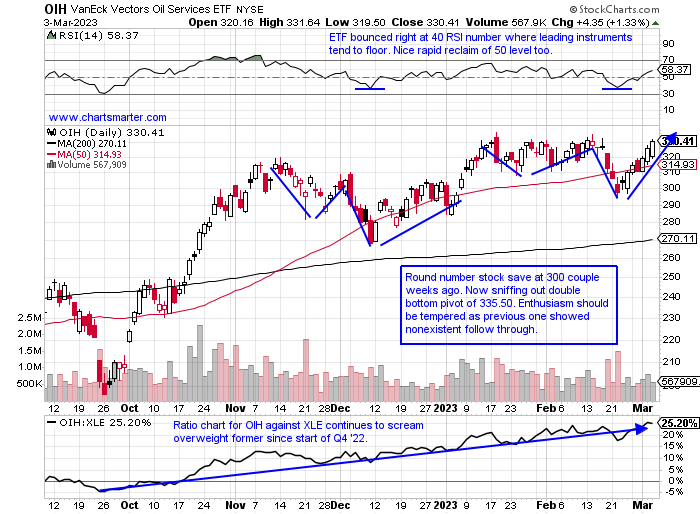
- On a YTD basis, energy finds itself in an unfamiliar position from the last couple of years as it is just the eighth-best major S&P sector out of 11, and one of 4 that is in the red thus far in 2023. But do not judge a book by its cover, as some groups within are behaving well. Below is the chart of the OIH which shows this quickly approaching a double-bottom trigger. It sits at just 2% off most recent 52-week highs while the XLE is 8% off its own annual peak (more "equal weight" XOP is 17% of heights achieved last June). Your hard-earned capital should be deployed where it is treated best, and inside energy (coal is worth a look), there is no contest between equipment and exploration. Contributing to that for sure could be the largest monthly decline in oil rigs in 2 years. PRICE is omnipotent and should be followed religiously and leaders that should be paid attention to are WFRD which is back to the upper range between 60-70 and this time around not shying away from the latter figure as it did in mid-February. Above the 70 bull flag pivot could see a brisk move to 80.
Software Responds:
- What a difference a couple of sessions can make. Bulls were scarce early in the week but a nice end to CLOSE the week firm. Below is the chart of the IGV and give it credit for hanging tough where it needed to. So far in 2023, it fell on a WEEKLY basis just 3 times, but that may be a bit misleading. The 3 weeks ending between 2/10-24 all CLOSED hard upon their lows. I would feel a lot better with a WEEKLY CLOSE above the round 300 number as that was the level of rejection the week ending 2/3, and then the very next week recorded a doji candle, which often signals a change in the prevailing direction. Volume last week for the IGV was the softest for 2023 so far reflecting investor's uncertainty. I think this can be painted in a bullish light as once the market participant's appetite comes back, via a volume footprint, it could send the ETF much higher. This is all noise until PRICE confirms. Beware names that underperformed this week like PUBM ZS BOX or an ESMT for example. Focus on names that have proven their mettle like the chart below of NOW and FOUR.

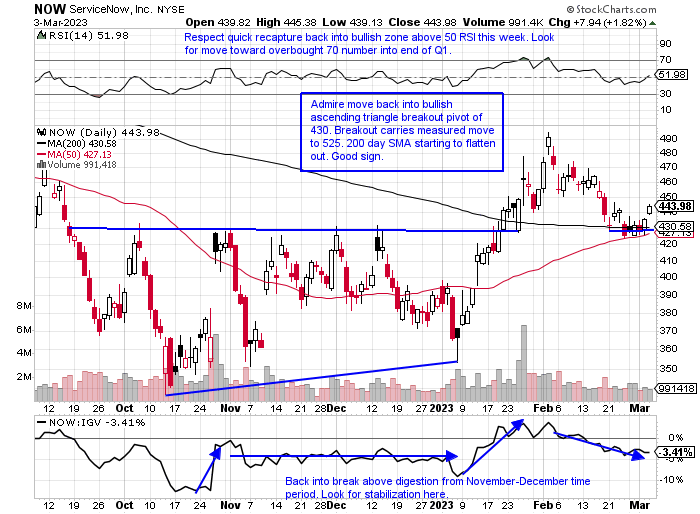
ServiceNow:
- Software play up 14% YTD and lower by 21% over last one year period.
- Name 26% off most recent 52-week highs (lagging IGV which is 19% off annual peak) and slightly outperforming this week up 4.3% this week as IGV rose 3.7%. Precipitous drop since rejection at round 700 number in November 2021.
- Earnings mostly higher up 3.2, 13.4, and 8.1% on 1/26, 10/27, and 4/28/22, and down 2.7% on 7/28/22.
- Enter after successful bullish ascending breakout retest.
- Entry NOW here. Stop 425.
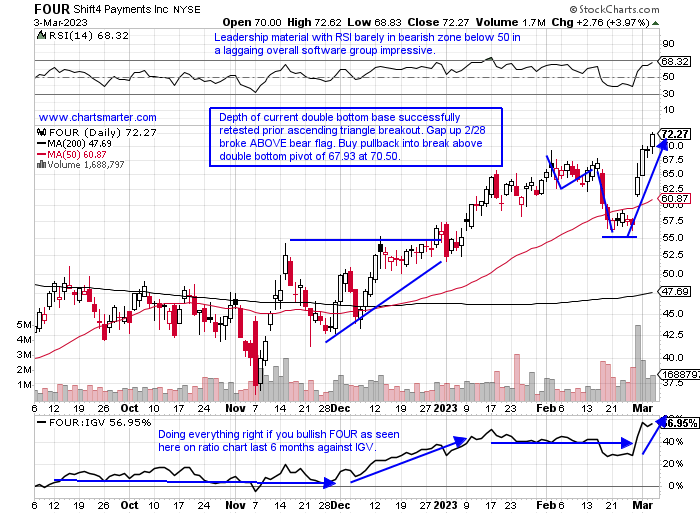
Shift4 Payments:
- Software name up 29% YTD and 57% over last one year period.
- Name at 52-week highs and advanced 23 of last 34 weeks well more than doubling in the process. Could easily see this moving back to very round par number where it traded almost 2 years ago sometime in 2023.
- Earnings reactions mixed up 13 and 6.5% on 2/28 and 8/4/22 and down 7.1 and 14.5% on 11/7 and 5/5/22.
- Enter on pullback into double bottom breakout.
- Entry FOUR 70.50. Stop 65.
Good luck.
This article requires a Chartsmarter membership. Please click here to join.
“Sometimes when you’re in a dark place, you think you’ve been buried, but you’ve actually been planted.” Christine Caine
New Beginnings?
- Could the above quote be attributed to nascent bulls that feel like they have found new life as of late? While we are impressed with the move technology has made overall, below is the chart we will focus on of the S&P 500. It is one of the most widely followed benchmarks, and how many are judged by their performance. Does that old phrase "time in the market beats timing the market" come into play here? Remember the reason why it is so hard to beat the S&P 500 is that it holds onto its winners (sure it reshuffles a few names every year but you get the idea). The bulls have a reason for a bit of optimism here as the S&P 500 continues to make higher lows since last October. It recorded a bullish engulfing candle last Thursday off the 200-day SMA, and it is uncanny how this secular moving average has played such a simple yet vital role. It was resistance, last March-April, August, and last November-December. Now it is looking like support, but more importantly for the first time in a year the slope of the line is starting to flatline, and that may be a vital clue. It is how many a market prognosticator determines its true trend.
Quality Over Quantity:
- Full disclosure in last weekend's Week Ahead Note we mentioned that the NYHL (NYSE new 52-week highs versus 52-week lows) was perhaps a better indicator when looking at possible inclusion to market strength. One of those reasons was the abundance of stocks that traded in the $1 range, not a typo, on the chart below of the NAHL. But Friday did poke its head back into positive territory but more importantly, the character of examples on the Nasdaq new 52-week highs list was impressive. They include trucking play ARCB which is poking its head above a bull flag formation just above the very round par number. Add to that list BECN BKNG CPRT FISV FSLR FWONK PCAR SRPT STLD, and those looking for some techy names would see PRGS taking out a bull flag after an ascending triangle on 2/1. Or an NXT, a renewable energy equipment IPO (fancy way of saying solar), breaking above a sideways range. Green shoots abound.
South Of The Border Strength:
- When Willie Sutton was questioned about his robbing banks he famously quipped "because that is where the money is". If we can compare that to where money is clearly flowing in capital markets the chart below of Mexico does that theme plenty of justice. The EWW is up 22% YTD and sports a dividend yield of 2.6%. Friday it rose 2.6% clearly the best-behaved major international regional ETF performance and cleared a bull flag pivot above 59 which now carries a measured move to 69. For the week it advanced 5.4%, trouncing the 1.9% gain of the S&P 500. Accumulation is on display, and it has now negated three bearish engulfing candles from 1/27, 2/2, and 2/21 right near the 59 pivot. The ETF is devoid of technology, instead seeing a nice mix of materials, industrials, financial and communication names. Compare its PRICE behavior with that of regional rival Brazil which just broke below a bear flag trigger of 28 and trades 31% off most recent 52-week highs (EWW is currently trading right at almost decade highs).
Equipment Stamina:
- On a YTD basis, energy finds itself in an unfamiliar position from the last couple of years as it is just the eighth-best major S&P sector out of 11, and one of 4 that is in the red thus far in 2023. But do not judge a book by its cover, as some groups within are behaving well. Below is the chart of the OIH which shows this quickly approaching a double-bottom trigger. It sits at just 2% off most recent 52-week highs while the XLE is 8% off its own annual peak (more "equal weight" XOP is 17% of heights achieved last June). Your hard-earned capital should be deployed where it is treated best, and inside energy (coal is worth a look), there is no contest between equipment and exploration. Contributing to that for sure could be the largest monthly decline in oil rigs in 2 years. PRICE is omnipotent and should be followed religiously and leaders that should be paid attention to are WFRD which is back to the upper range between 60-70 and this time around not shying away from the latter figure as it did in mid-February. Above the 70 bull flag pivot could see a brisk move to 80.
Software Responds:
- What a difference a couple of sessions can make. Bulls were scarce early in the week but a nice end to CLOSE the week firm. Below is the chart of the IGV and give it credit for hanging tough where it needed to. So far in 2023, it fell on a WEEKLY basis just 3 times, but that may be a bit misleading. The 3 weeks ending between 2/10-24 all CLOSED hard upon their lows. I would feel a lot better with a WEEKLY CLOSE above the round 300 number as that was the level of rejection the week ending 2/3, and then the very next week recorded a doji candle, which often signals a change in the prevailing direction. Volume last week for the IGV was the softest for 2023 so far reflecting investor's uncertainty. I think this can be painted in a bullish light as once the market participant's appetite comes back, via a volume footprint, it could send the ETF much higher. This is all noise until PRICE confirms. Beware names that underperformed this week like PUBM ZS BOX or an ESMT for example. Focus on names that have proven their mettle like the chart below of NOW and FOUR.
ServiceNow:
- Software play up 14% YTD and lower by 21% over last one year period.
- Name 26% off most recent 52-week highs (lagging IGV which is 19% off annual peak) and slightly outperforming this week up 4.3% this week as IGV rose 3.7%. Precipitous drop since rejection at round 700 number in November 2021.
- Earnings mostly higher up 3.2, 13.4, and 8.1% on 1/26, 10/27, and 4/28/22, and down 2.7% on 7/28/22.
- Enter after successful bullish ascending breakout retest.
- Entry NOW here. Stop 425.
Shift4 Payments:
- Software name up 29% YTD and 57% over last one year period.
- Name at 52-week highs and advanced 23 of last 34 weeks well more than doubling in the process. Could easily see this moving back to very round par number where it traded almost 2 years ago sometime in 2023.
- Earnings reactions mixed up 13 and 6.5% on 2/28 and 8/4/22 and down 7.1 and 14.5% on 11/7 and 5/5/22.
- Enter on pullback into double bottom breakout.
- Entry FOUR 70.50. Stop 65.
Good luck.