"The trouble with the world is that the stupid are cocksure and the intelligent full of doubt". Bertrand Russell
Could This Be The Beginning Of The End?
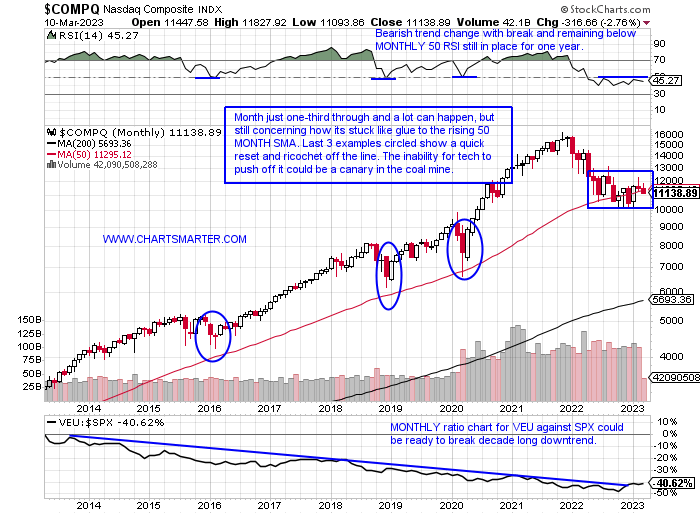
- Savvy investors always consider one thing paramount. Preservation of capital. Risk management. Gains tend to take care of themselves if left alone after a well-thought-out strategy, but losses if not tended to can spiral out of control. Below is the MONTHLY chart of the Nasdaq, and it may be a little early to be looking at it less than halfway into March, but its shortcomings in finding any resolve springing of the MONTHLY 50 SMA is and has been concerning. It is now almost one year of clinging onto that line, plenty of time for bulls to get their act together in my opinion, and resume an uptrend as it did on rare touches 3 other times during the last decade. I put a MONTHLY ratio chart comparing the VEU, the Vanguard All World Ex ETF, against the S&P 500. Could a break above the downtrend be upon us (the daily ratio chart shows a clear uptrend for VEU since November)? Could Mike Wilson be correct with his 3000 S&P 500 target (round number theory)? The United States' superpower status is fading fast and that could be translated via softer domestic stock market PRICES going forward.
Bond Bulls Basking:
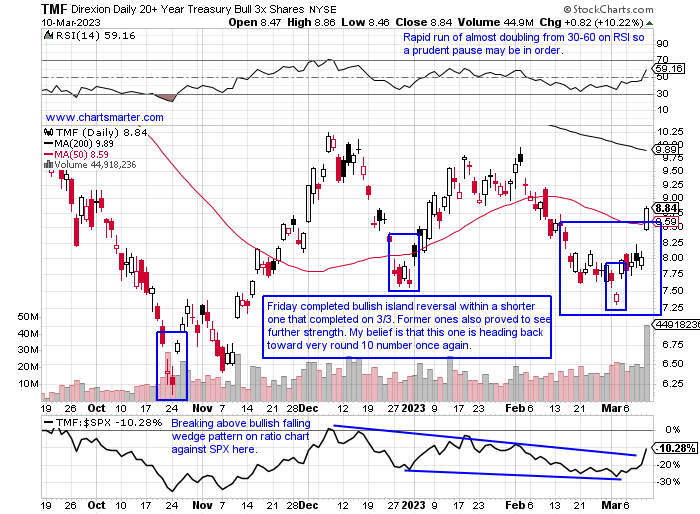
- There were some wild moves in the finance sector this week with the shellacking of SIVB (it will trade much lower next week after the halt but I witnessed how round number theory came into play with a brief bounce off the intraday low precisely at 100 on Thursday). The XLF cratered 8.5% in more than double the average WEEKLY volume, its largest WEEKLY PRICE drop since the week ending 6/12/20. Weakness was more intense obviously in the KRE off 16% last week. Bond yields swooned with the widely followed 10-year falling from above 4% intraday Thursday to below 3.7% at the CLOSE Friday. Bond PRICES which trade in an inverse manner to yields jumped, and that visual may be best expressed with the daily chart (leveraged) below of the TMF. Island reversals have been reliable (bearish one completed with a gap down on 12/9/22 after a gap up on 12/6) and one can see the abundance of these in the last 6 months. Its WEEKLY chart sports a bullish ascending triangle with a rejection at the very round 10 number last December and this January. This instrument can be bought on a pullback into the 8.5-8.6% range.
Gold Bugs Rejoice?
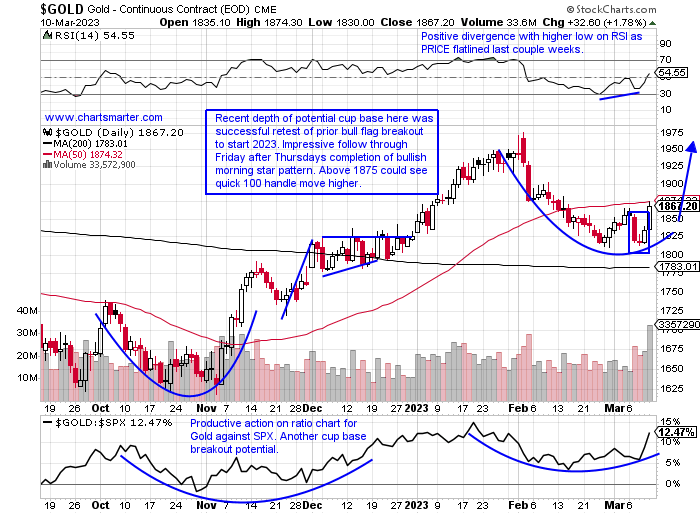
- It has been some tough times for gold bugs over the years as it has not behaved like it is traditionally thought of as an inflation hedge. But looking at the metal on its own PRICE merits it may be ready to charge back toward the very round 2000 figure that stunted its growth twice in early 2022. Friday it put on a solid show, following through from Thursday's completion of a bullish morning star pattern. Its progress was halted just below its 50-day SMA, but that rejection could prove temporary. Its WEEKLY chart recorded a bullish hammer last week after the prior week was a bullish engulfing week, with each of the last 3 weeks bouncing off the 50 WEEKLY SMA. The WEEKLY doji candle ending 1/27 was accurate in calling for the exhaustion of the prior run higher that rose 9 of the prior 12 weeks, and the recent action may be the handle on the construction of a possible cup base that began one year ago. The miners themselves are all sporting bear flags, but remember to watch them as possible breaks ABOVE could be interpreted as FALSE moves and see big moves higher in the near term.
"Commodity" Pickers Market:
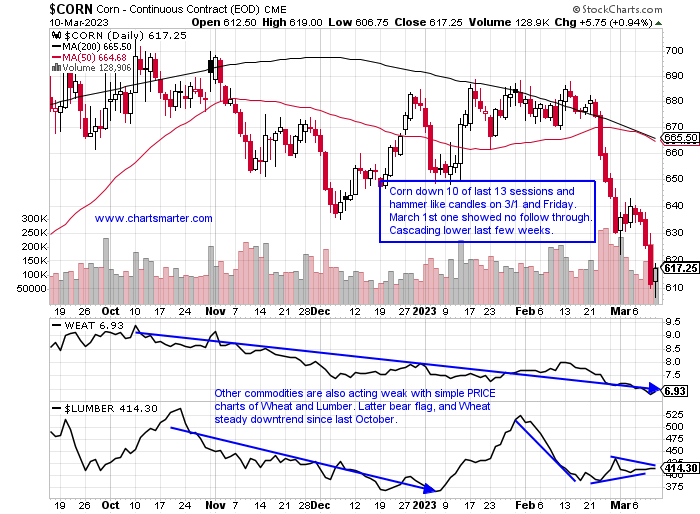
- In volatile market times, you will often hear the phrase "stock pickers market". Technical analysis often comes in handy in these environments as active management gets the nod over passive. But there have been some interesting bifurcations in the commodity complex. Orange juice, cocoa, and sugar futures are in nice uptrends, while others like cotton and lumber are weak. The WEAT ETF is now 44% off made precisely one year ago near the 12 area where it reversed on its WEEKLY chart back-to-back weeks last March. Further complicating a complex inflation scenario is the chart of CORN below. It is on its first 4-week losing streak since the end of Q2 '22. Its 200-day SMA has been sloping lower since last December, so it can not blame the market's recent malaise on its current downfall. COPPER is the one I am most interested in as it holds the $4 level since the start of February, an area of resistance last November.
Unlikely Outlier:
- In tumultuous times stock market participants tend to cling to a more defensive posture. That need is often fulfilled with mature, defensive, dividend-paying names. Technology is not often thought of that way but there are a few "old tech" areas that may be attractive to some. Not for me, but it was interesting how a questionable play like INTC performed well last week. This name is still a huge laggard off 48% from most recent 52-week highs and that is even with the impressive move in the last couple of weeks. It has demonstrated legitimate relative strength versus its peers as the week ending 3/3 it rose 5%, nearly doubling the gain of the SMH's 2.8%. But last week was more imposing up 3.1% as the SMH fell by 3%. Last month it cut its dividend by 2/3rds and perhaps shareholders are cheering the move. Others that may be worth a look are IBM, yielding better than 5%, as it is forming a bullish falling wedge, but it needs some bottoming candles to confirm (may need to fill in the gap from the 10/19 session).
Biotech Waterfall?
- The overall healthcare group has been under assault as of late with the XLV now lower in 12 of the last 14 weeks, with last week falling almost 4% in double average WEEKLY volume, its worst WEEKLY loss since the last week of August 2022. To show that technical analysis is not a panacea the bullish harami cross and dragonfly doji the week ending 3/3 did little to stop the downtrend. Looking at the MONTHLY chart of the XBI it is forming a dubious head and shoulders pattern and is approaching the neckline at the round 70 number. Looking back four months since late 2018 were below the 70 figure intramonth, December 2018, March 2020, and May-June 2022, with only one CLOSE below it in May 2022. A CLOSE below 70 going forward could see a cascade lower. Three of the last 5 weeks CLOSED hard upon their lows for the WEEKLY range down 5, 6, and 9% respectively. I still think some names offer good risk/reward here including AMGN as it fills in the gap here from the 10/10/22 session. Let's take a look at an attractive mid-cap below in APLS.
Apellis Pharmaceuticals:
- Biopharma play up 20% YTD and 34% over last one year period.
- Name 12% off most recent 52-week highs and on the WEEKLY chart if it can get above 70, a hindrance since summer 2021, would be a breakout above ascending triangle with a measured move to 112.
- Earnings reactions mostly lower off 16, 1.6, and 8.7% on 11/4, 8/8, and 5/6/22 before gaining of 5.4% on 2/1.
- Enter on pullback into round number range.
- Entry APLS 61.25. Stop 55.
Good luck.
This article requires a Chartsmarter membership. Please click here to join.
"The trouble with the world is that the stupid are cocksure and the intelligent full of doubt". Bertrand Russell
Could This Be The Beginning Of The End?
- Savvy investors always consider one thing paramount. Preservation of capital. Risk management. Gains tend to take care of themselves if left alone after a well-thought-out strategy, but losses if not tended to can spiral out of control. Below is the MONTHLY chart of the Nasdaq, and it may be a little early to be looking at it less than halfway into March, but its shortcomings in finding any resolve springing of the MONTHLY 50 SMA is and has been concerning. It is now almost one year of clinging onto that line, plenty of time for bulls to get their act together in my opinion, and resume an uptrend as it did on rare touches 3 other times during the last decade. I put a MONTHLY ratio chart comparing the VEU, the Vanguard All World Ex ETF, against the S&P 500. Could a break above the downtrend be upon us (the daily ratio chart shows a clear uptrend for VEU since November)? Could Mike Wilson be correct with his 3000 S&P 500 target (round number theory)? The United States' superpower status is fading fast and that could be translated via softer domestic stock market PRICES going forward.
Bond Bulls Basking:
- There were some wild moves in the finance sector this week with the shellacking of SIVB (it will trade much lower next week after the halt but I witnessed how round number theory came into play with a brief bounce off the intraday low precisely at 100 on Thursday). The XLF cratered 8.5% in more than double the average WEEKLY volume, its largest WEEKLY PRICE drop since the week ending 6/12/20. Weakness was more intense obviously in the KRE off 16% last week. Bond yields swooned with the widely followed 10-year falling from above 4% intraday Thursday to below 3.7% at the CLOSE Friday. Bond PRICES which trade in an inverse manner to yields jumped, and that visual may be best expressed with the daily chart (leveraged) below of the TMF. Island reversals have been reliable (bearish one completed with a gap down on 12/9/22 after a gap up on 12/6) and one can see the abundance of these in the last 6 months. Its WEEKLY chart sports a bullish ascending triangle with a rejection at the very round 10 number last December and this January. This instrument can be bought on a pullback into the 8.5-8.6% range.
Gold Bugs Rejoice?
- It has been some tough times for gold bugs over the years as it has not behaved like it is traditionally thought of as an inflation hedge. But looking at the metal on its own PRICE merits it may be ready to charge back toward the very round 2000 figure that stunted its growth twice in early 2022. Friday it put on a solid show, following through from Thursday's completion of a bullish morning star pattern. Its progress was halted just below its 50-day SMA, but that rejection could prove temporary. Its WEEKLY chart recorded a bullish hammer last week after the prior week was a bullish engulfing week, with each of the last 3 weeks bouncing off the 50 WEEKLY SMA. The WEEKLY doji candle ending 1/27 was accurate in calling for the exhaustion of the prior run higher that rose 9 of the prior 12 weeks, and the recent action may be the handle on the construction of a possible cup base that began one year ago. The miners themselves are all sporting bear flags, but remember to watch them as possible breaks ABOVE could be interpreted as FALSE moves and see big moves higher in the near term.
"Commodity" Pickers Market:
- In volatile market times, you will often hear the phrase "stock pickers market". Technical analysis often comes in handy in these environments as active management gets the nod over passive. But there have been some interesting bifurcations in the commodity complex. Orange juice, cocoa, and sugar futures are in nice uptrends, while others like cotton and lumber are weak. The WEAT ETF is now 44% off made precisely one year ago near the 12 area where it reversed on its WEEKLY chart back-to-back weeks last March. Further complicating a complex inflation scenario is the chart of CORN below. It is on its first 4-week losing streak since the end of Q2 '22. Its 200-day SMA has been sloping lower since last December, so it can not blame the market's recent malaise on its current downfall. COPPER is the one I am most interested in as it holds the $4 level since the start of February, an area of resistance last November.
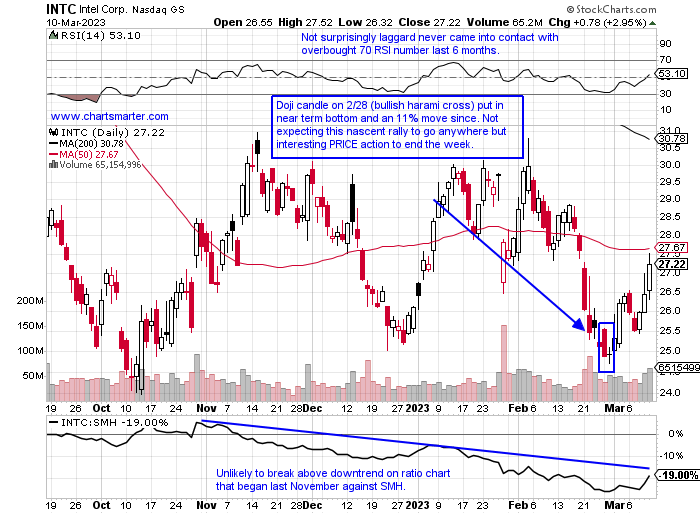
Unlikely Outlier:
- In tumultuous times stock market participants tend to cling to a more defensive posture. That need is often fulfilled with mature, defensive, dividend-paying names. Technology is not often thought of that way but there are a few "old tech" areas that may be attractive to some. Not for me, but it was interesting how a questionable play like INTC performed well last week. This name is still a huge laggard off 48% from most recent 52-week highs and that is even with the impressive move in the last couple of weeks. It has demonstrated legitimate relative strength versus its peers as the week ending 3/3 it rose 5%, nearly doubling the gain of the SMH's 2.8%. But last week was more imposing up 3.1% as the SMH fell by 3%. Last month it cut its dividend by 2/3rds and perhaps shareholders are cheering the move. Others that may be worth a look are IBM, yielding better than 5%, as it is forming a bullish falling wedge, but it needs some bottoming candles to confirm (may need to fill in the gap from the 10/19 session).
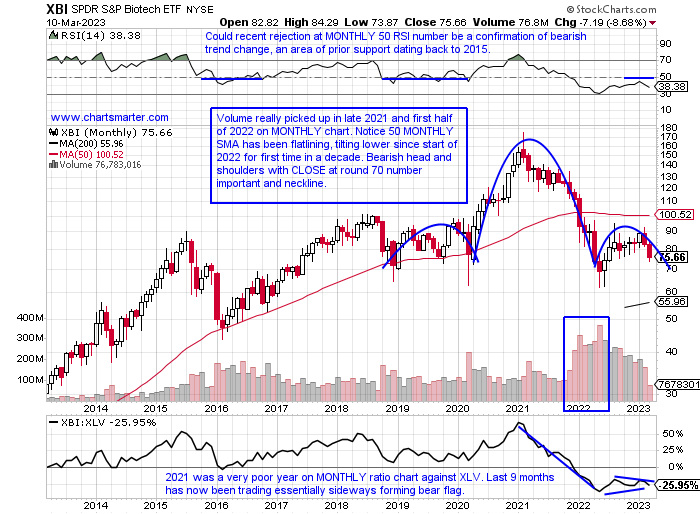
Biotech Waterfall?
- The overall healthcare group has been under assault as of late with the XLV now lower in 12 of the last 14 weeks, with last week falling almost 4% in double average WEEKLY volume, its worst WEEKLY loss since the last week of August 2022. To show that technical analysis is not a panacea the bullish harami cross and dragonfly doji the week ending 3/3 did little to stop the downtrend. Looking at the MONTHLY chart of the XBI it is forming a dubious head and shoulders pattern and is approaching the neckline at the round 70 number. Looking back four months since late 2018 were below the 70 figure intramonth, December 2018, March 2020, and May-June 2022, with only one CLOSE below it in May 2022. A CLOSE below 70 going forward could see a cascade lower. Three of the last 5 weeks CLOSED hard upon their lows for the WEEKLY range down 5, 6, and 9% respectively. I still think some names offer good risk/reward here including AMGN as it fills in the gap here from the 10/10/22 session. Let's take a look at an attractive mid-cap below in APLS.
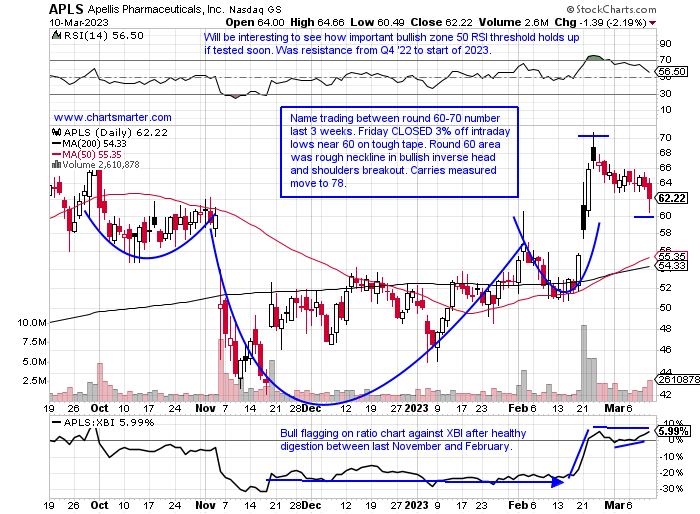
Apellis Pharmaceuticals:
- Biopharma play up 20% YTD and 34% over last one year period.
- Name 12% off most recent 52-week highs and on the WEEKLY chart if it can get above 70, a hindrance since summer 2021, would be a breakout above ascending triangle with a measured move to 112.
- Earnings reactions mostly lower off 16, 1.6, and 8.7% on 11/4, 8/8, and 5/6/22 before gaining of 5.4% on 2/1.
- Enter on pullback into round number range.
- Entry APLS 61.25. Stop 55.
Good luck.