“All great investments begin in discomfort. One thing we know is that there’s great discomfort today.” Howard Marks
Going It Alone:
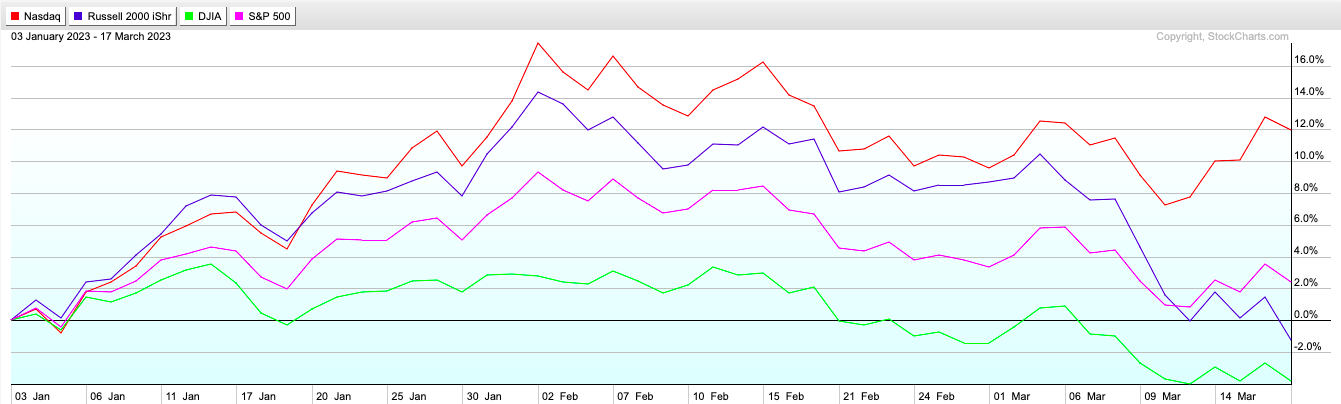
- The Nasdaq's relative strength is eye-opening against the major benchmarks, which in itself is a good thing, but can it really do all the heavy lifting? Below one can see the sizable differences as it is now higher by double digits again YTD after a powerful last week rallying more than 4%. The tech-heavy index is the only one of the quartet above its January highs, and the Russell 2000 and Dow Jones Industrials are now negative for 2023. The latter of course is outdated with just 4 of the 30 names in the PRICE weighted average true industrial names in BA CAT HON and MMM. Many will say that the "rolling" bull market is healthy as different sectors take their turn demonstrating leadership, (not too long ago we were speaking about just how firm the industrials were acting). Currently, nothing is "rolling" anymore, and in fact, on a one-month look back period the XLK is the only one of the major 11 S&P sectors in the green. This to me speaks of others needing to pitch in, because eventually, they come for all the groups. Tech is giving others a chance to catch their breath. Will they take that opportunity and recharge?
No Communication Issues:
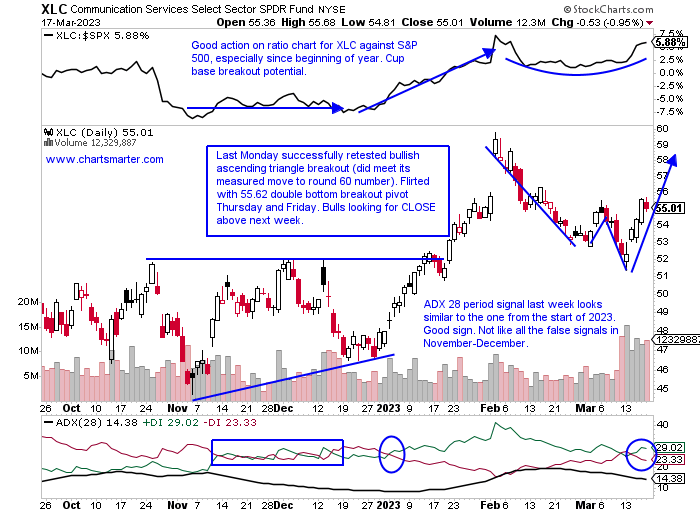
- Last week the communication services group gave technology a run for its money up better than 5%, the second-best actor of 11 (curiously utilities took the bronze as investors are betting interest rates are heading lower). Some will opine that we are going back to a former regime of mega-cap tech dominance. META jumped 9% last week and has now recorded a similar run from the very round par number to 200, much like TSLA did before it stalled out. Could that be in store for Facebook too? Three other names in the internet subsector within the XLC demonstrated brute force last week with GOOGL DASH and BIDU all recording double-digit WEEKLY advances. The problem with Google and Doordash is they are still well off their most recent 52-week highs. Baidu sports a 154.76 double-bottom pivot which is still a few percent from current PRICES. SPOT looks attractive as it bull flags here and if BEKE can get above the very round 20 number it could fly. Stocks within that have not kept pace in 2023 should be avoided which include MTCH GDDY and ZD all negative in 2023 thus far.
Offsides?
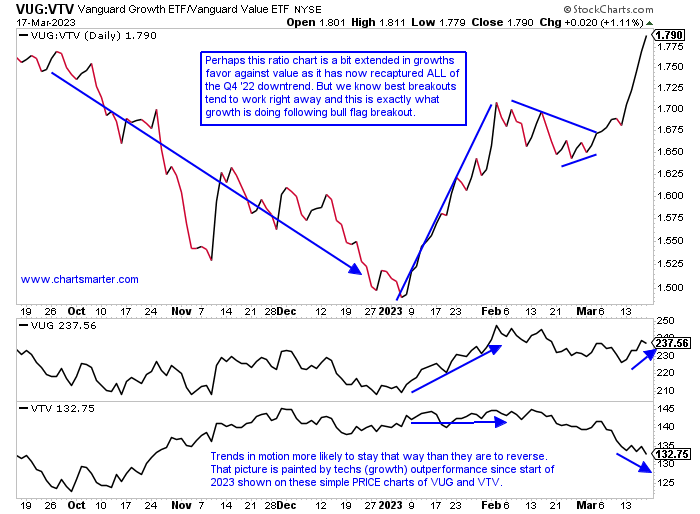
- Unless one has been hiding under a rock since the beginning of 2023 they are well aware of technologies outperformance. This is best visualized by the ratio chart below comparing the VUG to the VTV. Peeking at the holdings in the VUG I was surprised to see all major 11 S&P sectors represented (of course staples, energy, and utilities were each less than 2% of the fund). But technology is nearly half of ETF at more than 46%. And the second largest is consumer discretionary, and we know that TSLA and AMZN (the 3rd and 4th largest holdings in the VUG) are classified as discretionary, but we all know they are really technology. Looking at the composition in the VTV the heaviest weighting is the financials at more than 20%, so perhaps this is a perfect storm for this ratio chart but also highlights just how many professional investors have been caught offside. With banks in freefall, and unlikely to see a V-shaped recovery this uptrend in VUG's favor could just be getting started. Notable is the top heavy VUG with AAPL and MSFT, the top 2 holdings and only $2T companies on the planet, comprise 1/4 of the fund, while the VTVs top 10 holdings make up about the same 25%. Concentration pays when one is right.
Consensus Is Usually Correct:
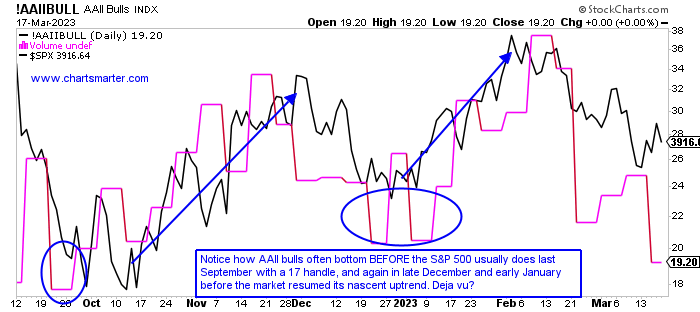
- As much as we hear that contrarian trading is the way to invest (people tend to have a fondness for complexity), the daily chart of one sentiment indicator below dispels that fact. I was surprised to see how the market, S&P 500, has responded to the AAII bulls survey with a strong correlation. This past week, however, was a divergence as the S&P 500 rose 1.4% as bullish market participants fell below the very round 20 number, and to its lowest level of 2023 thus far. The S&P 500 has responded well to moves near or below that 20 figure as seen last fall and again to start this year, as we know January was was of the best starts for many years. PRICE is omnipotent to every indicator in my book and I thought it was interesting that the S&P 500 did NOT make a lower low as the AAII Bulls Index did last week. Truth be told if one was to take a look at the MONTHLY chart the visual would be totally different, but as markets currently seem to be gyrating violently on a daily basis I thought this chart was compelling.
Intense Bifurcation:
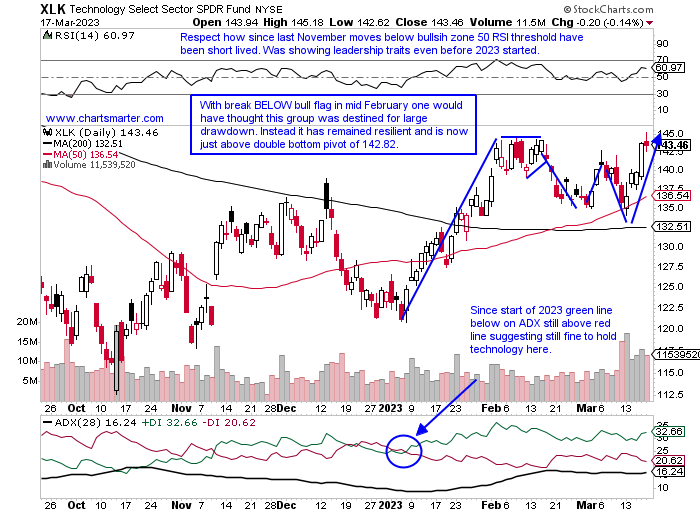
- Energy bulls hanging on to recency bias after two very strong back-to-back years are burning a hole in their portfolio. The XLE slumped almost 7% last week and the financials fell 6%. Hisssssssssss. Can you hear that? That is the air coming out of the balloon and we all are aware that the air comes out much quicker than it went in. Take heed energy bulls. At the top of the major S&P sector leaderboard was technology, as the XLK rose almost 6%. MSFT, which roared higher by 12% last week crossed back above the $2T market cap threshold (only it on AAPL can claim that status). The forking of the major groups exists on a YTD basis as well and after almost Q1 being in the books the only 3 sectors in the green thus far in 2023 are tech, communication services, and consumer discretionary, and in that order. If you are a bull on growth one would take that given the weakness in 2022 displayed by the XLK. Let's take a look at a couple of names that still look like they have gas in the tank below in AAPL and PINS.
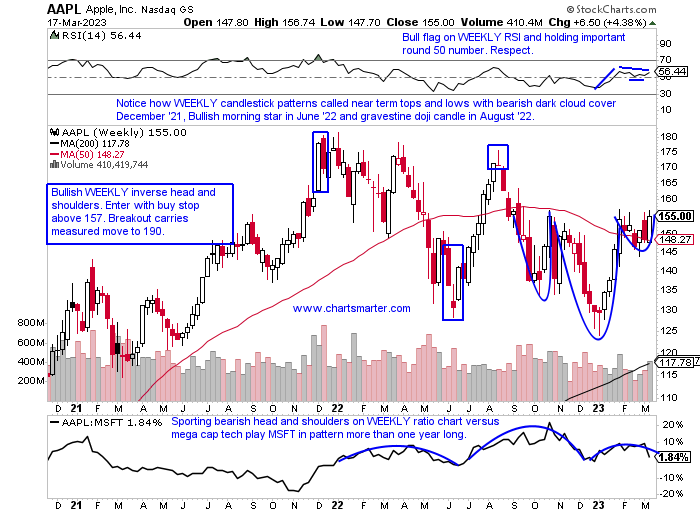
Apple:
- Tech behemoth up 20% YTD and lower by 3% over last one year period. Dividend yield of .6%.
- Name 14% off most recent 52-week highs and advanced 7 of last 10 weeks following back-to-back WEEKLY bullish hammer candles weeks ending between 12/30/22-1/6.
- Three straight positive earnings reactions up 2.4, 7.6, and 3.3% on 2/3, 10/28, and 7/29/22 after loss of 3.7% on 4/29/22.
- Enter with buy stop above bullish WEEKLY inverse head and shoulders pattern.
- Entry AAPL 157. Stop 149.
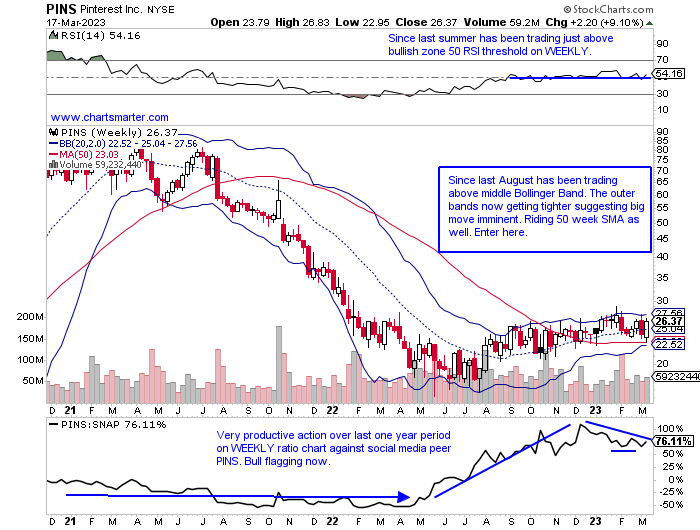
Pinterest:
- Social media name up 9% YTD and 6% over last one year period.
- Name 10% off most recent 52-week highs and rose more than 9% last week besting social media peers META and SNAP which rose 9 and 3% respectively. Daily chart sporting add-on double bottom pivot of 27.65.
- Earnings reactions mostly higher up 13.7, 11.6, and 13.5% on 10/28, 8/2, and 4/28/22 before recent loss of 5.2% on 2/7.
- Enter after successful 50 WEEK SMA retest.
- Entry PINS here. Stop 24.50.
Good luck.
This article requires a Chartsmarter membership. Please click here to join.
“All great investments begin in discomfort. One thing we know is that there’s great discomfort today.” Howard Marks
Going It Alone:
- The Nasdaq's relative strength is eye-opening against the major benchmarks, which in itself is a good thing, but can it really do all the heavy lifting? Below one can see the sizable differences as it is now higher by double digits again YTD after a powerful last week rallying more than 4%. The tech-heavy index is the only one of the quartet above its January highs, and the Russell 2000 and Dow Jones Industrials are now negative for 2023. The latter of course is outdated with just 4 of the 30 names in the PRICE weighted average true industrial names in BA CAT HON and MMM. Many will say that the "rolling" bull market is healthy as different sectors take their turn demonstrating leadership, (not too long ago we were speaking about just how firm the industrials were acting). Currently, nothing is "rolling" anymore, and in fact, on a one-month look back period the XLK is the only one of the major 11 S&P sectors in the green. This to me speaks of others needing to pitch in, because eventually, they come for all the groups. Tech is giving others a chance to catch their breath. Will they take that opportunity and recharge?
No Communication Issues:
- Last week the communication services group gave technology a run for its money up better than 5%, the second-best actor of 11 (curiously utilities took the bronze as investors are betting interest rates are heading lower). Some will opine that we are going back to a former regime of mega-cap tech dominance. META jumped 9% last week and has now recorded a similar run from the very round par number to 200, much like TSLA did before it stalled out. Could that be in store for Facebook too? Three other names in the internet subsector within the XLC demonstrated brute force last week with GOOGL DASH and BIDU all recording double-digit WEEKLY advances. The problem with Google and Doordash is they are still well off their most recent 52-week highs. Baidu sports a 154.76 double-bottom pivot which is still a few percent from current PRICES. SPOT looks attractive as it bull flags here and if BEKE can get above the very round 20 number it could fly. Stocks within that have not kept pace in 2023 should be avoided which include MTCH GDDY and ZD all negative in 2023 thus far.
Offsides?
- Unless one has been hiding under a rock since the beginning of 2023 they are well aware of technologies outperformance. This is best visualized by the ratio chart below comparing the VUG to the VTV. Peeking at the holdings in the VUG I was surprised to see all major 11 S&P sectors represented (of course staples, energy, and utilities were each less than 2% of the fund). But technology is nearly half of ETF at more than 46%. And the second largest is consumer discretionary, and we know that TSLA and AMZN (the 3rd and 4th largest holdings in the VUG) are classified as discretionary, but we all know they are really technology. Looking at the composition in the VTV the heaviest weighting is the financials at more than 20%, so perhaps this is a perfect storm for this ratio chart but also highlights just how many professional investors have been caught offside. With banks in freefall, and unlikely to see a V-shaped recovery this uptrend in VUG's favor could just be getting started. Notable is the top heavy VUG with AAPL and MSFT, the top 2 holdings and only $2T companies on the planet, comprise 1/4 of the fund, while the VTVs top 10 holdings make up about the same 25%. Concentration pays when one is right.
Consensus Is Usually Correct:
- As much as we hear that contrarian trading is the way to invest (people tend to have a fondness for complexity), the daily chart of one sentiment indicator below dispels that fact. I was surprised to see how the market, S&P 500, has responded to the AAII bulls survey with a strong correlation. This past week, however, was a divergence as the S&P 500 rose 1.4% as bullish market participants fell below the very round 20 number, and to its lowest level of 2023 thus far. The S&P 500 has responded well to moves near or below that 20 figure as seen last fall and again to start this year, as we know January was was of the best starts for many years. PRICE is omnipotent to every indicator in my book and I thought it was interesting that the S&P 500 did NOT make a lower low as the AAII Bulls Index did last week. Truth be told if one was to take a look at the MONTHLY chart the visual would be totally different, but as markets currently seem to be gyrating violently on a daily basis I thought this chart was compelling.
Intense Bifurcation:
- Energy bulls hanging on to recency bias after two very strong back-to-back years are burning a hole in their portfolio. The XLE slumped almost 7% last week and the financials fell 6%. Hisssssssssss. Can you hear that? That is the air coming out of the balloon and we all are aware that the air comes out much quicker than it went in. Take heed energy bulls. At the top of the major S&P sector leaderboard was technology, as the XLK rose almost 6%. MSFT, which roared higher by 12% last week crossed back above the $2T market cap threshold (only it on AAPL can claim that status). The forking of the major groups exists on a YTD basis as well and after almost Q1 being in the books the only 3 sectors in the green thus far in 2023 are tech, communication services, and consumer discretionary, and in that order. If you are a bull on growth one would take that given the weakness in 2022 displayed by the XLK. Let's take a look at a couple of names that still look like they have gas in the tank below in AAPL and PINS.
Apple:
- Tech behemoth up 20% YTD and lower by 3% over last one year period. Dividend yield of .6%.
- Name 14% off most recent 52-week highs and advanced 7 of last 10 weeks following back-to-back WEEKLY bullish hammer candles weeks ending between 12/30/22-1/6.
- Three straight positive earnings reactions up 2.4, 7.6, and 3.3% on 2/3, 10/28, and 7/29/22 after loss of 3.7% on 4/29/22.
- Enter with buy stop above bullish WEEKLY inverse head and shoulders pattern.
- Entry AAPL 157. Stop 149.
Pinterest:
- Social media name up 9% YTD and 6% over last one year period.
- Name 10% off most recent 52-week highs and rose more than 9% last week besting social media peers META and SNAP which rose 9 and 3% respectively. Daily chart sporting add-on double bottom pivot of 27.65.
- Earnings reactions mostly higher up 13.7, 11.6, and 13.5% on 10/28, 8/2, and 4/28/22 before recent loss of 5.2% on 2/7.
- Enter after successful 50 WEEK SMA retest.
- Entry PINS here. Stop 24.50.
Good luck.