"The master knows exactly the right moment to do nothing." -Unknown
Small-Cap Smackdown?
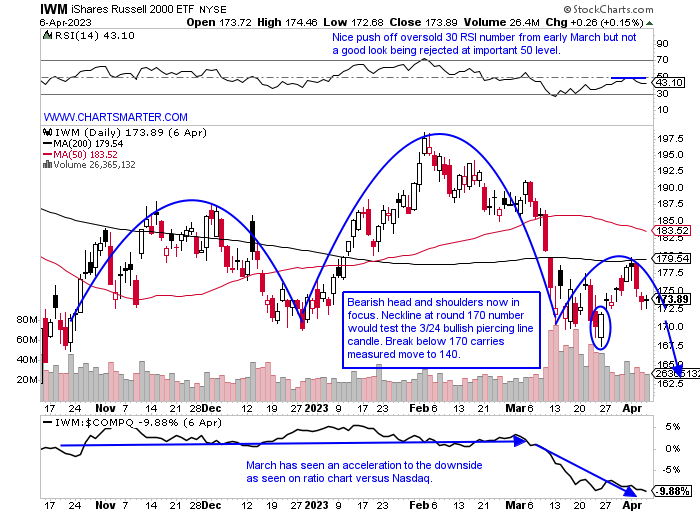
- If conventional wisdom regarding that small caps are a good forward-looking indicator is true, sanguine feelings should be kept on hold. But truth be told overall markets have been shrugging off the wayward ways of the Russell 2000 which is now down 1% YTD whereas the Nasdaq has advanced 15%, the S&P 500 by 7%, and the Dow 1%. Of course, a big weighting in the small-cap benchmark is the financials that have been under severe pressure. At the moment, however, there are three larger sector weightings all at nearly 15% in healthcare, industrials, and technology. Its chart below shows a gravitational pull toward a 170 pivot in a bearish head and shoulders pattern (remember the XBI still has that MONTHLY one at the round 70 figure). The IWM did make a nice stick save on 3/24 with the piercing line candle, but if that is negated it could be a long summer for small-cap bulls. Will the other major averages be able to withstand their strength in the wake of a possible persistent drawdown?
Bitcoin Coiling:
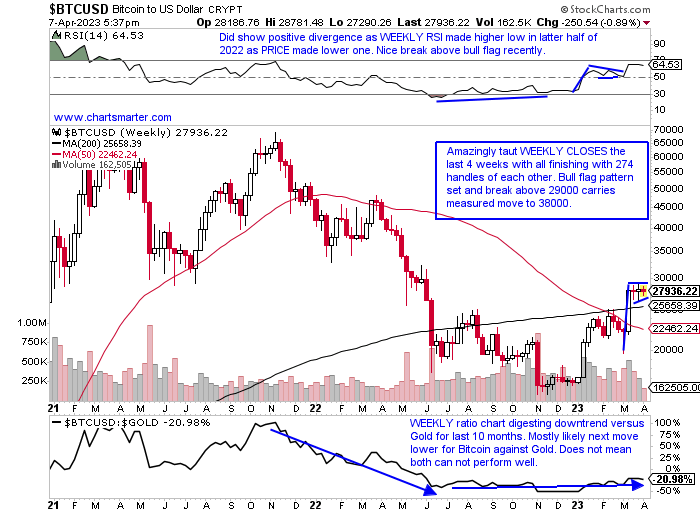
- There have been some impressive moves inside asset classes recently, notably Gold. The glittery metal broke above the very round 2000 number within a bull flag and should see a measured move toward 2200 in the near term. It is stalling a bit and recorded a spinning top candle Wednesday. Could another asset class be ready to follow in Gold's footsteps and take out a bull flag of its own? The chart below of Bitcoin suggests this could be so. The last 4 weeks have all CLOSED very tight, and the last 3 after a very robust move of 6000 handles higher the week ending 3/17. And that was preceded the week prior with a bullish WEEKLY hammer candle off the very round 20000 number. The last 3 weeks have recorded spinning top candles which often suggest fatigue in the underlying direction. But this can be overlooked with PRICE confirmation above 29000 flag pivot after great digestion of that big move. It could also give some "risk-on" flavor to the overall market.
Land Of The Rising Sun:
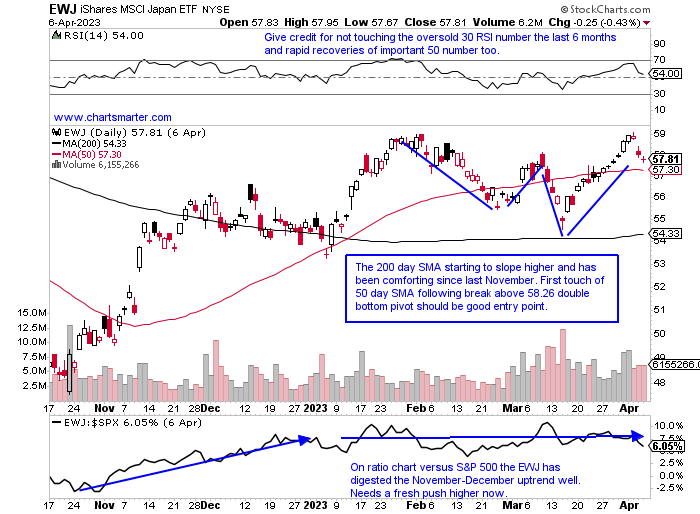
- An argument could be made that one could have said "land of the rising stock market" too. Japan has been coming to life recently and the chart below of the EWJ can attest to that. The ETF did drop the final 3 days last week after a bearish harmai candle was completed Monday. TM is the largest holding in the fund and perhaps it should be peer HMC which is currently 5% off most recent 52-week highs while Toyota is 22% off its own annual peak. SONY, the second largest holding, is acting well and Monday will complete a handle on its cup base with a pivot of .91.48. If one is looking at the region for a name that is acting well domestically in healthcare TAK may fit the bill (pays a dividend yield north of 6%). Thursday it broke above a bull flag pivot of 16.50 on big volume, and since the last week of October on a WEEKLY basis has declined just 7 times. For those seeking an "old tech" play, PCRFY is setting up for a possible break above a bullish ascending triangle trigger of 9.50. The only caveat is the news that Ken Griffin and Steve Cohen are building their offices in the country.
Bullish Stampede:
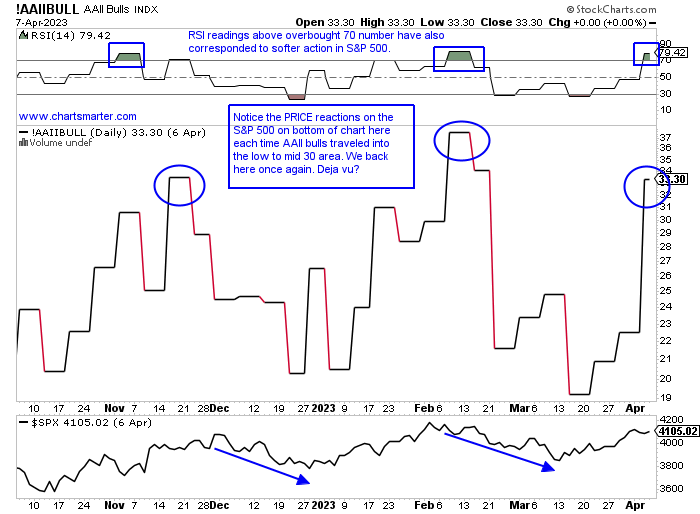
- In our last WEEK AHEAD Note we mentioned how bullish market participants were at nonexistent levels near the very round 20 figure. I put the chart of the S&P 500 on the bottom of the chart as each time it touched the 20 area in mid-October, the start of 2023, and mid-March PRICE responded very positively. Conversely when it touched the low to mid-30 range markets tended to be soft, most notably last December and this February. Notice that bulls are back above 33, and if recent history is any lesson, the S&P 500 could be ready for a soft patch. The gyrations on the chart below tend to move quickly and show just how finicky investor sentiment can become as herd mentality takes hold. Remember this indicator and all others react to PRICE, so it's best to follow PRICE intently.
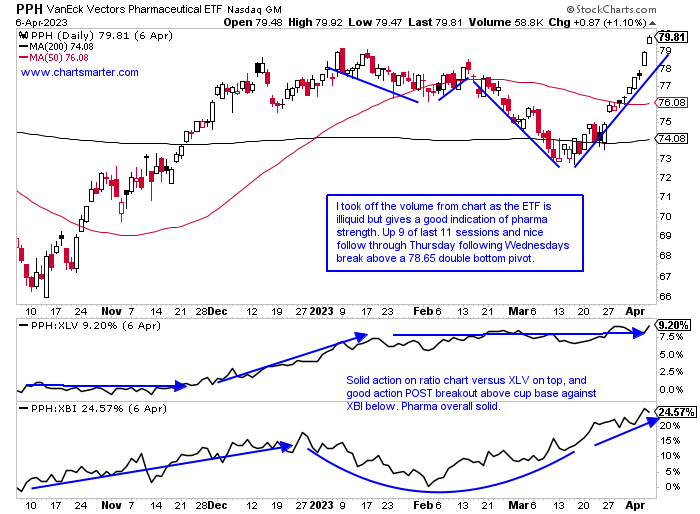
Healthcare Hopping:
- Healthcare flexed its muscles last week with the XLV being the best major S&P sector higher by more than 4% (on a YTD basis it is still in the red and the 9th best of 11). Responsible for much of the nascent strength is the pharmaceuticals. The PPH is just 5% off the most recent 52-week highs, but that is a bit deceptive as Friday CLOSED at its highest level in 2023. The XBI is 17% off its peak this year so far, and the more conservative biotech fund in the IBB is 5.2% off its peak. The momentum in PPH is superior and that can be seen with its 75 RSI, while the IBB and XBI are at 60 and 47% respectively. Handsome WEEKLY gains from top 5 holdings in LLY JNJ and MRK rose 8.1, 7.6, and 6% keeping the PPH at a high altitude. Let's take a look at a couple of names below, one in PFE which has not yet received the pharma rally memo, and a small-cap generic play with which many are not likely familiar in HROW.
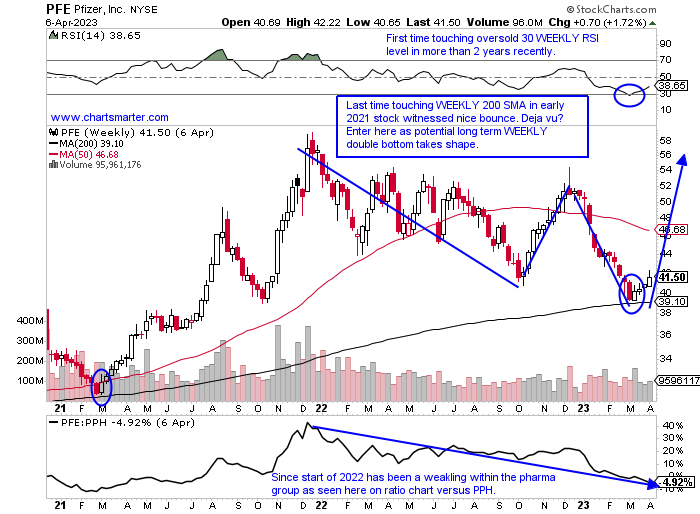
Pfizer:
- Pharma laggard down 19% YTD and 22% over last one year period. Dividend yield of 3.9%.
- Name 26% off most recent 52-week highs and first 4-week win streak in 2023. The round 40 number has rough relevance as resistance dating back to late 2018
- Earnings reactions mostly higher up 1.4, 3.1, and 2% on 1/31, 11/1, and 5/3/22, and fell 1.6% on 7/28/22.
- Enter after rare touch of WEEKLY 200 SMA.
- Entry PFE here. Stop 38.
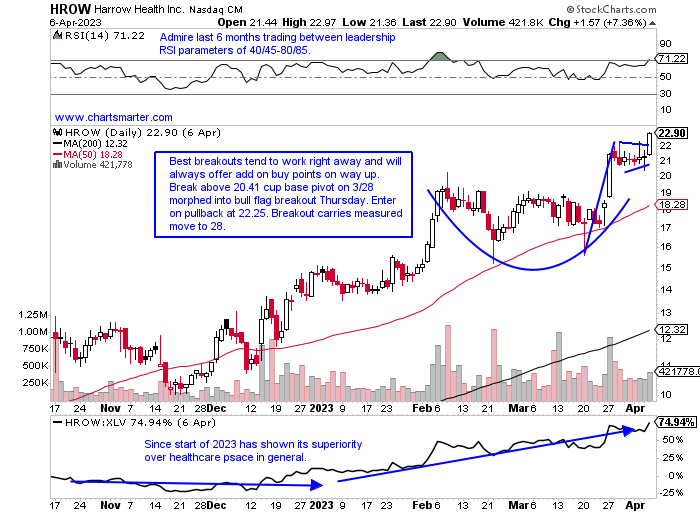
Harrow Health:
- Generic play up 55% YTD and 226% over last one-year period.
- Name at 52-week highs and great volume trends with the last week of distribution the week ending 5/13/22. The group acting well with big cup base breakout in RDY, and AMPH taking out a bull flag.
- Earnings reactions mostly higher up 6.8, 9.9, and 6.4% on 3/24, 8/10, and 5/6/22, and fell 4.6% on 11/15/22.
- Enter on pullback into bull flag breakout.
- Entry HROW 22.25. Stop 20.50.
Good luck.
This article requires a Chartsmarter membership. Please click here to join.
"The master knows exactly the right moment to do nothing." -Unknown
Small-Cap Smackdown?
- If conventional wisdom regarding that small caps are a good forward-looking indicator is true, sanguine feelings should be kept on hold. But truth be told overall markets have been shrugging off the wayward ways of the Russell 2000 which is now down 1% YTD whereas the Nasdaq has advanced 15%, the S&P 500 by 7%, and the Dow 1%. Of course, a big weighting in the small-cap benchmark is the financials that have been under severe pressure. At the moment, however, there are three larger sector weightings all at nearly 15% in healthcare, industrials, and technology. Its chart below shows a gravitational pull toward a 170 pivot in a bearish head and shoulders pattern (remember the XBI still has that MONTHLY one at the round 70 figure). The IWM did make a nice stick save on 3/24 with the piercing line candle, but if that is negated it could be a long summer for small-cap bulls. Will the other major averages be able to withstand their strength in the wake of a possible persistent drawdown?
Bitcoin Coiling:
- There have been some impressive moves inside asset classes recently, notably Gold. The glittery metal broke above the very round 2000 number within a bull flag and should see a measured move toward 2200 in the near term. It is stalling a bit and recorded a spinning top candle Wednesday. Could another asset class be ready to follow in Gold's footsteps and take out a bull flag of its own? The chart below of Bitcoin suggests this could be so. The last 4 weeks have all CLOSED very tight, and the last 3 after a very robust move of 6000 handles higher the week ending 3/17. And that was preceded the week prior with a bullish WEEKLY hammer candle off the very round 20000 number. The last 3 weeks have recorded spinning top candles which often suggest fatigue in the underlying direction. But this can be overlooked with PRICE confirmation above 29000 flag pivot after great digestion of that big move. It could also give some "risk-on" flavor to the overall market.
Land Of The Rising Sun:
- An argument could be made that one could have said "land of the rising stock market" too. Japan has been coming to life recently and the chart below of the EWJ can attest to that. The ETF did drop the final 3 days last week after a bearish harmai candle was completed Monday. TM is the largest holding in the fund and perhaps it should be peer HMC which is currently 5% off most recent 52-week highs while Toyota is 22% off its own annual peak. SONY, the second largest holding, is acting well and Monday will complete a handle on its cup base with a pivot of .91.48. If one is looking at the region for a name that is acting well domestically in healthcare TAK may fit the bill (pays a dividend yield north of 6%). Thursday it broke above a bull flag pivot of 16.50 on big volume, and since the last week of October on a WEEKLY basis has declined just 7 times. For those seeking an "old tech" play, PCRFY is setting up for a possible break above a bullish ascending triangle trigger of 9.50. The only caveat is the news that Ken Griffin and Steve Cohen are building their offices in the country.
Bullish Stampede:
- In our last WEEK AHEAD Note we mentioned how bullish market participants were at nonexistent levels near the very round 20 figure. I put the chart of the S&P 500 on the bottom of the chart as each time it touched the 20 area in mid-October, the start of 2023, and mid-March PRICE responded very positively. Conversely when it touched the low to mid-30 range markets tended to be soft, most notably last December and this February. Notice that bulls are back above 33, and if recent history is any lesson, the S&P 500 could be ready for a soft patch. The gyrations on the chart below tend to move quickly and show just how finicky investor sentiment can become as herd mentality takes hold. Remember this indicator and all others react to PRICE, so it's best to follow PRICE intently.
Healthcare Hopping:
- Healthcare flexed its muscles last week with the XLV being the best major S&P sector higher by more than 4% (on a YTD basis it is still in the red and the 9th best of 11). Responsible for much of the nascent strength is the pharmaceuticals. The PPH is just 5% off the most recent 52-week highs, but that is a bit deceptive as Friday CLOSED at its highest level in 2023. The XBI is 17% off its peak this year so far, and the more conservative biotech fund in the IBB is 5.2% off its peak. The momentum in PPH is superior and that can be seen with its 75 RSI, while the IBB and XBI are at 60 and 47% respectively. Handsome WEEKLY gains from top 5 holdings in LLY JNJ and MRK rose 8.1, 7.6, and 6% keeping the PPH at a high altitude. Let's take a look at a couple of names below, one in PFE which has not yet received the pharma rally memo, and a small-cap generic play with which many are not likely familiar in HROW.
Pfizer:
- Pharma laggard down 19% YTD and 22% over last one year period. Dividend yield of 3.9%.
- Name 26% off most recent 52-week highs and first 4-week win streak in 2023. The round 40 number has rough relevance as resistance dating back to late 2018
- Earnings reactions mostly higher up 1.4, 3.1, and 2% on 1/31, 11/1, and 5/3/22, and fell 1.6% on 7/28/22.
- Enter after rare touch of WEEKLY 200 SMA.
- Entry PFE here. Stop 38.
Harrow Health:
- Generic play up 55% YTD and 226% over last one-year period.
- Name at 52-week highs and great volume trends with the last week of distribution the week ending 5/13/22. The group acting well with big cup base breakout in RDY, and AMPH taking out a bull flag.
- Earnings reactions mostly higher up 6.8, 9.9, and 6.4% on 3/24, 8/10, and 5/6/22, and fell 4.6% on 11/15/22.
- Enter on pullback into bull flag breakout.
- Entry HROW 22.25. Stop 20.50.
Good luck.