Earnings Branching:
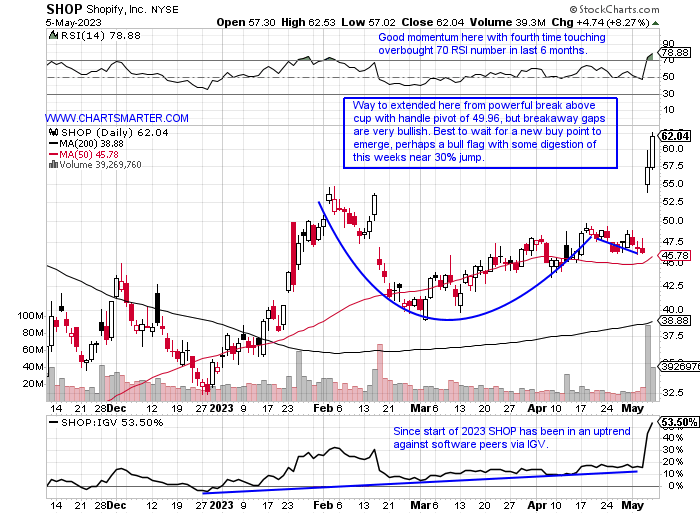
- Unless you were a technology mega-cap play, earnings reactions have been on the wobbly side. Perhaps AMZN was an exception there even though it did have a very robust initial after-hours reaction. AAPL Friday was a good example rising by 5%, but one can include MSFT up more than 7% on 4/26. Or a META which recorded its second straight double-digit advance after reporting on 4/27 rising 14%. On the flip side "smaller" names such as NET PINS or SNAP each cratered lower after reporting numbers during the last couple of weeks by 21, 16, and 17% respectively. Give some names credit though that were not giants like a DDOG which added almost 15% Thursday but that name is still almost 40% off most recent 52-week highs and even more since a reversal at the very round 200 number in November 2021. Compare this to SHOP which trades at 52-week highs and jumped 29% this week and is above both of its key moving averages. This is a name to keep a close eye on going forward in the near term.
Leadership Indication:
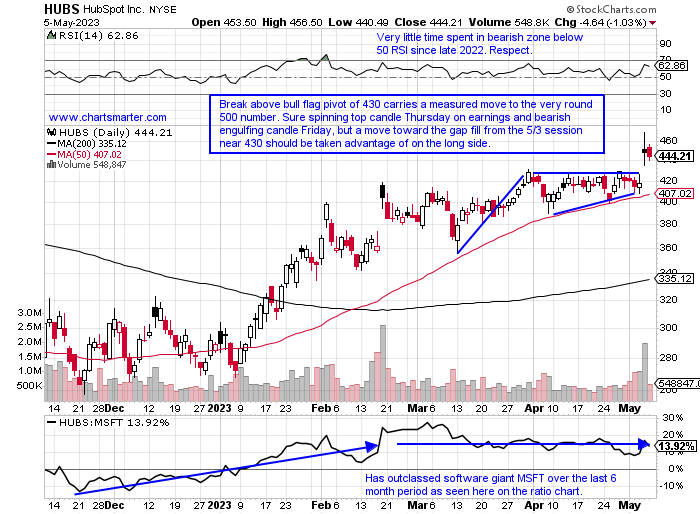
- They say in bear markets "they eventually get to everything", and I have always been conflicted holding names that hold up well in the face of a very soft overall tape because of it. MBLY happened to be one of them. I still remember its 7% gain on 4/18 as the SMH was UNCH and they snuffed that one out on its latest earnings reaction. Below is the chart of HUBS and this to me will give valuable clues going forward. It has been a stalwart in the software space and for me, if this one gets taken down below the very round 400 number anytime in the near term I would say that the nascent tech bull that began last October is kaput. On Thursday it recorded its EIGHT consecutive positive earnings reaction, and amazingly 14 of the last 15, rising more than 7%. Sure Friday it did not participate on the firm tape, but YTD is higher by more than 50%, trouncing the average software name in 2023 with the IGV up 14%. This name is the yardstick for me.
Recent Examples:
- The electronics components space has been a soft one with a couple of former leaders now firmly in retreat. JBL is now 13% off most recent 52-week highs and after a spinning top candle on 4/3 right at the very round 90 number it has formed a bear flag as its 50-day SMA has started to curl lower. GLW is now underneath both its 50 and 200-day, SMAs and is 17% from its annual peak and on a 3-week losing streak that has fallen by a combined 10%, and this week displayed weak relative strength off 5.5% as the XLK was flat. Below is another rival in the space with the chart of FLEX and how it appeared in our 4/26 Technology Note. For those looking for names outside the USA, this Singapore play fits the bill. It seems to be finding support at the very round 20 number, and of course, this could be temporary, but this was a former level of pesky resistance. In the bulls defense, the week ending 4/28 also recorded a bullish dragonfly doji candle.

Special Situations:
Fortinet:
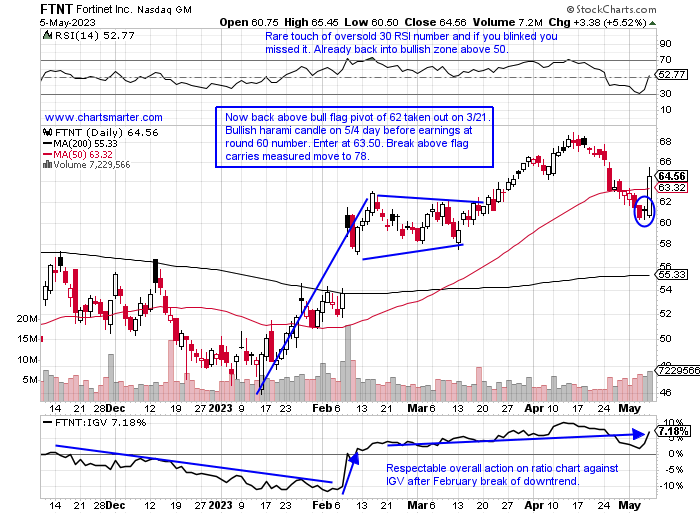
- Software security play up 33% YTD and 22% over last one year period.
- Name 6% off most recent 52-week highs and has been basing for last 1 1/2 years after huge 44 of 61 week win streak weeks ending between 11/6/20-12/30/21. Add on above WEEKLY cup with handle pivot of 69.17.
- Earnings mixed up 5.6 and 10.9% on 5/5 and 2/8 and fell 13.7 and 16.3% on 11/3 and 8/4/22.
- Enter after reclaim of bull flag breakout.
- Entry FTNT 63.50. Stop 59.25.
Applied Materials:
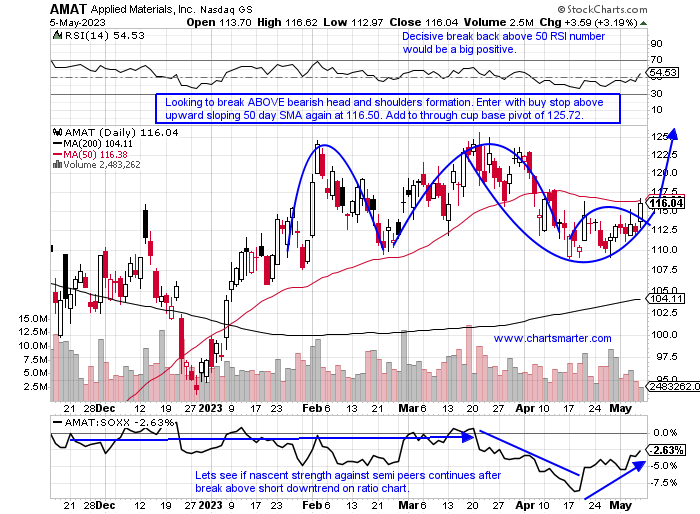
- Semi equipment maker up 20% YTD and 3% over last one year period. Dividend yield of 1.1%.
- Name 8% off most recent 52-week highs and on WEEKLY chart nice support at round 110 number, which happened to be resistance last summer and fall several times.
- Back-to-back positive earnings reactions up .1 and .2% on 2/17 and 11/18/22 after the prior 6 all declined.
- Enter with buy stop above 50-day SMA.
- Entry AMAT 116.50. Stop 111.75.
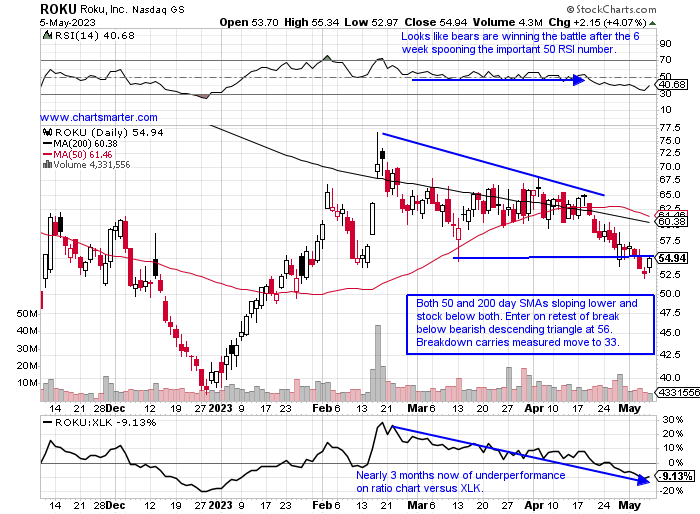
Roku:
- Communication services play up 35% YTD and lower by 43% over last one-year period.
- Name 48% off most recent 52-week highs and now down 5 weeks in a row. This is despite good accumulation weeks ending 2/17 and 3/17 which advanced 30.3 and 9.7% on the largest WEEKLY volume in the last 6 months.
- Earnings reactions mixed up .8 and 11.1% on 4/27 and 2/16 and fell 4.6 and 23.1% on 11/3 and 7/29/22.
- Enter short on retest of bearish descending triangle breakdown.
- Entry ROKU 56. Buy stop 61.
Good luck.
Entry summaries:
Buy after reclaim of bull flag breakout FTNT 63.50. Stop 59.25.
Buy stop above 50-day SMA AMAT 116.50. Stop 111.75.
Short on retest of bearish descending triangle breakdown ROKU 56. Buy stop 61.
This article requires a Chartsmarter membership. Please click here to join.
Earnings Branching:
- Unless you were a technology mega-cap play, earnings reactions have been on the wobbly side. Perhaps AMZN was an exception there even though it did have a very robust initial after-hours reaction. AAPL Friday was a good example rising by 5%, but one can include MSFT up more than 7% on 4/26. Or a META which recorded its second straight double-digit advance after reporting on 4/27 rising 14%. On the flip side "smaller" names such as NET PINS or SNAP each cratered lower after reporting numbers during the last couple of weeks by 21, 16, and 17% respectively. Give some names credit though that were not giants like a DDOG which added almost 15% Thursday but that name is still almost 40% off most recent 52-week highs and even more since a reversal at the very round 200 number in November 2021. Compare this to SHOP which trades at 52-week highs and jumped 29% this week and is above both of its key moving averages. This is a name to keep a close eye on going forward in the near term.
Leadership Indication:
- They say in bear markets "they eventually get to everything", and I have always been conflicted holding names that hold up well in the face of a very soft overall tape because of it. MBLY happened to be one of them. I still remember its 7% gain on 4/18 as the SMH was UNCH and they snuffed that one out on its latest earnings reaction. Below is the chart of HUBS and this to me will give valuable clues going forward. It has been a stalwart in the software space and for me, if this one gets taken down below the very round 400 number anytime in the near term I would say that the nascent tech bull that began last October is kaput. On Thursday it recorded its EIGHT consecutive positive earnings reaction, and amazingly 14 of the last 15, rising more than 7%. Sure Friday it did not participate on the firm tape, but YTD is higher by more than 50%, trouncing the average software name in 2023 with the IGV up 14%. This name is the yardstick for me.
Recent Examples:
- The electronics components space has been a soft one with a couple of former leaders now firmly in retreat. JBL is now 13% off most recent 52-week highs and after a spinning top candle on 4/3 right at the very round 90 number it has formed a bear flag as its 50-day SMA has started to curl lower. GLW is now underneath both its 50 and 200-day, SMAs and is 17% from its annual peak and on a 3-week losing streak that has fallen by a combined 10%, and this week displayed weak relative strength off 5.5% as the XLK was flat. Below is another rival in the space with the chart of FLEX and how it appeared in our 4/26 Technology Note. For those looking for names outside the USA, this Singapore play fits the bill. It seems to be finding support at the very round 20 number, and of course, this could be temporary, but this was a former level of pesky resistance. In the bulls defense, the week ending 4/28 also recorded a bullish dragonfly doji candle.
Special Situations:
Fortinet:
- Software security play up 33% YTD and 22% over last one year period.
- Name 6% off most recent 52-week highs and has been basing for last 1 1/2 years after huge 44 of 61 week win streak weeks ending between 11/6/20-12/30/21. Add on above WEEKLY cup with handle pivot of 69.17.
- Earnings mixed up 5.6 and 10.9% on 5/5 and 2/8 and fell 13.7 and 16.3% on 11/3 and 8/4/22.
- Enter after reclaim of bull flag breakout.
- Entry FTNT 63.50. Stop 59.25.
Applied Materials:
- Semi equipment maker up 20% YTD and 3% over last one year period. Dividend yield of 1.1%.
- Name 8% off most recent 52-week highs and on WEEKLY chart nice support at round 110 number, which happened to be resistance last summer and fall several times.
- Back-to-back positive earnings reactions up .1 and .2% on 2/17 and 11/18/22 after the prior 6 all declined.
- Enter with buy stop above 50-day SMA.
- Entry AMAT 116.50. Stop 111.75.
Roku:
- Communication services play up 35% YTD and lower by 43% over last one-year period.
- Name 48% off most recent 52-week highs and now down 5 weeks in a row. This is despite good accumulation weeks ending 2/17 and 3/17 which advanced 30.3 and 9.7% on the largest WEEKLY volume in the last 6 months.
- Earnings reactions mixed up .8 and 11.1% on 4/27 and 2/16 and fell 4.6 and 23.1% on 11/3 and 7/29/22.
- Enter short on retest of bearish descending triangle breakdown.
- Entry ROKU 56. Buy stop 61.
Good luck.
Entry summaries:
Buy after reclaim of bull flag breakout FTNT 63.50. Stop 59.25.
Buy stop above 50-day SMA AMAT 116.50. Stop 111.75.
Short on retest of bearish descending triangle breakdown ROKU 56. Buy stop 61.