"The pain of parting is nothing to the joy of meeting again." Charles Dickens
Summer Cooldown:
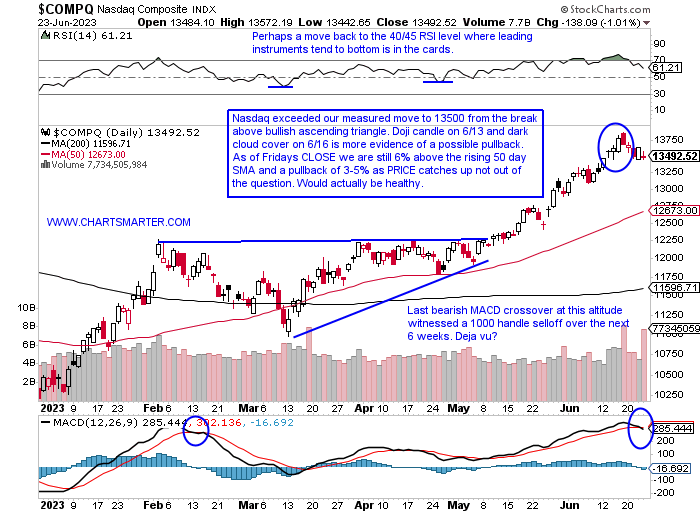
- With 2 days into the new summer season, the Nasdaq may be starting to look for some shade to cool off. With a nearly 30% advance so far with one week left in Q2 it would be well deserved. Perhaps we will see some window dressing next week but technically speaking the dubious candles are starting to add up. I confess there have been more than a few that concerned me recently, and I was WRONG to be cautious a bit early, but nothing goes up in a straight line and eventually, those bearish candles do come home to roost. The SMH never gained traction after its bull flag breakout above a 150 trigger, and the IGV recorded a bearish counterattack candle Monday and followed it up with a doji candle Tuesday. With the Nasdaq and S&P 500 falling 1.4% last week, and the Russell by nearly 3%, AAPL rose 1%. With all the hype surrounding the $3T market cap perhaps that type of headline may also be some sort of near-term top. Is the 2nd largest stock on the planet in MSFT going to be a double top here on the WEEKLY in the 340-350 range from late 2021 or the start of a massive cup base breakout? Bulls are still plentiful with the highest reading among them in the last year recently. Maybe another notch in the hat for the bears salivating for a pullback. They have been parched for a long time.
Yields Coiling:
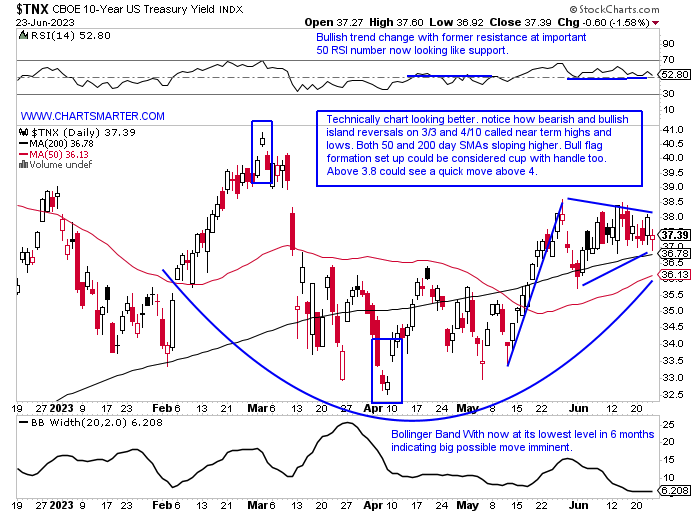
- With all the Fed chatter this past week I feel it is important to look at what the market is actually doing. Below is the chart of the 10-year yield and over the last month's period the chart's complexion has continued to improve. In that time period, it has recaptured both its 50 and 200-day SMAs, with the former starting to curl higher once again. A bull flag has formed as the taut action takes hold, and a break above 3.8% in the near term could see a measured move to 4.25%. On the WEEKLY timeframe it has recorded 5 straight very tight WEEKLY CLOSES, and we know from that type of coiling action often springs powerful moves in the underlying direction. Its WEEKLY chart is ever so slightly distancing itself from the rising 50 WEEK SMA which it has been hugging for the last 3 months. A double bottom base has taken shape with a move above the round 4 number the pivot from the last week in February (which happened to be a WEEKLY doji candle too). Its path to least resistance is higher, which could prove to be a headwind for equities, albeit most likely temporary.
Golden Revival:
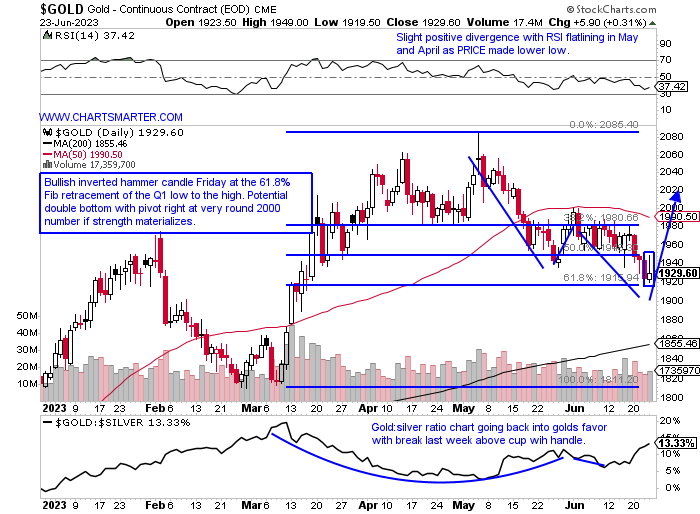
- Can gold bugs rejoice? They may be getting to have their chance in the sun again after the glittery metal's reluctance to feel comfortable above the very round 2000 number. Or at least there is a good risk/reward scenario at current PRICES. Below shows gold starting to act better than silver once again at the bottom of this chart, often something not bullish for the overall stock market. The bullish inverted hammer candle Friday at the 61.8% Fibonacci retracement level is a good start for gold enthusiasts which could start the right side of a possible double bottom base. The potential add-on pivot would be above the very round 2000 figure, which on 6/1-2 proved to be too much to overcome, with the 50-day SMA, which has now begun to slope lower. It is now lower 5 of the last 7 weeks following the WEEKLY bearish shooting star candle from the first week in May, but I think Gold can make a move higher right here and go onto challenge the very round 2000 number.
Beauty Is In The Eye Of The Beholder:
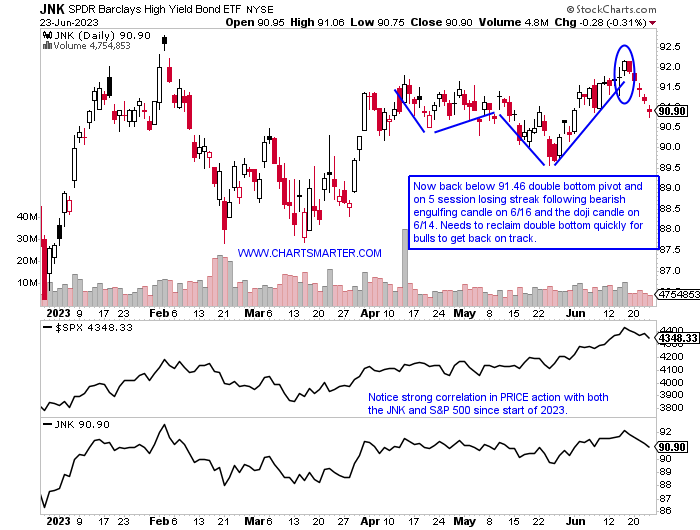
- "Junk" can sometimes be a thing of elegance. It is all in the perception. Market participants feel energized when the chart below of the junk bond ETF is acting well. If investors are betting on risky bonds there is a good chance they are sanguine about stocks prospects. The bottom of the chart below this illustrates this well as it shows that the S&P 500 and the JNK pretty much trade in tandem. Last week the ETF started off with a bearish engulfing candle and ended up falling every day, dropping by 1.1% for the week, its largest WEEKLY loss in the last 3 months. It snapped a 3-week win streak with each of the three weeks seeing increased volume. Wednesday-Friday each produced spinning top candles, failing to stem the decline. The concern here for me is such a quick failure after a promising double bottom breakout, as we know the best ones work right away and continue to do so POST breakout. For more than one year now the 200 WEEK SMA has proven to be a formidable roadblock. A move above 92 in my opinion would signal a rapid move toward par into the second half, but PRICE must confirm.
Healthcare Safety Net:
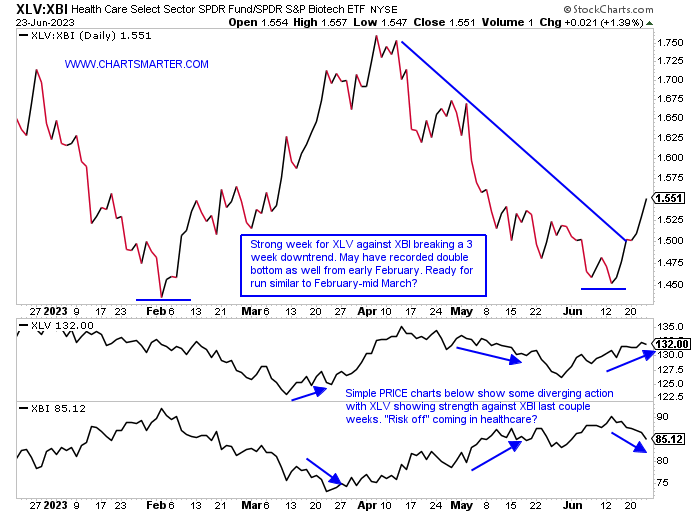
- Did biotech miss out on a golden opportunity for a jump in PRICES this month with the traditional strong seasonality of the last 4 years? The chart here suggests so, with an average 6.7% MONTHLY gain during June, only outdone by a 6.9% advance in November (notice September has not gained ground in 4 consecutive years with an average loss of 4%). So far this June the XBI has gained 1% with one week left. Large biotech names like BIIB may see a bounce in the 280 area near its upward-sloping 200-day SMA, with weakness beginning after the bearish filled-in black candlestick on 6/12 (has declined 7 of the last 8 days). Speaking of the mega-cap healthcare names the XLV (was the only major S&P sector of 11 to gain ground last week) is making a nice move against the XBI as seen on the ratio chart below. They stem mostly from the pharma names like JNJ which is on a 4-week winning streak with each CLOSING at or close to the top of the WEEKLY range. LLY is just 1% off 52-week highs and has risen an incredible 14 of the last 15 weeks. Is this a sign of "risk off" in the space? Let's take a look at two other names in the top 5 holdings in MRK and ABBV below.
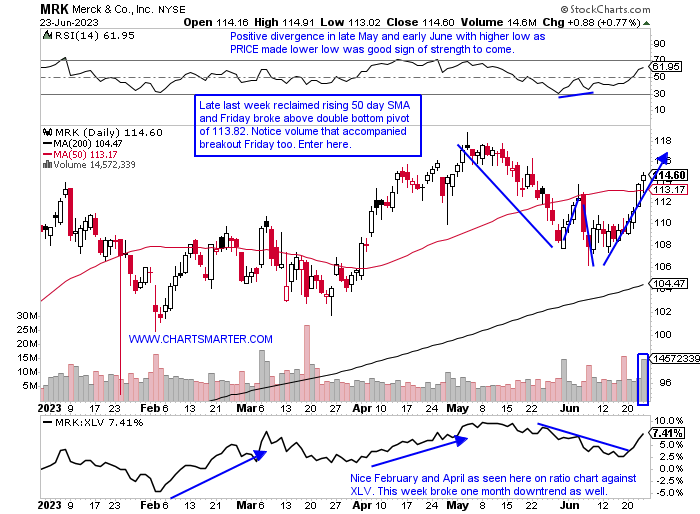
Merck:
- Large-cap pharma play up 3% YTD and 25% over last one-year period. Dividend yield of 2.5%.
- Name 4% off most recent 52-week highs and rose 5% last week, good relative strength as PPH fell .5%. Has declined 5 of last 7 weeks but bears have been limited in the damage they could impair.
- Earnings reactions mixed up 1.5 and 1.4% on 4/27 and 10/27/22 and fell 3.3 and 1.4% on 2/2 and 7/28/22.
- Enter after break above double bottom pivot.
- Entry MRK here. Stop 111.
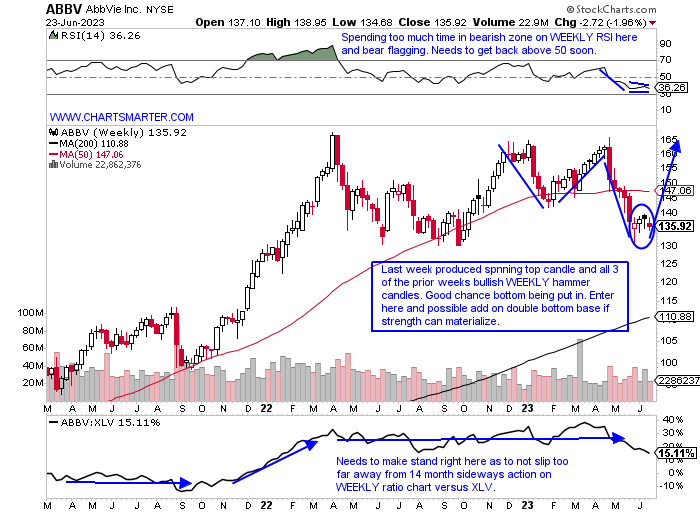
AbbVie:
- Biopharma giant down 16% YTD and 9% over last one year period. Dividend yield of 4.4%.
- Name 19% off most recent 52-week highs and last 4 weeks have produced WEEKLY candles that suggest prior weakness from 5 weeks ending between 4/28-5/26 falling 17% could be waning.
- Earnings reactions mostly lower off 8, 3.8 and 4.2% on 4/27, 10/28, and 7/29/22 and rose 2.8% on 2/9.
- Enter after 4 consecutive WEEKLY bottoming candles.
- Entry ABBV here. Stop 131.
Good luck.
This article requires a Chartsmarter membership. Please click here to join.
"The pain of parting is nothing to the joy of meeting again." Charles Dickens
Summer Cooldown:
- With 2 days into the new summer season, the Nasdaq may be starting to look for some shade to cool off. With a nearly 30% advance so far with one week left in Q2 it would be well deserved. Perhaps we will see some window dressing next week but technically speaking the dubious candles are starting to add up. I confess there have been more than a few that concerned me recently, and I was WRONG to be cautious a bit early, but nothing goes up in a straight line and eventually, those bearish candles do come home to roost. The SMH never gained traction after its bull flag breakout above a 150 trigger, and the IGV recorded a bearish counterattack candle Monday and followed it up with a doji candle Tuesday. With the Nasdaq and S&P 500 falling 1.4% last week, and the Russell by nearly 3%, AAPL rose 1%. With all the hype surrounding the $3T market cap perhaps that type of headline may also be some sort of near-term top. Is the 2nd largest stock on the planet in MSFT going to be a double top here on the WEEKLY in the 340-350 range from late 2021 or the start of a massive cup base breakout? Bulls are still plentiful with the highest reading among them in the last year recently. Maybe another notch in the hat for the bears salivating for a pullback. They have been parched for a long time.
Yields Coiling:
- With all the Fed chatter this past week I feel it is important to look at what the market is actually doing. Below is the chart of the 10-year yield and over the last month's period the chart's complexion has continued to improve. In that time period, it has recaptured both its 50 and 200-day SMAs, with the former starting to curl higher once again. A bull flag has formed as the taut action takes hold, and a break above 3.8% in the near term could see a measured move to 4.25%. On the WEEKLY timeframe it has recorded 5 straight very tight WEEKLY CLOSES, and we know from that type of coiling action often springs powerful moves in the underlying direction. Its WEEKLY chart is ever so slightly distancing itself from the rising 50 WEEK SMA which it has been hugging for the last 3 months. A double bottom base has taken shape with a move above the round 4 number the pivot from the last week in February (which happened to be a WEEKLY doji candle too). Its path to least resistance is higher, which could prove to be a headwind for equities, albeit most likely temporary.
Golden Revival:
- Can gold bugs rejoice? They may be getting to have their chance in the sun again after the glittery metal's reluctance to feel comfortable above the very round 2000 number. Or at least there is a good risk/reward scenario at current PRICES. Below shows gold starting to act better than silver once again at the bottom of this chart, often something not bullish for the overall stock market. The bullish inverted hammer candle Friday at the 61.8% Fibonacci retracement level is a good start for gold enthusiasts which could start the right side of a possible double bottom base. The potential add-on pivot would be above the very round 2000 figure, which on 6/1-2 proved to be too much to overcome, with the 50-day SMA, which has now begun to slope lower. It is now lower 5 of the last 7 weeks following the WEEKLY bearish shooting star candle from the first week in May, but I think Gold can make a move higher right here and go onto challenge the very round 2000 number.
Beauty Is In The Eye Of The Beholder:
- "Junk" can sometimes be a thing of elegance. It is all in the perception. Market participants feel energized when the chart below of the junk bond ETF is acting well. If investors are betting on risky bonds there is a good chance they are sanguine about stocks prospects. The bottom of the chart below this illustrates this well as it shows that the S&P 500 and the JNK pretty much trade in tandem. Last week the ETF started off with a bearish engulfing candle and ended up falling every day, dropping by 1.1% for the week, its largest WEEKLY loss in the last 3 months. It snapped a 3-week win streak with each of the three weeks seeing increased volume. Wednesday-Friday each produced spinning top candles, failing to stem the decline. The concern here for me is such a quick failure after a promising double bottom breakout, as we know the best ones work right away and continue to do so POST breakout. For more than one year now the 200 WEEK SMA has proven to be a formidable roadblock. A move above 92 in my opinion would signal a rapid move toward par into the second half, but PRICE must confirm.
Healthcare Safety Net:
- Did biotech miss out on a golden opportunity for a jump in PRICES this month with the traditional strong seasonality of the last 4 years? The chart here suggests so, with an average 6.7% MONTHLY gain during June, only outdone by a 6.9% advance in November (notice September has not gained ground in 4 consecutive years with an average loss of 4%). So far this June the XBI has gained 1% with one week left. Large biotech names like BIIB may see a bounce in the 280 area near its upward-sloping 200-day SMA, with weakness beginning after the bearish filled-in black candlestick on 6/12 (has declined 7 of the last 8 days). Speaking of the mega-cap healthcare names the XLV (was the only major S&P sector of 11 to gain ground last week) is making a nice move against the XBI as seen on the ratio chart below. They stem mostly from the pharma names like JNJ which is on a 4-week winning streak with each CLOSING at or close to the top of the WEEKLY range. LLY is just 1% off 52-week highs and has risen an incredible 14 of the last 15 weeks. Is this a sign of "risk off" in the space? Let's take a look at two other names in the top 5 holdings in MRK and ABBV below.
Merck:
- Large-cap pharma play up 3% YTD and 25% over last one-year period. Dividend yield of 2.5%.
- Name 4% off most recent 52-week highs and rose 5% last week, good relative strength as PPH fell .5%. Has declined 5 of last 7 weeks but bears have been limited in the damage they could impair.
- Earnings reactions mixed up 1.5 and 1.4% on 4/27 and 10/27/22 and fell 3.3 and 1.4% on 2/2 and 7/28/22.
- Enter after break above double bottom pivot.
- Entry MRK here. Stop 111.
AbbVie:
- Biopharma giant down 16% YTD and 9% over last one year period. Dividend yield of 4.4%.
- Name 19% off most recent 52-week highs and last 4 weeks have produced WEEKLY candles that suggest prior weakness from 5 weeks ending between 4/28-5/26 falling 17% could be waning.
- Earnings reactions mostly lower off 8, 3.8 and 4.2% on 4/27, 10/28, and 7/29/22 and rose 2.8% on 2/9.
- Enter after 4 consecutive WEEKLY bottoming candles.
- Entry ABBV here. Stop 131.
Good luck.