Bearish Evening Star:
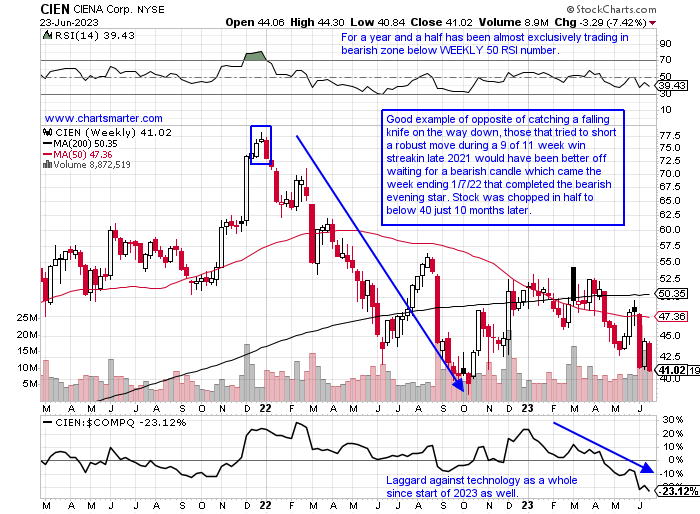
Ciena:
- With markets potentially on the cusp of feeling tired, one can take advantage of this by selling some of their big winners. Technicians would not just sell blindly but would wait for a catalyst, and for me, I would like to introduce a candlestick pattern that I look for that could give one a good risk/reward scenario to part ways with select stocks. Today it is the bearish evening star which is a 3 candle pattern with the first often a strong move higher, the second candle showing some pause or indecision and the third falling precipitously. It often will signal a change in the prevailing direction. Below we will look at some examples of some tech names that recorded the formation and the softness they exhibited afterward. Of course, these will not always work but below is the WEEKLY chart of CIEN, and like many stocks declined sharply after the major averages started to top. The first week of 2022 fell 5% after a sharp run of more than 50% to end 2021. Notice the decline from almost 80 to 40 over the next 10 months. (This should not be construed as investment advice and the author holds no positions in stocks mentioned in this post).
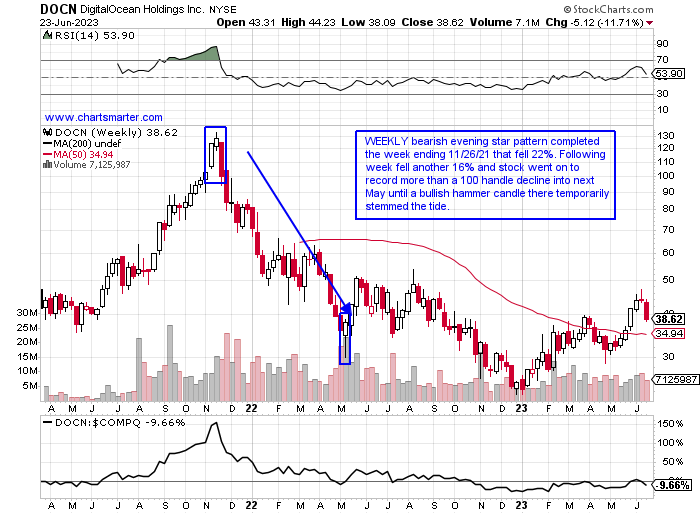
DigitalOcean Holdings:
- Below is another WEEKLY chart with DOCN and notice during the same time period in late 2021 it started to show some fatigue after a 100-handle advance after coming public in late March of that same year. The week ending 11/12/21 rose 21%, then the next week recorded a spinning top, and the final week of the pattern slumped by 22% in above-average WEEKLY volume. For those that ignored the pattern for good measure, it followed through lower the very next week ending 12/3/21 losing 16% in still to this day the second largest WEEKLY volume since coming public. Last week could be considered another evening star pattern falling 12% after the prior week registered a bearish shooting star.
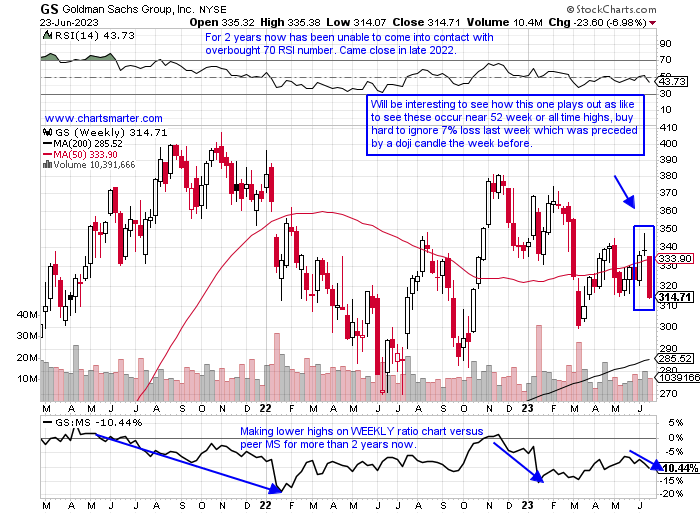
Goldman Sachs:
- This prestigious name within the financials is on the cusp of "bear market mode" 19% off most recent 52-week highs. Last week completed the bearish evening star pattern slumping 7% and slicing the 50-week SMA. The week ending 6/9 added 4%, and the week ending 6/16 a doji candle in the heaviest WEEKLY volume in 2 months. Notice the issues with the very round 400 number in the summer and fall of 2021. Weakness should not be that surprising with distribution recently as the week ending 1/20 lost 9%, and the week ending 3/17 slipped 7.4%, both in the strongest WEEKLY volume in 18 months. It now has the look of a symmetrical triangle pattern, and bulls want to see the very round 300-figure hold up in the near term.
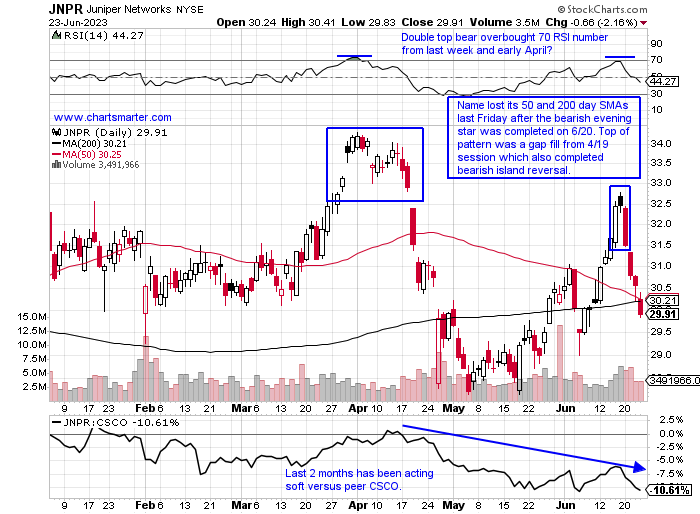
Juniper Networks:
- Here we look at the daily chart of JNPR and this is interesting as it completed a bearish evening star last Tuesday and went on to record a WEEKLY loss of 8%, its worst WEEKLY loss since the last week in April 2022. Monday also filled in a gap from the 4/19 session which completed a bearish island reversal after the gap higher on 3/30. It is lagging peer CSCO which now trades 4% off most recent 52-week highs (and is above both its 50 and 200-day SMAs) compared to JNPR now 13% off its annual peak.
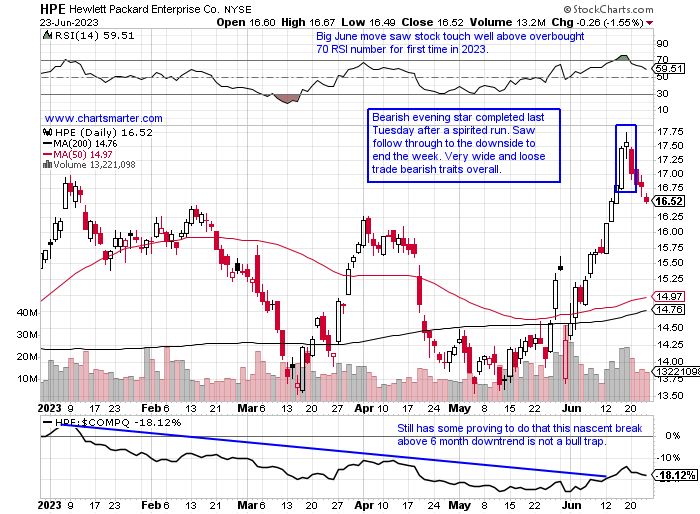
Hewlett Packard Enterprises:
- Finally, we take a look at the daily chart of HPE. Last Tuesday this name completed its bearish evening star after a prior 30% move from top to bottom of the range in June. On 6/15 the stock jumped 4% in double average daily volume, great relative strength as the Nasdaq rose 1%. On 6/16 it recorded a spinning top which suggested some fatigue from the strong June start. It fell 6% last week, but that was after a prior 4-of-5-week winning streak with all 5 CLOSING at highs for the WEEKLY range. The lone down week ending 6/2 CLOSED 10.5% off intraweek lows in a strong showing.
Thanks for reading.
This article requires a Chartsmarter membership. Please click here to join.
Bearish Evening Star:
Ciena:
- With markets potentially on the cusp of feeling tired, one can take advantage of this by selling some of their big winners. Technicians would not just sell blindly but would wait for a catalyst, and for me, I would like to introduce a candlestick pattern that I look for that could give one a good risk/reward scenario to part ways with select stocks. Today it is the bearish evening star which is a 3 candle pattern with the first often a strong move higher, the second candle showing some pause or indecision and the third falling precipitously. It often will signal a change in the prevailing direction. Below we will look at some examples of some tech names that recorded the formation and the softness they exhibited afterward. Of course, these will not always work but below is the WEEKLY chart of CIEN, and like many stocks declined sharply after the major averages started to top. The first week of 2022 fell 5% after a sharp run of more than 50% to end 2021. Notice the decline from almost 80 to 40 over the next 10 months. (This should not be construed as investment advice and the author holds no positions in stocks mentioned in this post).
DigitalOcean Holdings:
- Below is another WEEKLY chart with DOCN and notice during the same time period in late 2021 it started to show some fatigue after a 100-handle advance after coming public in late March of that same year. The week ending 11/12/21 rose 21%, then the next week recorded a spinning top, and the final week of the pattern slumped by 22% in above-average WEEKLY volume. For those that ignored the pattern for good measure, it followed through lower the very next week ending 12/3/21 losing 16% in still to this day the second largest WEEKLY volume since coming public. Last week could be considered another evening star pattern falling 12% after the prior week registered a bearish shooting star.
Goldman Sachs:
- This prestigious name within the financials is on the cusp of "bear market mode" 19% off most recent 52-week highs. Last week completed the bearish evening star pattern slumping 7% and slicing the 50-week SMA. The week ending 6/9 added 4%, and the week ending 6/16 a doji candle in the heaviest WEEKLY volume in 2 months. Notice the issues with the very round 400 number in the summer and fall of 2021. Weakness should not be that surprising with distribution recently as the week ending 1/20 lost 9%, and the week ending 3/17 slipped 7.4%, both in the strongest WEEKLY volume in 18 months. It now has the look of a symmetrical triangle pattern, and bulls want to see the very round 300-figure hold up in the near term.
Juniper Networks:
- Here we look at the daily chart of JNPR and this is interesting as it completed a bearish evening star last Tuesday and went on to record a WEEKLY loss of 8%, its worst WEEKLY loss since the last week in April 2022. Monday also filled in a gap from the 4/19 session which completed a bearish island reversal after the gap higher on 3/30. It is lagging peer CSCO which now trades 4% off most recent 52-week highs (and is above both its 50 and 200-day SMAs) compared to JNPR now 13% off its annual peak.
Hewlett Packard Enterprises:
- Finally, we take a look at the daily chart of HPE. Last Tuesday this name completed its bearish evening star after a prior 30% move from top to bottom of the range in June. On 6/15 the stock jumped 4% in double average daily volume, great relative strength as the Nasdaq rose 1%. On 6/16 it recorded a spinning top which suggested some fatigue from the strong June start. It fell 6% last week, but that was after a prior 4-of-5-week winning streak with all 5 CLOSING at highs for the WEEKLY range. The lone down week ending 6/2 CLOSED 10.5% off intraweek lows in a strong showing.
Thanks for reading.