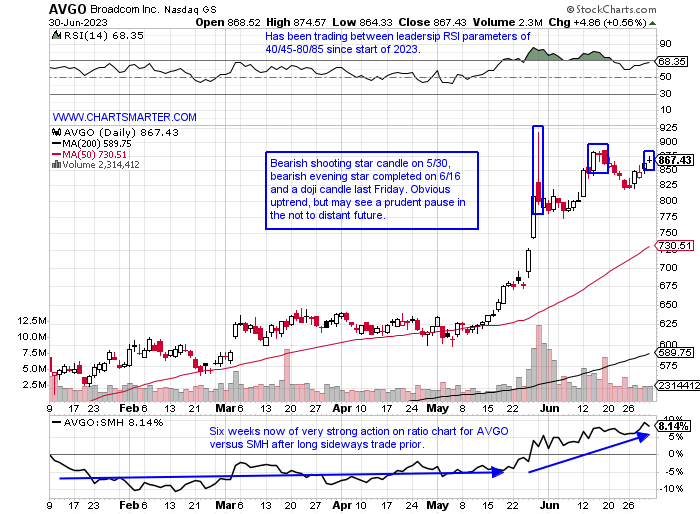
Mega Cap Tech Stalling:
- As of late, we have been making a habit of glancing at the top holdings in the QQQ, which seem to be tiring. This is not a bearish development at all, as long as the periphery plays start to pull their weight, and they have been doing that as we witness better overall participation. Below is the chart of Broadcom, just one of two semis to be in the top 10 holdings of the ETF, and it suggests it may be in need of a pullback. In the last month's period, it has produced 3 sets of bearish candlesticks. The bearish evening star pattern on 6/16 was a mild decline of just less than 2% but volume was powerful, double the daily average and the sixth strongest daily volume since the start of 2023. Friday ended Q2 with a rare doji candle, it's first in 2 months, a sign of concern as they are adept at signaling potential changes in the underlying trend. Additionally, on its WEEKLY chart, it met its measured move to the very round 900 number briefly on 5/30. At the expense of sounding like a broken record, it is firmly in an uptrend but pullbacks along the way are normal and healthy.
Follow The Leader:
- Astute investors will take cues from some of the strongest names in a group and watch their PRICE action vigilantly. Their continued strength or weakness could be a tell for not only the stock but their peers as well. One of those names that is a good example is the chart below of HUBS. I often declared that its early leadership should be monitored closely and if it failed to maintain its forceful uptrend it could be a signal that the software space may be vulnerable. Thankfully, for bulls, it kept its solid action intact. In fact, it has more than doubled off the October 2022 lows and looks poised for further gains. It has rested along the very round 500 number the last 5 weeks and the WEEKLY ranges have been very taut, hallmark bullish traits. It has not recorded a week of distribution, WEEKLY loss in above-average trade in 8 months. In my mind there is no reason this can not travel toward the mid to upper 800's in the next several months, a level not seen since late 2021.

Recent Examples:
- The semis were the best-performing sector within technology in the first half of 2023. Stocks like NVDA were up almost 200% during the time frame. Others that were up more than double included AEHR and ACLS. IDCC and SGH were higher by more than 90%. The chart below of AMD advanced 75% and below is how it appeared in our 6/29 Technology Note. Round number theory came into play with this name with the par figure as that area was the scene of a double bottom with handle breakout in mid-May. It has recorded some dubious candles 20% higher and perhaps that excess was worked off as it filled in a gap and found support recently at its rising 50-day SMA for the first time after the breakout, often an optimal entry. The stock is still 14% off its most recent 52-week highs, while the SMH is just 2% off its own, but the stock still offers good risk/reward right here.

Special Situations:
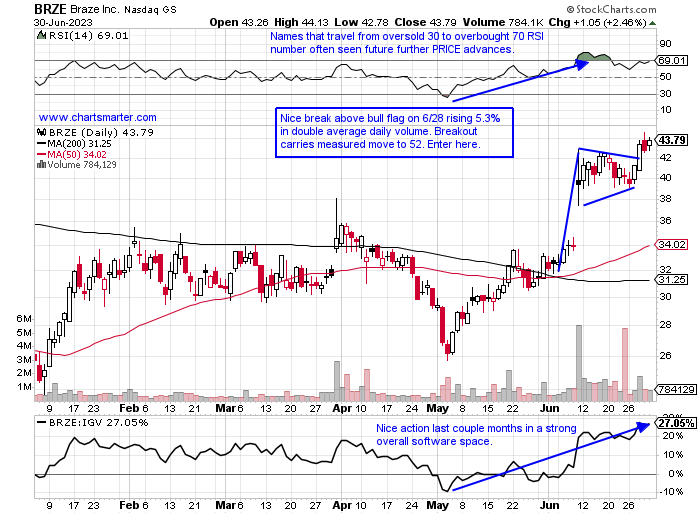
Braze Inc:
- Software name up 61% YTD and 23% over last one year period.
- Name 14% off most recent 52-week highs and up 4 of last 5 weeks. Excellent accumulation with weeks ending 6/9-16 up a combined 29% with both weeks up in double average daily volume. Last week rose 9.1%, tripling gain of IGV.
- Earnings reactions mixed up 16.2 and 9.4% on 6/9 and 3/31 and fell 2.1 and 19.3% on and 12/14 and 9/13/22.
- Enter after break above bull flag.
- Entry BRZE here. Stop 41.
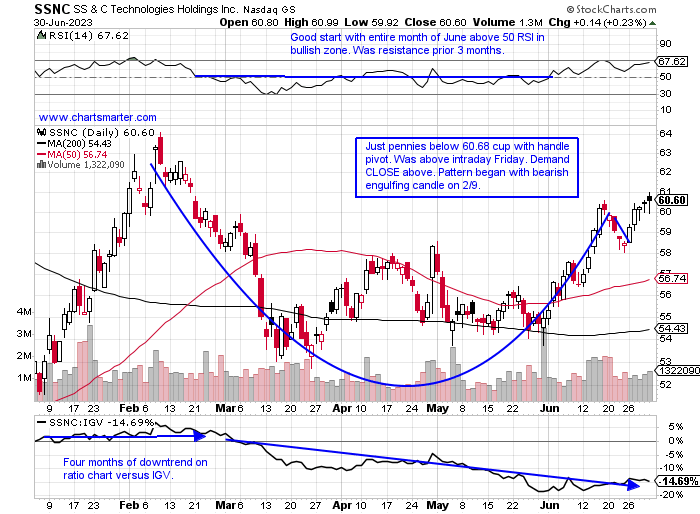
SS & C Technologies:
- Software play up 16% YTD and 3% over last one year period.
- Name 6% off most recent 52-week highs and on WEEKLY chart found support at 61.8% Fibonacci retracement from October-February uptrend in late March. WEEKLY chart setting up bullish inverse head and shoulders pattern.
- Earnings reactions mostly higher up 4.7, 3.4, and 3.8% on 4/28, 2/8, and 10/28/22 and down 6.4% on 7/28/22.
- Enter with buy stop above cup with handle pattern.
- Entry SSNC 60.68. Stop 58.25.
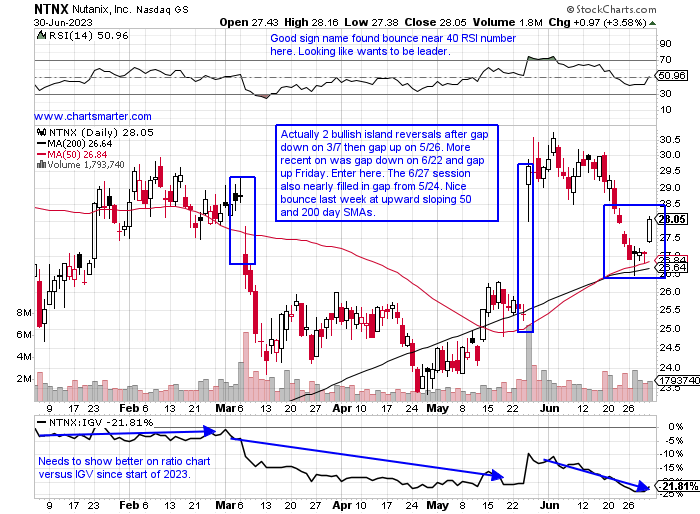
Nutanix:
- Software name up 8% YTD and 93% over last one year period.
- Name 17% off most recent 52-week highs and last week rose 2.5% in line with IGV ending prior 3-week losing streak. Looking to resume uptrend after 4-week win streak weeks ending between 5/12-6/2 that rose by a combined 26%.
- Earnings reactions mixed up 16.8 and 29.1% on 5/25 and 9/1/22 fell 7.9 and 23% on 3/7 and 5/26/22.
- Enter after completion of bullish island reversal.
- Entry NTNX here. Stop 26.50.
Good luck.
Entry summaries:
Buy after break above bull flag BRZE here. Stop 41.
Buy stop above cup with handle pattern SSNC 60.68. Stop 58.25.
Buy after completion of bullish island reversal NTNX here. Stop 26.50.
This article requires a Chartsmarter membership. Please click here to join.
Mega Cap Tech Stalling:
- As of late, we have been making a habit of glancing at the top holdings in the QQQ, which seem to be tiring. This is not a bearish development at all, as long as the periphery plays start to pull their weight, and they have been doing that as we witness better overall participation. Below is the chart of Broadcom, just one of two semis to be in the top 10 holdings of the ETF, and it suggests it may be in need of a pullback. In the last month's period, it has produced 3 sets of bearish candlesticks. The bearish evening star pattern on 6/16 was a mild decline of just less than 2% but volume was powerful, double the daily average and the sixth strongest daily volume since the start of 2023. Friday ended Q2 with a rare doji candle, it's first in 2 months, a sign of concern as they are adept at signaling potential changes in the underlying trend. Additionally, on its WEEKLY chart, it met its measured move to the very round 900 number briefly on 5/30. At the expense of sounding like a broken record, it is firmly in an uptrend but pullbacks along the way are normal and healthy.
Follow The Leader:
- Astute investors will take cues from some of the strongest names in a group and watch their PRICE action vigilantly. Their continued strength or weakness could be a tell for not only the stock but their peers as well. One of those names that is a good example is the chart below of HUBS. I often declared that its early leadership should be monitored closely and if it failed to maintain its forceful uptrend it could be a signal that the software space may be vulnerable. Thankfully, for bulls, it kept its solid action intact. In fact, it has more than doubled off the October 2022 lows and looks poised for further gains. It has rested along the very round 500 number the last 5 weeks and the WEEKLY ranges have been very taut, hallmark bullish traits. It has not recorded a week of distribution, WEEKLY loss in above-average trade in 8 months. In my mind there is no reason this can not travel toward the mid to upper 800's in the next several months, a level not seen since late 2021.
Recent Examples:
- The semis were the best-performing sector within technology in the first half of 2023. Stocks like NVDA were up almost 200% during the time frame. Others that were up more than double included AEHR and ACLS. IDCC and SGH were higher by more than 90%. The chart below of AMD advanced 75% and below is how it appeared in our 6/29 Technology Note. Round number theory came into play with this name with the par figure as that area was the scene of a double bottom with handle breakout in mid-May. It has recorded some dubious candles 20% higher and perhaps that excess was worked off as it filled in a gap and found support recently at its rising 50-day SMA for the first time after the breakout, often an optimal entry. The stock is still 14% off its most recent 52-week highs, while the SMH is just 2% off its own, but the stock still offers good risk/reward right here.
Special Situations:
Braze Inc:
- Software name up 61% YTD and 23% over last one year period.
- Name 14% off most recent 52-week highs and up 4 of last 5 weeks. Excellent accumulation with weeks ending 6/9-16 up a combined 29% with both weeks up in double average daily volume. Last week rose 9.1%, tripling gain of IGV.
- Earnings reactions mixed up 16.2 and 9.4% on 6/9 and 3/31 and fell 2.1 and 19.3% on and 12/14 and 9/13/22.
- Enter after break above bull flag.
- Entry BRZE here. Stop 41.
SS & C Technologies:
- Software play up 16% YTD and 3% over last one year period.
- Name 6% off most recent 52-week highs and on WEEKLY chart found support at 61.8% Fibonacci retracement from October-February uptrend in late March. WEEKLY chart setting up bullish inverse head and shoulders pattern.
- Earnings reactions mostly higher up 4.7, 3.4, and 3.8% on 4/28, 2/8, and 10/28/22 and down 6.4% on 7/28/22.
- Enter with buy stop above cup with handle pattern.
- Entry SSNC 60.68. Stop 58.25.
Nutanix:
- Software name up 8% YTD and 93% over last one year period.
- Name 17% off most recent 52-week highs and last week rose 2.5% in line with IGV ending prior 3-week losing streak. Looking to resume uptrend after 4-week win streak weeks ending between 5/12-6/2 that rose by a combined 26%.
- Earnings reactions mixed up 16.8 and 29.1% on 5/25 and 9/1/22 fell 7.9 and 23% on 3/7 and 5/26/22.
- Enter after completion of bullish island reversal.
- Entry NTNX here. Stop 26.50.
Good luck.
Entry summaries:
Buy after break above bull flag BRZE here. Stop 41.
Buy stop above cup with handle pattern SSNC 60.68. Stop 58.25.
Buy after completion of bullish island reversal NTNX here. Stop 26.50.