Climbing The Wall Of Worry:
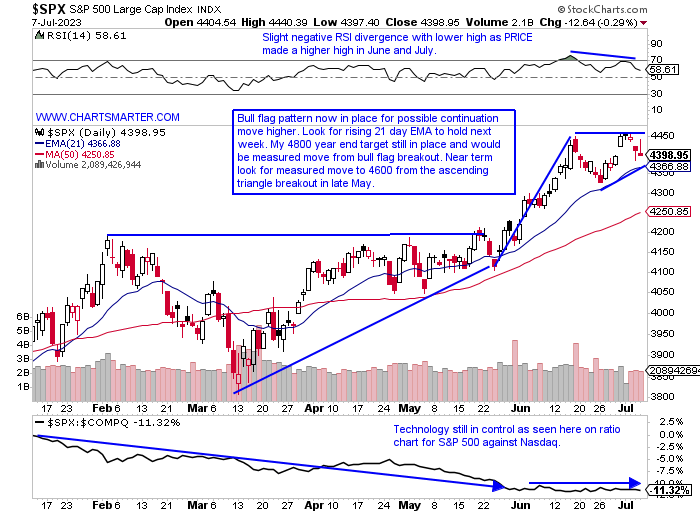
- The problem with the world is that the stupid are cocksure and the intelligent full of doubt (Bertrand Russell quote). Funny as one would not think the "clever" investors, as judged by recent AAII data, are full of uncertainty at all. For the fourth consecutive week bulls came in above the 40 number, and last week at 46.4% was a one-year bullish high. Notice the one-year low in bearishness did align with the market bottom near the end of Q3 '22 as well. Markets are dealing with higher interest rates too, as we spoke of in our Financial Note this week too. Of course, it has seasonality factors on its side as July is one of its strongest months CLOSING higher than where it began 4 of the last 5 years, by an average of 3.4%. On its WEEKLY chart to me, it still looks likely to travel toward the very round 4800 number that it touched in the last week of 2021 and first week of 2022. It is well north of the WEEKLY double-bottom pivot of 4325 whose pivot was created 11 months ago last August. The daily chart shows the importance of holding the 21-day EMA which it has done handsomely since late March, with the exception of a few times where it CLOSED below for a couple sessions before bullishly recapturing the swing traders moving average.
Dollar Dilemma:
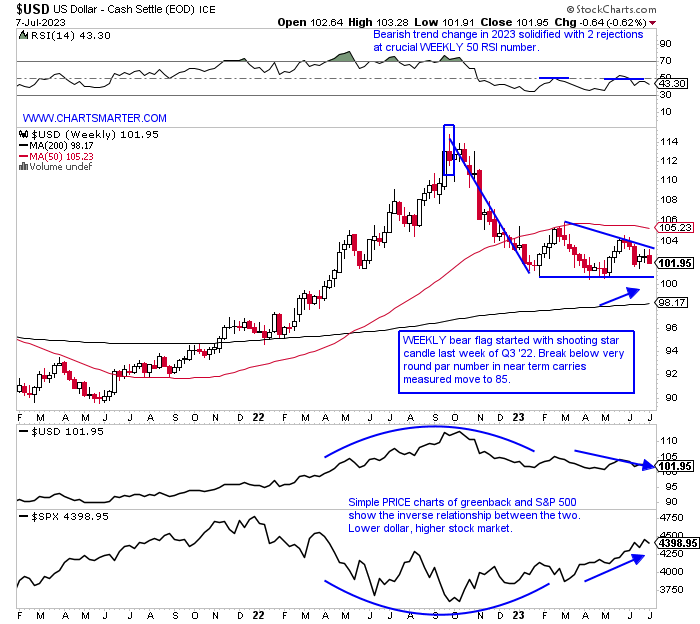
- Will continued weakness in the dollar keep a bid under the stock market? Since the start of 2022, that relationship is intact as one can see below (as opposed to 2021 where everything went up in a smooth gradual fashion). In February when the markets gave back a good chunk of the robust January gains the dollar rose for 4 straight weeks proving the correlation correct (notice the win streak was preceded by a doji candle the last week of January following a 15% haircut). The greenback has now carved out a WEEKLY bear flag and a move below the very round par number could see a waterfall lower in the near term. It has now been below the downward-sloping 50 WEEK SMA since late 2022 and an undercut of the par pivot may see another big move for equities. It is no coincidence that the powerful overall market move that began last October was a top in the greenback. The fact that it has done little on the WEEKLY chart to recoup much of the October-February slide is something dollar bulls can not ignore.
Red Dragon Awakening?
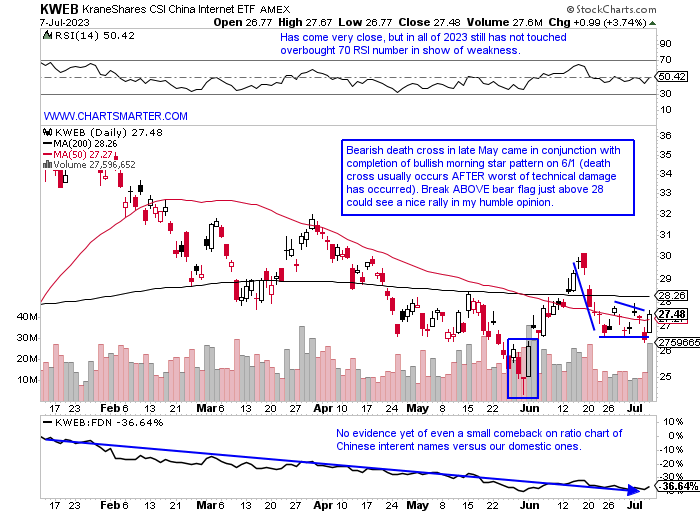
- Over the last 6 month period there is no question China has lagged. It is the worst country ETF over the timeframe and the FXI has given back half of the impressive rally between last November and the end of this January. Below we take a look at the KWEB chart and there is a case for tentative optimism. The bullish morning star pattern from 6/1 is still intact and Friday witnessed some extraordinary strength adding almost 4% in firm volume. A decisive break ABOVE a bear flag and its 200-day SMA just above that could get this going. Since its inception 10 years ago, the KWEB is virtually UNCH, and looking at some of the top holdings there is bifurcation. JD is still almost 50% from its most recent 52-week highs and the strongest charts to me are NTES and BIDU. The former needs to deal with the shooting star candle from 7/3 at the very round par number, and BIDU now sports a cup with handle pivot of 151.10. BABA above 92.50 could see an assertive run as that would take out a bullish falling wedge pattern.
Nuclear Needs:
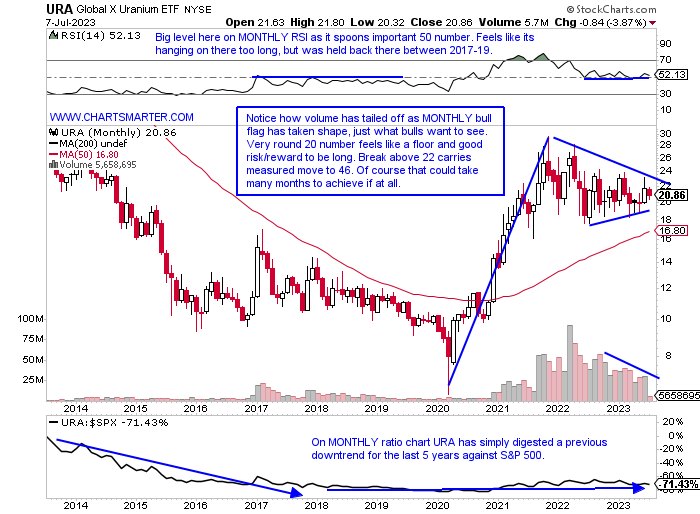
- As the world looks for alternative energy sources, nuclear power is increasingly making it to the top of the list. Some individual names have been responding accordingly. CEG is just 7% off its most recent 52-week highs and the handle on its cup base is forming just above the very round 90 number as it feels like it wants par. BWXT has broken above a bull flag pivot of 70 which carries a measured move to 80 as it trades just 1% from all-time highs. CCJ (full disclosure I am long) last Thursday touched its rising 50-day SMA for the initial time after a cup with handle breakout from a 29.16 trigger on 6/1 that jumped 9% in gigantic volume. Those taking the very long-term view that nuclear power will be an important part of the energy discussion for years to come may be encouraged by the MONTHLY chart below of the URA, especially if it can break above the bull flag formation. Round number theory has come into play (stopped at 30 in November 2021) and the 20 figure has been resolute on a MONTHLY CLOSING basis, finishing above 20 in nine of the last 12 months, with 11 of the 12 trading below 20 intramonth (and the CLOSES below of 19.77, 19.93 and 19.89 in September '22, March and May '23 were all obvious in close proximity to 20). Good risk/reward here with a stop of 19.
Seismic Shift:
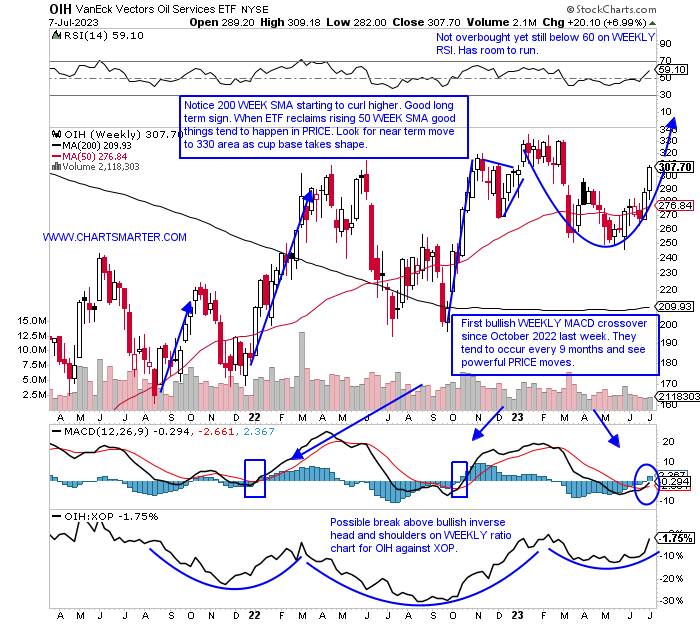
- The energy space witnessed a very authoritative move Friday, especially among equipment names with the OIH rising by 6.8% (we were bullish on the group recently) The ETF has now produced back-to-back 7% WEEKLY gains, and it CLOSED firmly above the very round 300 number, a level of contention between bulls and bears. That area between March and June 2022 was a roadblock, and again with a WEEKLY bull flag that carried a measured move to the very round 400 figure that never played out (flag pole started at 200 the week ending 9/30/22). Plausibly now the fund could be building the right side of a WEEKLY cup base, and this has a habit of strong PRICE runs when it reclaims its 50 WEEK SMA (did so in January and October 2022), like it did last week. The space is a bit extended and names need to digest those dynamic moves (stay tuned for more daily Energy Notes in the second half of 2023 from me) so let us take a look at a couple of other names in the compelling energy group below.
Murphy Oil:
- Exploration play down 11% YTD but higher by 33% over last one year period. Dividend yield of 2.9%.
- Name 25% off most recent 52-week highs and has advanced 7 of last 8 weeks. On WEEKLY chart break above the 50 WEEK SMA would also be break above head and shoulders formation, and we know from FALSE moves come fast ones in the opposite direction.
- Earnings reactions mixed up 5.8 and 1.3% on 1/26 and 8/4/22 and fell .3 and 3.3% on 5/3 and 11/3/22.
- Enter with buy stop above 50 WEEK SMA.
- Entry MUR 39.50. Stop 36.25.
Pioneer Natural Resources:
- Former best-of-breed production play down 10% YTD and 5% over last one year period. Dividend yield of 11.2%.
- Name 25% off most recent 52-week highs and has declined 9 of last 12 weeks. Recently found support at 61.8% Fibonacci level from mid-March to mid-April move.
- FOUR straight negative earnings reactions down 4.3, 4.1, 3.2, and 3.2% on 4/27, 2/24, 10/28, and 8/3/22.
- Enter after break ABOVE bearish descending triangle/bullish engulfing candle.
- Entry PXD here. Stop 196.
Good luck.
This article requires a Chartsmarter membership. Please click here to join.
Climbing The Wall Of Worry:
- The problem with the world is that the stupid are cocksure and the intelligent full of doubt (Bertrand Russell quote). Funny as one would not think the "clever" investors, as judged by recent AAII data, are full of uncertainty at all. For the fourth consecutive week bulls came in above the 40 number, and last week at 46.4% was a one-year bullish high. Notice the one-year low in bearishness did align with the market bottom near the end of Q3 '22 as well. Markets are dealing with higher interest rates too, as we spoke of in our Financial Note this week too. Of course, it has seasonality factors on its side as July is one of its strongest months CLOSING higher than where it began 4 of the last 5 years, by an average of 3.4%. On its WEEKLY chart to me, it still looks likely to travel toward the very round 4800 number that it touched in the last week of 2021 and first week of 2022. It is well north of the WEEKLY double-bottom pivot of 4325 whose pivot was created 11 months ago last August. The daily chart shows the importance of holding the 21-day EMA which it has done handsomely since late March, with the exception of a few times where it CLOSED below for a couple sessions before bullishly recapturing the swing traders moving average.
Dollar Dilemma:
- Will continued weakness in the dollar keep a bid under the stock market? Since the start of 2022, that relationship is intact as one can see below (as opposed to 2021 where everything went up in a smooth gradual fashion). In February when the markets gave back a good chunk of the robust January gains the dollar rose for 4 straight weeks proving the correlation correct (notice the win streak was preceded by a doji candle the last week of January following a 15% haircut). The greenback has now carved out a WEEKLY bear flag and a move below the very round par number could see a waterfall lower in the near term. It has now been below the downward-sloping 50 WEEK SMA since late 2022 and an undercut of the par pivot may see another big move for equities. It is no coincidence that the powerful overall market move that began last October was a top in the greenback. The fact that it has done little on the WEEKLY chart to recoup much of the October-February slide is something dollar bulls can not ignore.
Red Dragon Awakening?
- Over the last 6 month period there is no question China has lagged. It is the worst country ETF over the timeframe and the FXI has given back half of the impressive rally between last November and the end of this January. Below we take a look at the KWEB chart and there is a case for tentative optimism. The bullish morning star pattern from 6/1 is still intact and Friday witnessed some extraordinary strength adding almost 4% in firm volume. A decisive break ABOVE a bear flag and its 200-day SMA just above that could get this going. Since its inception 10 years ago, the KWEB is virtually UNCH, and looking at some of the top holdings there is bifurcation. JD is still almost 50% from its most recent 52-week highs and the strongest charts to me are NTES and BIDU. The former needs to deal with the shooting star candle from 7/3 at the very round par number, and BIDU now sports a cup with handle pivot of 151.10. BABA above 92.50 could see an assertive run as that would take out a bullish falling wedge pattern.
Nuclear Needs:
- As the world looks for alternative energy sources, nuclear power is increasingly making it to the top of the list. Some individual names have been responding accordingly. CEG is just 7% off its most recent 52-week highs and the handle on its cup base is forming just above the very round 90 number as it feels like it wants par. BWXT has broken above a bull flag pivot of 70 which carries a measured move to 80 as it trades just 1% from all-time highs. CCJ (full disclosure I am long) last Thursday touched its rising 50-day SMA for the initial time after a cup with handle breakout from a 29.16 trigger on 6/1 that jumped 9% in gigantic volume. Those taking the very long-term view that nuclear power will be an important part of the energy discussion for years to come may be encouraged by the MONTHLY chart below of the URA, especially if it can break above the bull flag formation. Round number theory has come into play (stopped at 30 in November 2021) and the 20 figure has been resolute on a MONTHLY CLOSING basis, finishing above 20 in nine of the last 12 months, with 11 of the 12 trading below 20 intramonth (and the CLOSES below of 19.77, 19.93 and 19.89 in September '22, March and May '23 were all obvious in close proximity to 20). Good risk/reward here with a stop of 19.
Seismic Shift:
- The energy space witnessed a very authoritative move Friday, especially among equipment names with the OIH rising by 6.8% (we were bullish on the group recently) The ETF has now produced back-to-back 7% WEEKLY gains, and it CLOSED firmly above the very round 300 number, a level of contention between bulls and bears. That area between March and June 2022 was a roadblock, and again with a WEEKLY bull flag that carried a measured move to the very round 400 figure that never played out (flag pole started at 200 the week ending 9/30/22). Plausibly now the fund could be building the right side of a WEEKLY cup base, and this has a habit of strong PRICE runs when it reclaims its 50 WEEK SMA (did so in January and October 2022), like it did last week. The space is a bit extended and names need to digest those dynamic moves (stay tuned for more daily Energy Notes in the second half of 2023 from me) so let us take a look at a couple of other names in the compelling energy group below.
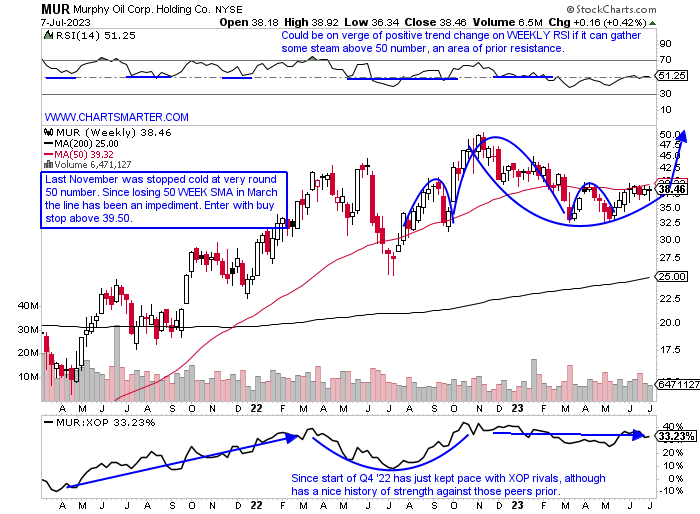
Murphy Oil:
- Exploration play down 11% YTD but higher by 33% over last one year period. Dividend yield of 2.9%.
- Name 25% off most recent 52-week highs and has advanced 7 of last 8 weeks. On WEEKLY chart break above the 50 WEEK SMA would also be break above head and shoulders formation, and we know from FALSE moves come fast ones in the opposite direction.
- Earnings reactions mixed up 5.8 and 1.3% on 1/26 and 8/4/22 and fell .3 and 3.3% on 5/3 and 11/3/22.
- Enter with buy stop above 50 WEEK SMA.
- Entry MUR 39.50. Stop 36.25.
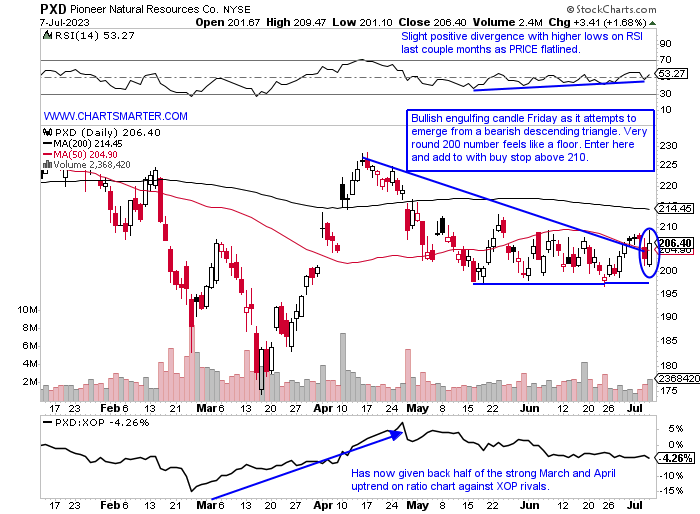
Pioneer Natural Resources:
- Former best-of-breed production play down 10% YTD and 5% over last one year period. Dividend yield of 11.2%.
- Name 25% off most recent 52-week highs and has declined 9 of last 12 weeks. Recently found support at 61.8% Fibonacci level from mid-March to mid-April move.
- FOUR straight negative earnings reactions down 4.3, 4.1, 3.2, and 3.2% on 4/27, 2/24, 10/28, and 8/3/22.
- Enter after break ABOVE bearish descending triangle/bullish engulfing candle.
- Entry PXD here. Stop 196.
Good luck.