"Amateurs want to be right. Professionals want to make money." Greenspan
Tech Unrelenting:
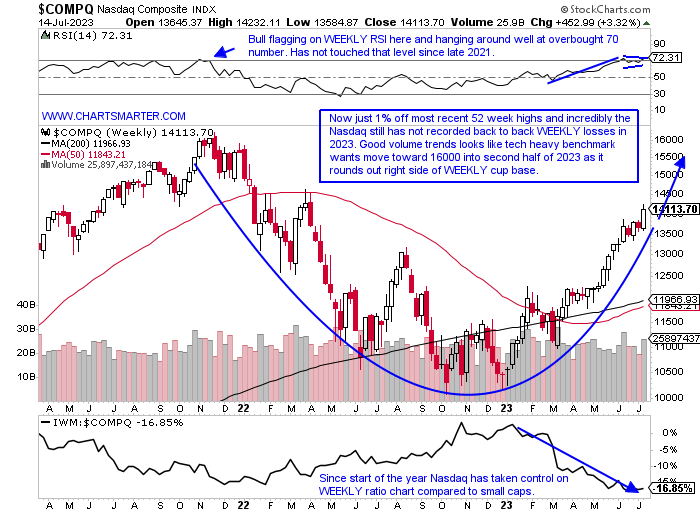
- For all the calls stating technology may cool off, myself included, the sector is ignoring the narrative. While other groups are participating in a healthy manner, there is no question who is the leader thus far in 2023. So far on a WEEKLY basis, there have been eight gains of 3-4%, and not one week of distribution has occurred yet this year as volume trends remain very positive. The Nasdaq YTD is up 35%, compared to the Dow up 4, the S&P 500 by 17, and the Russell 2000 by 10%. This is a bull market that has been overlooking any bearish technicals, of course, this could change at any time, as dubious candles continue to mount. On 7/12 the Nasdaq recorded a doji, on 6/16 a bearish dark cloud cover, Friday a small shooting star CLOSING more than 100 handles off the intraday highs (the IGV registered a bearish gravestone doji Friday, and the SOXX a bearish engulfing candle). At some point, these will matter, especially as multiple ones flare up in such close succession, but the trend is undoubtedly higher. I still think we march to 16000, at some point in 2023, with some volatility, as the Nasdaq builds the right side of its WEEKLY cup base. If the DAX and CAC have already touched the late 2021 highs, why can't the Nasdaq this year?
Doctors Note:
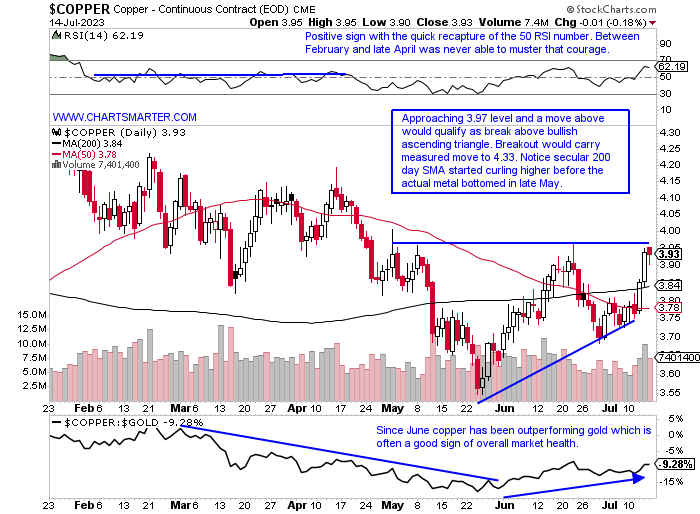
- Is copper trying to convey a market message? We know jobs data came in very hot this month and China is adding stimulus, which is probably at least partially responsible for this recent move higher in copper. Its WEEKLY chart is showing a symmetrical triangle that started with the rapid descent near the "round" 5 number in early March '22 that did not bottom out to almost touching 3 in that July. The pivot aligns in the same 4 area on the WEEKLY chart and the ascending triangle below on its daily, which is always good to see entry points match on different timeframes. FCX recorded a bullish WEEKLY engulfing candle advancing more than 6% and look for it to gravitate toward a WEEKLY double bottom pivot of 43.56 in the near term. While it garners much of the attention peer SCCO has in my opinion often the better play is just 6% off its most recent 52-week highs (FCX is double that at 12%). Add to that a dividend yield above 5%, while FCX pays .7%. The WEEKLY chart for SCCO is sporting a diamond pattern and a break above 78.50 would carry a measured move to the very round par number.
European Battle For Supremacy:
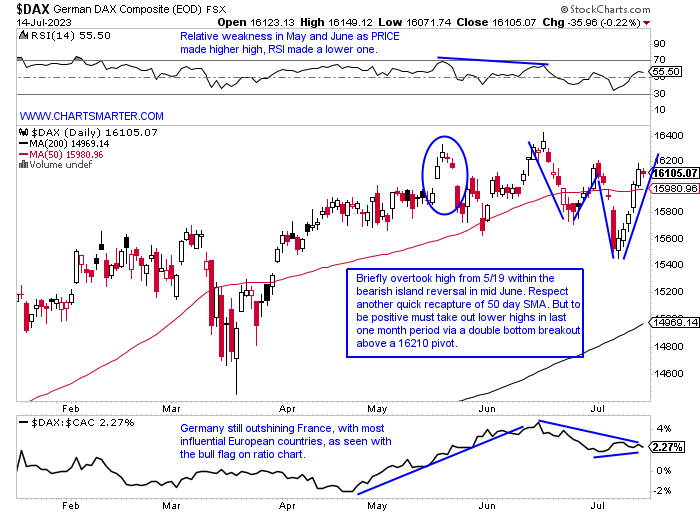
- As goes Germany and France, so goes Europe. Respect the DAX gain of more than 3% this week as it recorded a WEEKLY bullish piercing line (did not recoup all of the prior week's decline of 3.6%). It may be growing weary as it has put on a powerful show since a move off the very round 12000 number last fall. Big WEEKLY losses have become the norm with the week ending 6/23 falling 2.7%. And the WEEKLY chart is right into the teeth of a doji candle in the first week of 2022. Top-holding SAP surged more than 8% this week and is on a 6-session win streak. SIEGY also added 8% this week and its chart looks very similar to the daily chart below of the DAX. Siemens will however have to deal with bearish engulfing candles in somewhat quick succession on 6/16 and 6/28. Mercedes Benz, via MBGAF, is benefitting from a strong overall global auto space and is driving toward a WEEKLY 83.60 cup with handle pivot in a base almost 2 years long. I think the DAX will have challenges breaking above these levels, but a move through the 16210 double-bottom pivot could see another level of buying.
Sneaky Strength:
- There is a sly character slowly making its way into the rally equation that not many have been speaking of. That would be the real estate sector and the chart below of the XLRE speaks to its nascent appeal. Over the last one month period the fund is the fourth best acting major S&P sector of 11 with a gain of more than 4%. That beats out technology, energy, and financials and is within spitting distance of the industrials and discretionary. If I hear one more comment from someone saying the commercial real estate market is going to implode like never before, this chart is telling me otherwise and the worst of it may be in the rearview mirror. Its WEEKLY chart is still making lower highs since late 2021 but is also making higher lows since last October. Top holdings worth watching are SPG which may be forming a handle on a cup base that started in early February (notice double bottom this year at very round par number). DLR is up 5 of the last 8 weeks including two 9% advances and PLD is pennies above a double bottom trigger of 127.71.

Lonely Biotech:
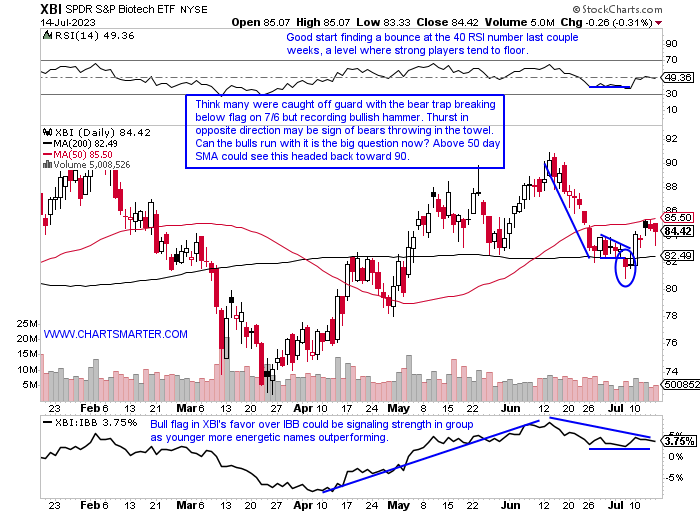
- The group has been pushed to the wayside and when most are off their guard it is often a good idea to begin watching. The XBI added last week recording a bullish WEEKLY engulfing candle in the process. It ended a 3 week losing streak and for the first time in 6 weeks CLOSED in the upper half of the WEEKLY range. This past week displayed some decent technical action as Monday advanced 3% and one has to admire how Tuesday was a very small intraday range trading inside Monday's candle. Friday ended the week with a bullish hammer too. Some top ten holdings with interesting action include HALO whose PRICE was chopped in half from the round 60 to 30 number between last November and this May. EXAS has been on a spirited run but has registered bearish engulfing candles at the very round par number on 6/21 and 7/14. Above there could get exciting. Let us take a look below at the XBI and then to conclude this note with a couple of names that are demonstrating strength while the overall group is trying to muster the courage to sprint upward.
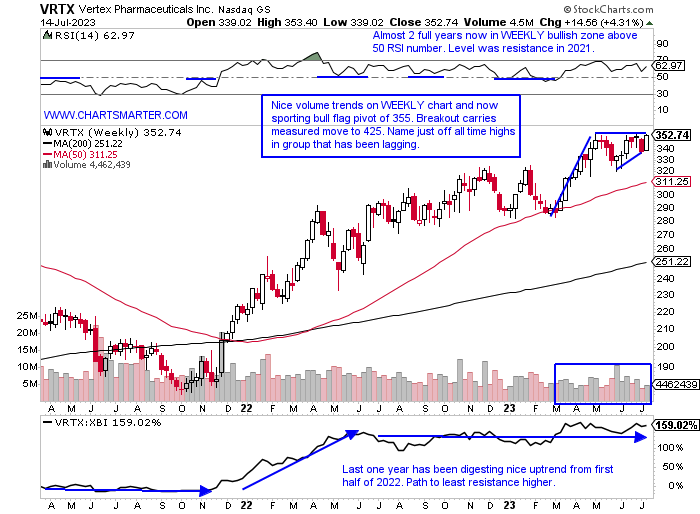
Vertex Pharmaceuticals:
- Biopharma play up 22% YTD and 23% over last one year period.
- Name 1% off most recent 52-week highs and nice flag pole construction between weeks ending 3/17-5/8 where it rose 7 of 8 weeks and all 8 CLOSED in upper half of WEEKLY range.
- Earnings reactions mostly higher up .3, 9 and 4.8% on 5/2, 10/28 and 8/5/22 and fell 4.9% on 2/8.
- Enter with buy stop above WEEKLY bull flag.
- Entry VRTX 355. Stop 335.
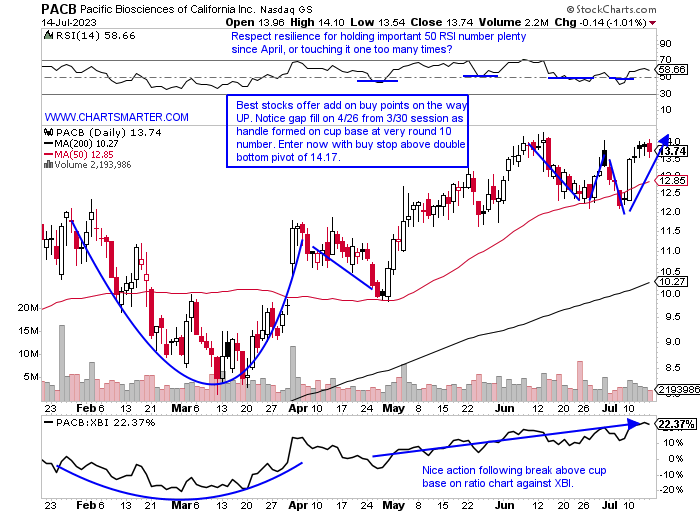
Pacific Biosciences:
- Biotech play up 68% YTD and 197% over last one year period.
- Name 4% off most recent 52 week highs and last nine weeks have CLOSED above 12.50 area which had been a roadblock several times dating back to Q1 '22 (has look of WEEKLY ascending triangle breakout). Now looks like support. Good relative strength last week up 11.3%.
- Earnings reactions mostly higher up 4, 7.2 and 11.5% on 5/3, 11/8 and 8/4/22 and fell 3.2% on 2/17.
- Enter with buy stop above double bottom base.
- Entry PACB 14.17. Stop 13.50.
Good luck.
This article requires a Chartsmarter membership. Please click here to join.
"Amateurs want to be right. Professionals want to make money." Greenspan
Tech Unrelenting:
- For all the calls stating technology may cool off, myself included, the sector is ignoring the narrative. While other groups are participating in a healthy manner, there is no question who is the leader thus far in 2023. So far on a WEEKLY basis, there have been eight gains of 3-4%, and not one week of distribution has occurred yet this year as volume trends remain very positive. The Nasdaq YTD is up 35%, compared to the Dow up 4, the S&P 500 by 17, and the Russell 2000 by 10%. This is a bull market that has been overlooking any bearish technicals, of course, this could change at any time, as dubious candles continue to mount. On 7/12 the Nasdaq recorded a doji, on 6/16 a bearish dark cloud cover, Friday a small shooting star CLOSING more than 100 handles off the intraday highs (the IGV registered a bearish gravestone doji Friday, and the SOXX a bearish engulfing candle). At some point, these will matter, especially as multiple ones flare up in such close succession, but the trend is undoubtedly higher. I still think we march to 16000, at some point in 2023, with some volatility, as the Nasdaq builds the right side of its WEEKLY cup base. If the DAX and CAC have already touched the late 2021 highs, why can't the Nasdaq this year?
Doctors Note:
- Is copper trying to convey a market message? We know jobs data came in very hot this month and China is adding stimulus, which is probably at least partially responsible for this recent move higher in copper. Its WEEKLY chart is showing a symmetrical triangle that started with the rapid descent near the "round" 5 number in early March '22 that did not bottom out to almost touching 3 in that July. The pivot aligns in the same 4 area on the WEEKLY chart and the ascending triangle below on its daily, which is always good to see entry points match on different timeframes. FCX recorded a bullish WEEKLY engulfing candle advancing more than 6% and look for it to gravitate toward a WEEKLY double bottom pivot of 43.56 in the near term. While it garners much of the attention peer SCCO has in my opinion often the better play is just 6% off its most recent 52-week highs (FCX is double that at 12%). Add to that a dividend yield above 5%, while FCX pays .7%. The WEEKLY chart for SCCO is sporting a diamond pattern and a break above 78.50 would carry a measured move to the very round par number.
European Battle For Supremacy:
- As goes Germany and France, so goes Europe. Respect the DAX gain of more than 3% this week as it recorded a WEEKLY bullish piercing line (did not recoup all of the prior week's decline of 3.6%). It may be growing weary as it has put on a powerful show since a move off the very round 12000 number last fall. Big WEEKLY losses have become the norm with the week ending 6/23 falling 2.7%. And the WEEKLY chart is right into the teeth of a doji candle in the first week of 2022. Top-holding SAP surged more than 8% this week and is on a 6-session win streak. SIEGY also added 8% this week and its chart looks very similar to the daily chart below of the DAX. Siemens will however have to deal with bearish engulfing candles in somewhat quick succession on 6/16 and 6/28. Mercedes Benz, via MBGAF, is benefitting from a strong overall global auto space and is driving toward a WEEKLY 83.60 cup with handle pivot in a base almost 2 years long. I think the DAX will have challenges breaking above these levels, but a move through the 16210 double-bottom pivot could see another level of buying.
Sneaky Strength:
- There is a sly character slowly making its way into the rally equation that not many have been speaking of. That would be the real estate sector and the chart below of the XLRE speaks to its nascent appeal. Over the last one month period the fund is the fourth best acting major S&P sector of 11 with a gain of more than 4%. That beats out technology, energy, and financials and is within spitting distance of the industrials and discretionary. If I hear one more comment from someone saying the commercial real estate market is going to implode like never before, this chart is telling me otherwise and the worst of it may be in the rearview mirror. Its WEEKLY chart is still making lower highs since late 2021 but is also making higher lows since last October. Top holdings worth watching are SPG which may be forming a handle on a cup base that started in early February (notice double bottom this year at very round par number). DLR is up 5 of the last 8 weeks including two 9% advances and PLD is pennies above a double bottom trigger of 127.71.
Lonely Biotech:
- The group has been pushed to the wayside and when most are off their guard it is often a good idea to begin watching. The XBI added last week recording a bullish WEEKLY engulfing candle in the process. It ended a 3 week losing streak and for the first time in 6 weeks CLOSED in the upper half of the WEEKLY range. This past week displayed some decent technical action as Monday advanced 3% and one has to admire how Tuesday was a very small intraday range trading inside Monday's candle. Friday ended the week with a bullish hammer too. Some top ten holdings with interesting action include HALO whose PRICE was chopped in half from the round 60 to 30 number between last November and this May. EXAS has been on a spirited run but has registered bearish engulfing candles at the very round par number on 6/21 and 7/14. Above there could get exciting. Let us take a look below at the XBI and then to conclude this note with a couple of names that are demonstrating strength while the overall group is trying to muster the courage to sprint upward.
Vertex Pharmaceuticals:
- Biopharma play up 22% YTD and 23% over last one year period.
- Name 1% off most recent 52-week highs and nice flag pole construction between weeks ending 3/17-5/8 where it rose 7 of 8 weeks and all 8 CLOSED in upper half of WEEKLY range.
- Earnings reactions mostly higher up .3, 9 and 4.8% on 5/2, 10/28 and 8/5/22 and fell 4.9% on 2/8.
- Enter with buy stop above WEEKLY bull flag.
- Entry VRTX 355. Stop 335.
Pacific Biosciences:
- Biotech play up 68% YTD and 197% over last one year period.
- Name 4% off most recent 52 week highs and last nine weeks have CLOSED above 12.50 area which had been a roadblock several times dating back to Q1 '22 (has look of WEEKLY ascending triangle breakout). Now looks like support. Good relative strength last week up 11.3%.
- Earnings reactions mostly higher up 4, 7.2 and 11.5% on 5/3, 11/8 and 8/4/22 and fell 3.2% on 2/17.
- Enter with buy stop above double bottom base.
- Entry PACB 14.17. Stop 13.50.
Good luck.