"Follow the stream. Have faith in its course." Sheng Yen
Shot Across The Bow?
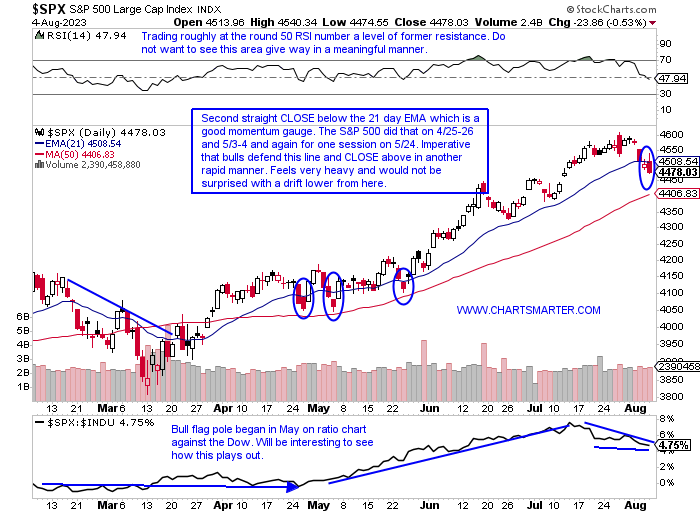
- The possible canary in the coal mine for the S&P 500 chart below was very likely the ugly outside day on 7/27 that reversed after briefly trading above the round 4600 number. The following three sessions all recorded very tight ranges inside the 7/27 candle which was an indication of fatigue (the 7/31 and 8/1 days registered spinning top candles which also suggest exhaustion). On the chart below the 21-day EMA is now sloping lower and it has CLOSED below it on back-to-back sessions something it has not done since breaking above the swing traders toolbox 21-day EMA (notice how as the index attempted to shrug off February weakness that line acted as resistance. On the WEEKLY timeframe, the chart still has a bullish slant as a handle may be developing on a long cup base even though it fell more than 2% last week, its largest WEEKLY loss in 5 months. On the MONTHLY chart, this will most likely look like a small blip come year-end as we are in the midst of a powerful 5 MONTH winning streak.
Zooming Out:
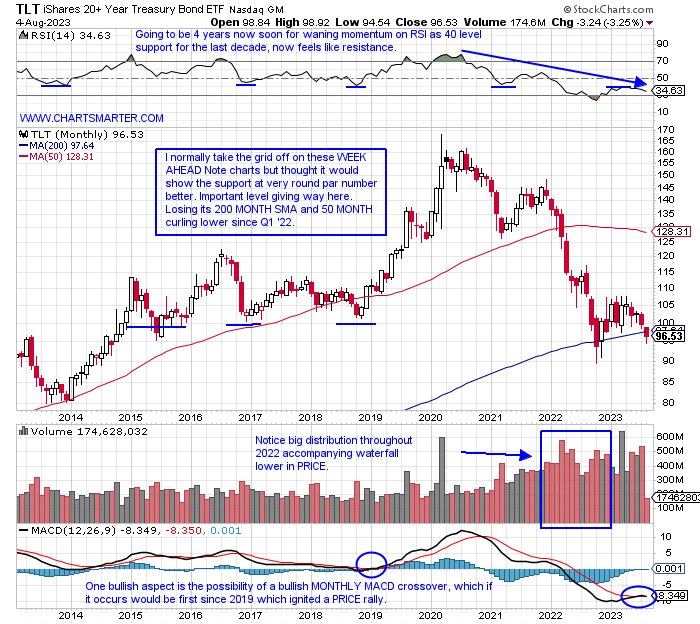
- When in doubt zoom out. As treasuries scored a big move Friday, the TLT added 1.8% for its biggest gain in more than 3 months, it could be useful to take a look at the longer-term picture. Below is the MONTHLY chart and notice how important the very round par number has been dating back more than 8 years. That level was solid support between 2015-19 and it has recently slipped below 100. The 3 prior times it visited par it recorded a somewhat springboard effect but this time around it has stuck to the area like glue. Not necessarily the best thing, especially if you are a bull. Notice on the chart below volume ballooned during a 10 of 11-month losing streak between December 2021-October 2022, and the proceeding limp reply should be concerning. Is the 100 level if and when retested going to turn into resistance? It could not have been a comfortable feeling for Ackman who is now short in size (30-year) but remember that the best trades often start with a sick feeling in your stomach. Consider this very round par number to be a very critical line in the sand going into year-end.
Something Has To Give:
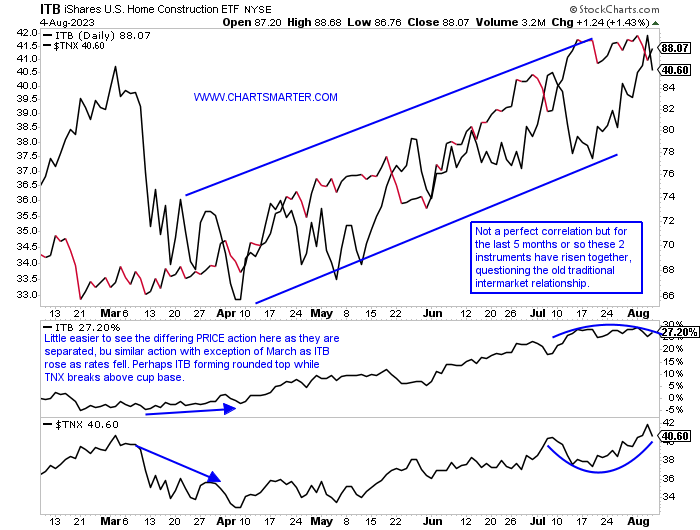
- Intermarket relationships are a funny thing. Once everyone assumes they should act in their traditional manner, they tend to do just the opposite. Friday the 10-year yield backed off more than 3%, its strongest decline in more than 3 months, as the TNX recorded a bearish engulfing candle. On the chart below I overlapped the PRICE of the TNX and the homebuilding ETF in the ITB (this is a pure play homebuilding ETF with the top 4 holdings in actual homebuilders representing more than 40% of the fund compared to the XHB where only PHM is represented in the top 10 components) and one can see them moving somewhat in lockstep for nearly 5 months. With the TNX unable to CLOSE above the WEEKLY double bottom pivot of 4.09%, even though 3 of the last 5 weeks have been above intraweek, I think the ITB will be the one to continue its ascent. It has formed a bull flag pivot with a move above the very round 90 number carrying a measured move to almost par. Peering deep into the holdings BZH has one of the better technical looks than any in the building bunch. A move back toward the 31 area offers good risk/reward in my opinion.
World On Notice?
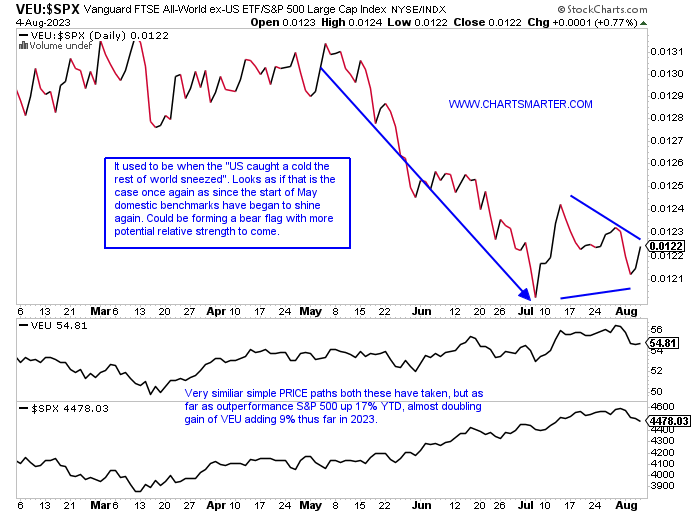
- Will international markets be taking their cue from our domestic ones going forward? If so that could be an unsettling feeling after Friday's reversal. Peering at the ratio chart below comparing the VEU to the S&P 500 shows that our domestic benchmark in general is leading the way. Is that responsibility going to be too much to bear? The VEU chart recorded a bearish dark cloud cover candle on 7/27 and then a spinning top and doji candle the next 2 sessions and this Wednesday could be considered the completion of a bearish island reversal after the gap up on 7/12. If one is bearish Europe it has the largest weighting in the VEU at over 40%, and then the emerging markets represent one-quarter of the fund. And if the greenback can keep up its nascent rally that will certainly be a headwind. Perhaps the S&P 500 will act better than its international peers, but that does not mean on an absolute basis it can not fall obviously. This ratio chart picture is simply showing the S&P 500 could perform relatively better.
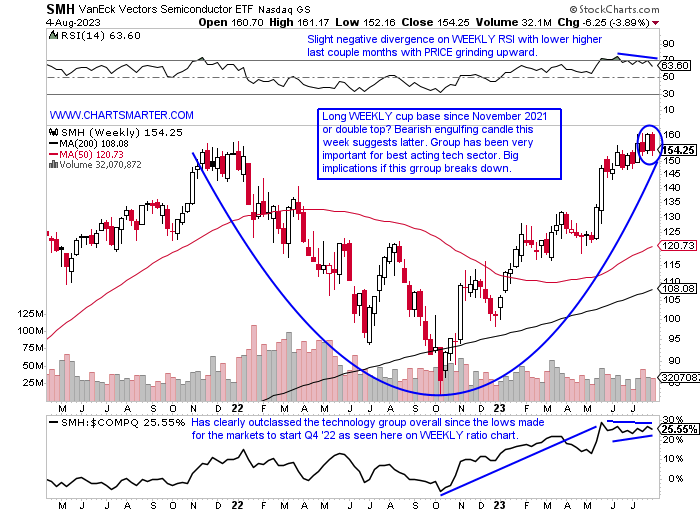
Technology Feeling The Pressure:
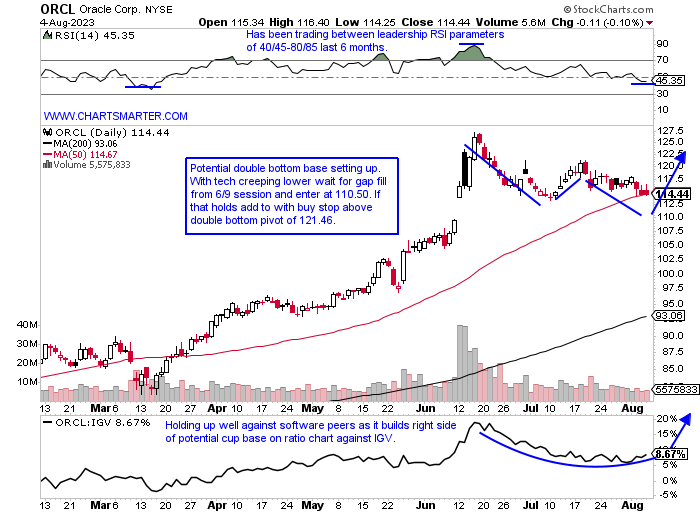
- It is not debatable that semiconductors are absolutely essential to the fortunes of technology. If they waver the sector will suffer. The WEEKLY chart below shows the SMH at an inflection point. The fund is either going to sprint higher past a WEEKLY cup base, begin to descend after a doubling in PRICE since the round 80 number last October, or something bulls would like to witness with healthy digestion over the next several weeks. Let us take a look at a couple of software plays that may offer attractive entries in ORCL and MSTR. The former recently broke above a long WEEKLY cup base trigger of 103.44 and now has the look of a WEEKLY bull flag. MSTR will be possibly looking to retest a WEEKLY bullish ascending triangle pivot near the 360 level which would align with a test of the rising 50 WEEK SMA. Both of these suggested pivots are a few percentage points away from current PRICES but in this particular tech environment, we want to be both patient and opportunistic.
Oracle:
- "Old tech" software play up 40% YTD and 48% over last one year period. Dividend yield of 1.4%.
- Name 10% off most recent 52-week highs and has fallen 5 of the last 7 weeks but has dropped on a somewhat pedestrian basis. More than doubled in PRICE during 28 of 37-week win streak weeks ending between 10/7/22-6/16 (week ending 6/16 rose 14.2% in fifth best WEEKLY volume in last 5 years).
- Earnings reactions mostly lower off 3.2, .9, and 1.3% on 3/10, 12/13, and 9/13/22 before a gain of .2% on 6/13.
- Enter on pullback into gap fill.
- Entry ORCL 110.50. Stop 104.
MicroStrategy:
- Software play up 166% YTD and 22% over last one year period.
- Name 21% off most recent 52-week highs and current 3-week has lost a combined 18%, but has advanced by 258% from top to bottom of range after double bottom on WEEKLY chart from May 2022 and the start of 2023.
- Earnings reactions mostly lower off 6.4, 2.5, and 3.5% on 8/2, 2/3, and 11/2/22 and rose 6.7% on 5/2.
- Enter on pullback into rising 50-day SMA following recent breakout.
- Entry MSTR 362. Stop 340.

Good luck.
This article requires a Chartsmarter membership. Please click here to join.
"Follow the stream. Have faith in its course." Sheng Yen
Shot Across The Bow?
- The possible canary in the coal mine for the S&P 500 chart below was very likely the ugly outside day on 7/27 that reversed after briefly trading above the round 4600 number. The following three sessions all recorded very tight ranges inside the 7/27 candle which was an indication of fatigue (the 7/31 and 8/1 days registered spinning top candles which also suggest exhaustion). On the chart below the 21-day EMA is now sloping lower and it has CLOSED below it on back-to-back sessions something it has not done since breaking above the swing traders toolbox 21-day EMA (notice how as the index attempted to shrug off February weakness that line acted as resistance. On the WEEKLY timeframe, the chart still has a bullish slant as a handle may be developing on a long cup base even though it fell more than 2% last week, its largest WEEKLY loss in 5 months. On the MONTHLY chart, this will most likely look like a small blip come year-end as we are in the midst of a powerful 5 MONTH winning streak.
Zooming Out:
- When in doubt zoom out. As treasuries scored a big move Friday, the TLT added 1.8% for its biggest gain in more than 3 months, it could be useful to take a look at the longer-term picture. Below is the MONTHLY chart and notice how important the very round par number has been dating back more than 8 years. That level was solid support between 2015-19 and it has recently slipped below 100. The 3 prior times it visited par it recorded a somewhat springboard effect but this time around it has stuck to the area like glue. Not necessarily the best thing, especially if you are a bull. Notice on the chart below volume ballooned during a 10 of 11-month losing streak between December 2021-October 2022, and the proceeding limp reply should be concerning. Is the 100 level if and when retested going to turn into resistance? It could not have been a comfortable feeling for Ackman who is now short in size (30-year) but remember that the best trades often start with a sick feeling in your stomach. Consider this very round par number to be a very critical line in the sand going into year-end.
Something Has To Give:
- Intermarket relationships are a funny thing. Once everyone assumes they should act in their traditional manner, they tend to do just the opposite. Friday the 10-year yield backed off more than 3%, its strongest decline in more than 3 months, as the TNX recorded a bearish engulfing candle. On the chart below I overlapped the PRICE of the TNX and the homebuilding ETF in the ITB (this is a pure play homebuilding ETF with the top 4 holdings in actual homebuilders representing more than 40% of the fund compared to the XHB where only PHM is represented in the top 10 components) and one can see them moving somewhat in lockstep for nearly 5 months. With the TNX unable to CLOSE above the WEEKLY double bottom pivot of 4.09%, even though 3 of the last 5 weeks have been above intraweek, I think the ITB will be the one to continue its ascent. It has formed a bull flag pivot with a move above the very round 90 number carrying a measured move to almost par. Peering deep into the holdings BZH has one of the better technical looks than any in the building bunch. A move back toward the 31 area offers good risk/reward in my opinion.
World On Notice?
- Will international markets be taking their cue from our domestic ones going forward? If so that could be an unsettling feeling after Friday's reversal. Peering at the ratio chart below comparing the VEU to the S&P 500 shows that our domestic benchmark in general is leading the way. Is that responsibility going to be too much to bear? The VEU chart recorded a bearish dark cloud cover candle on 7/27 and then a spinning top and doji candle the next 2 sessions and this Wednesday could be considered the completion of a bearish island reversal after the gap up on 7/12. If one is bearish Europe it has the largest weighting in the VEU at over 40%, and then the emerging markets represent one-quarter of the fund. And if the greenback can keep up its nascent rally that will certainly be a headwind. Perhaps the S&P 500 will act better than its international peers, but that does not mean on an absolute basis it can not fall obviously. This ratio chart picture is simply showing the S&P 500 could perform relatively better.
Technology Feeling The Pressure:
- It is not debatable that semiconductors are absolutely essential to the fortunes of technology. If they waver the sector will suffer. The WEEKLY chart below shows the SMH at an inflection point. The fund is either going to sprint higher past a WEEKLY cup base, begin to descend after a doubling in PRICE since the round 80 number last October, or something bulls would like to witness with healthy digestion over the next several weeks. Let us take a look at a couple of software plays that may offer attractive entries in ORCL and MSTR. The former recently broke above a long WEEKLY cup base trigger of 103.44 and now has the look of a WEEKLY bull flag. MSTR will be possibly looking to retest a WEEKLY bullish ascending triangle pivot near the 360 level which would align with a test of the rising 50 WEEK SMA. Both of these suggested pivots are a few percentage points away from current PRICES but in this particular tech environment, we want to be both patient and opportunistic.
Oracle:
- "Old tech" software play up 40% YTD and 48% over last one year period. Dividend yield of 1.4%.
- Name 10% off most recent 52-week highs and has fallen 5 of the last 7 weeks but has dropped on a somewhat pedestrian basis. More than doubled in PRICE during 28 of 37-week win streak weeks ending between 10/7/22-6/16 (week ending 6/16 rose 14.2% in fifth best WEEKLY volume in last 5 years).
- Earnings reactions mostly lower off 3.2, .9, and 1.3% on 3/10, 12/13, and 9/13/22 before a gain of .2% on 6/13.
- Enter on pullback into gap fill.
- Entry ORCL 110.50. Stop 104.
MicroStrategy:
- Software play up 166% YTD and 22% over last one year period.
- Name 21% off most recent 52-week highs and current 3-week has lost a combined 18%, but has advanced by 258% from top to bottom of range after double bottom on WEEKLY chart from May 2022 and the start of 2023.
- Earnings reactions mostly lower off 6.4, 2.5, and 3.5% on 8/2, 2/3, and 11/2/22 and rose 6.7% on 5/2.
- Enter on pullback into rising 50-day SMA following recent breakout.
- Entry MSTR 362. Stop 340.
Good luck.