An Apple a Day......
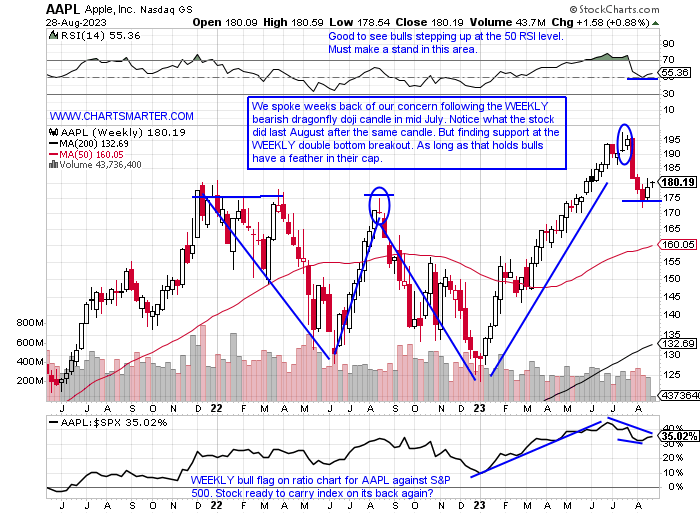
- Keeps the bears away? It is not a popular stance these days, which is why it should be taken note of. Sure seasonality is bearish this time of year traditionally until the end of Q3, and I am in the cautious camp myself but as market participants we need to be open to all possible scenarios. AAPL is a massive company, still the largest name on the planet even after hitting a speed bump recently. As it swam near the very round 200 number in late July it was a front cover story as it was the first publicly traded name to hit a $3 trillion dollar market cap, and we know those types of magazine headlines often see a stock make a top. But as technicians we focus solely on PRICE and Apple has made a stand right where it needed to. On the chart below notice how the 175 area was firm resistance between late 2021 and mid-2022, and now can be support. That 7% WEEKLY loss in the first week of August is certainly an eyesore, but the 175 area until it is broken to the downside should be viewed as constructive. Its daily chart broke below a bear flag but has now reversed higher and we know from FALSE moves come fast ones in the opposite direction.
Buy and "Chill":
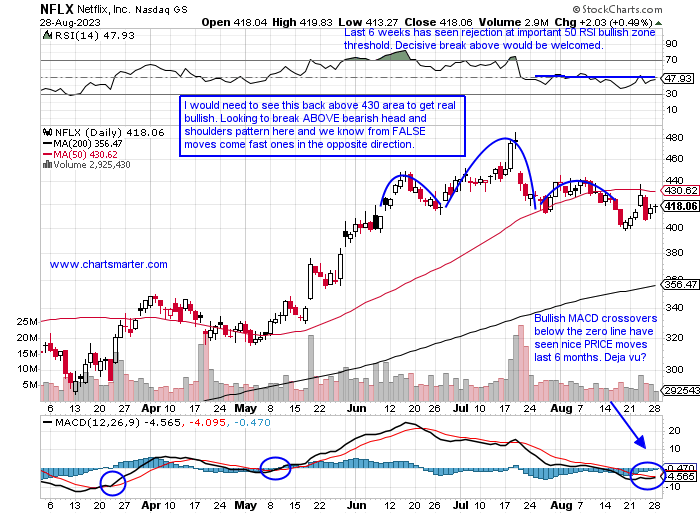
- The old adage goes "Time in the market beats timing the market". Of course, that is something for very long-term investors to adhere to, but the chart below of NFLX has some interesting technical takes. First I am a round-number theory guy and it is a possibility that the bullish counterattack candle on 8/18 at the very round 400 figure could mark a short-term low (the very round 700 number marked the high in November 2021). Currently, it is hovering right around the neckline at 420 in a bearish head and shoulders pattern, and if it can decisively break ABOVE that level could potentially witness a fast move from the failure of bears to see and follow through to the downside. All this being said it still needs to climb above its downward-sloping 50-day SMA, and if that occurs would set up a double bottom pivot of 443.67. Perhaps it is not the best comparison but NFLX is trading 14% off most recent 52-week highs, against DIS more than double that is a good sign for Netflix.
Recent Examples:
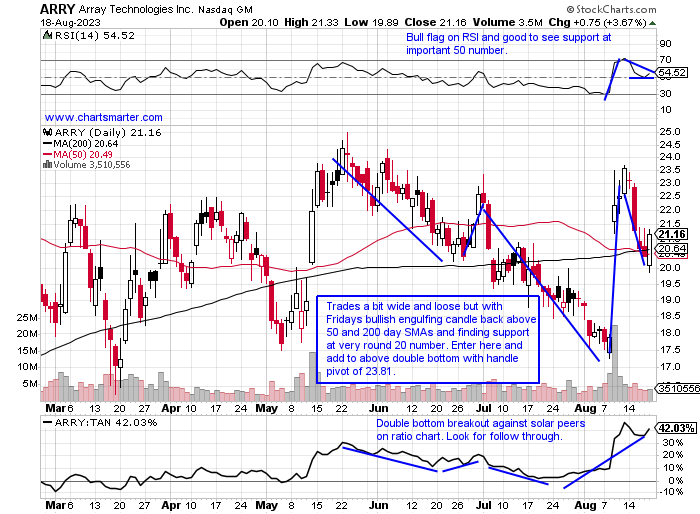
- The solar names have been burned, pun intended, with the TAN ETF still almost 40% off most recent 52-week highs, and a group that certainly did not get the sweeping technology rally memo. Among the large-cap names in the space, FSLR fell more than 11% in the week ending 8/18 and is still underneath the WEEKLY CLOSE. ENPH is on a 6-week losing streak, not a typo, and although it may be a triple bottom here near 120 from mid-2021 and early 2022 I have no interest in the name. SEDG is also on a 6-week losing streak and could be forming a WEEKLY bear flag. Below is an outlier in the group in ARRY and how it appeared in our 8/21 Technology Note. It trades just 7% from its most recent 52-week highs and is still making higher WEEKLY lows since last October as it forms a bullish ascending triangle. The stock is just 1% below the gigantic 31% advance the week ending 8/11 in enormous volume. Its refusal to give much back from that robust move is telling.
Special Situations:
Palo Alto Networks:
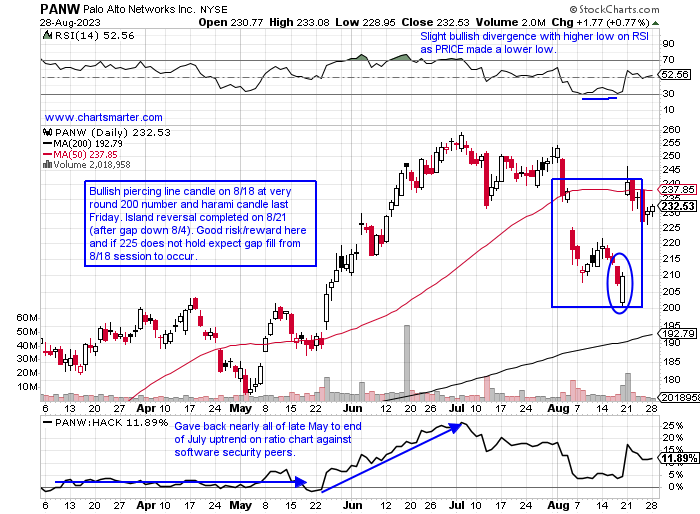
- Software security play up 67% YTD and 24% over last one year period.
- Name 10% off most recent 52-week highs and lower 5 of last 8 weeks, but did produce nice bounce off very round 200 number week ending 8/18 successfully retesting break above WEEKLY bull flag, whose pattern formed with the start of 2023.
- FOUR straight positive earnings reactions up 14.8, 7.7, 12.5, and 7% on 8/19, 5/24, 2/22, and 11/18/22.
- Enter after bullish island reversal.
- Entry PANW here. Stop 225.
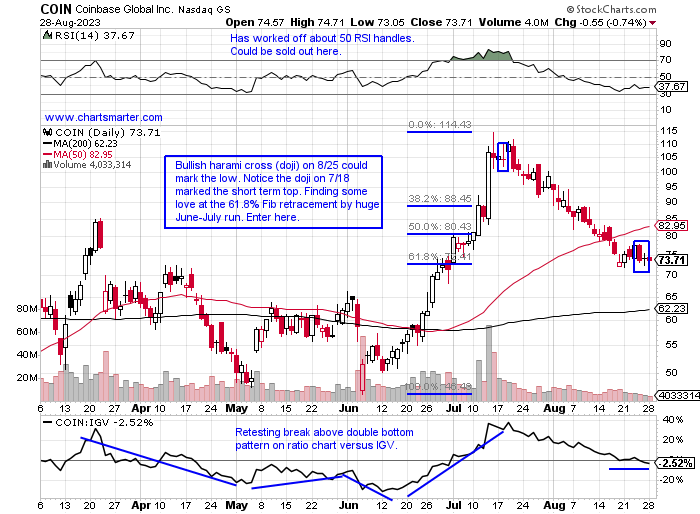
Coinbase:
- Software play up 108% YTD and 10% over last one year period.
- Name 36% off most recent 52-week highs and last week's minuscule gain of 1.5% put an end to the previous 5-week losing streak with all five CLOSING at lows for WEEKLY range. Volume has been somewhat orderly overall on the pullback.
- Earnings reactions mixed up 18.3 and 5.4% on 5/5 and 11/4/22 and fell 3.8 and 1.4% on 8/4 and 2/22.
- Enter after bullish harami cross/61.8% Fib retracement level.
- Entry COIN here. Stop 69.
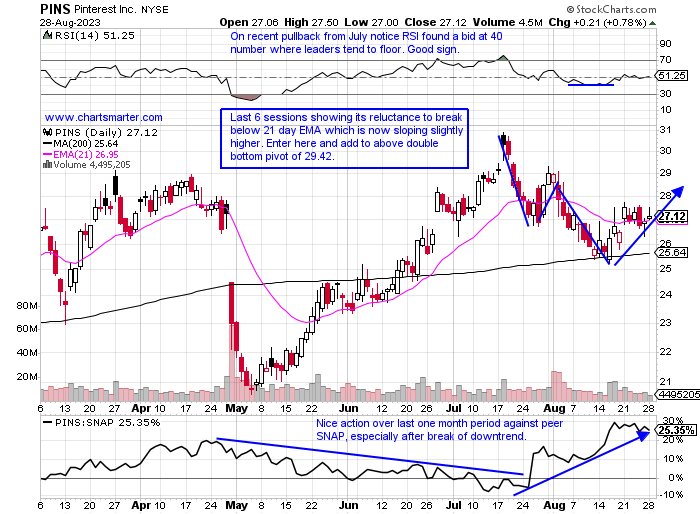
Pinterest:
- Social media play up 12% YTD and 18% over last one year period.
- Name 12% off most recent 52-week highs and has advanced 12 of last 16 weeks, albeit all 4 down weeks CLOSED on the lows for WEEKLY range. Big distribution weeks ending 2/10, 4/28, and 8/4 (all earnings weeks) fell 9.6, 16, and 6.3% each coming in the largest WEEKLY volume of 2023 thus far.
- Earnings reactions mostly lower off 3.8, 15.7, and 5.2% on 8/2, 4/27, and 2/7 after a gain of 13.7% 0n 10/28/22.
- Enter after break back above 21-day EMA.
- Entry PINS here. Stop 26.
Good luck.
Entry summaries:
Buy after bullish island reversal PANW here. Stop 225.
Buy after bullish harami cross/61.8% Fib retracement level COIN here. Stop 69.
Buy after break back above 21-day EMA PINS here. Stop 26.
This article requires a Chartsmarter membership. Please click here to join.
An Apple a Day......
- Keeps the bears away? It is not a popular stance these days, which is why it should be taken note of. Sure seasonality is bearish this time of year traditionally until the end of Q3, and I am in the cautious camp myself but as market participants we need to be open to all possible scenarios. AAPL is a massive company, still the largest name on the planet even after hitting a speed bump recently. As it swam near the very round 200 number in late July it was a front cover story as it was the first publicly traded name to hit a $3 trillion dollar market cap, and we know those types of magazine headlines often see a stock make a top. But as technicians we focus solely on PRICE and Apple has made a stand right where it needed to. On the chart below notice how the 175 area was firm resistance between late 2021 and mid-2022, and now can be support. That 7% WEEKLY loss in the first week of August is certainly an eyesore, but the 175 area until it is broken to the downside should be viewed as constructive. Its daily chart broke below a bear flag but has now reversed higher and we know from FALSE moves come fast ones in the opposite direction.
Buy and "Chill":
- The old adage goes "Time in the market beats timing the market". Of course, that is something for very long-term investors to adhere to, but the chart below of NFLX has some interesting technical takes. First I am a round-number theory guy and it is a possibility that the bullish counterattack candle on 8/18 at the very round 400 figure could mark a short-term low (the very round 700 number marked the high in November 2021). Currently, it is hovering right around the neckline at 420 in a bearish head and shoulders pattern, and if it can decisively break ABOVE that level could potentially witness a fast move from the failure of bears to see and follow through to the downside. All this being said it still needs to climb above its downward-sloping 50-day SMA, and if that occurs would set up a double bottom pivot of 443.67. Perhaps it is not the best comparison but NFLX is trading 14% off most recent 52-week highs, against DIS more than double that is a good sign for Netflix.
Recent Examples:
- The solar names have been burned, pun intended, with the TAN ETF still almost 40% off most recent 52-week highs, and a group that certainly did not get the sweeping technology rally memo. Among the large-cap names in the space, FSLR fell more than 11% in the week ending 8/18 and is still underneath the WEEKLY CLOSE. ENPH is on a 6-week losing streak, not a typo, and although it may be a triple bottom here near 120 from mid-2021 and early 2022 I have no interest in the name. SEDG is also on a 6-week losing streak and could be forming a WEEKLY bear flag. Below is an outlier in the group in ARRY and how it appeared in our 8/21 Technology Note. It trades just 7% from its most recent 52-week highs and is still making higher WEEKLY lows since last October as it forms a bullish ascending triangle. The stock is just 1% below the gigantic 31% advance the week ending 8/11 in enormous volume. Its refusal to give much back from that robust move is telling.
Special Situations:
Palo Alto Networks:
- Software security play up 67% YTD and 24% over last one year period.
- Name 10% off most recent 52-week highs and lower 5 of last 8 weeks, but did produce nice bounce off very round 200 number week ending 8/18 successfully retesting break above WEEKLY bull flag, whose pattern formed with the start of 2023.
- FOUR straight positive earnings reactions up 14.8, 7.7, 12.5, and 7% on 8/19, 5/24, 2/22, and 11/18/22.
- Enter after bullish island reversal.
- Entry PANW here. Stop 225.
Coinbase:
- Software play up 108% YTD and 10% over last one year period.
- Name 36% off most recent 52-week highs and last week's minuscule gain of 1.5% put an end to the previous 5-week losing streak with all five CLOSING at lows for WEEKLY range. Volume has been somewhat orderly overall on the pullback.
- Earnings reactions mixed up 18.3 and 5.4% on 5/5 and 11/4/22 and fell 3.8 and 1.4% on 8/4 and 2/22.
- Enter after bullish harami cross/61.8% Fib retracement level.
- Entry COIN here. Stop 69.
Pinterest:
- Social media play up 12% YTD and 18% over last one year period.
- Name 12% off most recent 52-week highs and has advanced 12 of last 16 weeks, albeit all 4 down weeks CLOSED on the lows for WEEKLY range. Big distribution weeks ending 2/10, 4/28, and 8/4 (all earnings weeks) fell 9.6, 16, and 6.3% each coming in the largest WEEKLY volume of 2023 thus far.
- Earnings reactions mostly lower off 3.8, 15.7, and 5.2% on 8/2, 4/27, and 2/7 after a gain of 13.7% 0n 10/28/22.
- Enter after break back above 21-day EMA.
- Entry PINS here. Stop 26.
Good luck.
Entry summaries:
Buy after bullish island reversal PANW here. Stop 225.
Buy after bullish harami cross/61.8% Fib retracement level COIN here. Stop 69.
Buy after break back above 21-day EMA PINS here. Stop 26.