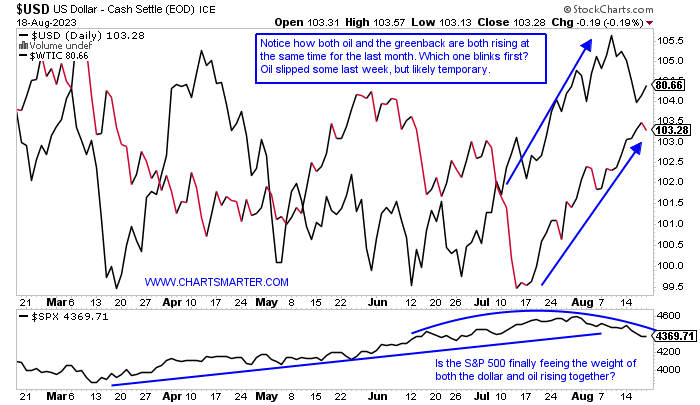
Dollar Dilemma:
- The greenback has been on an impressive run, with now a 5-week winning streak in place. Its previous runs in 2023 of 4 weeks in February and a 3-week streak in May quickly fizzled. Is that pattern going to play out once again? On its daily chart, it is running into resistance at its downward-sloping 200-day SMA. To its credit over the last one month, it has dropped just 6 sessions, and its RSI traveled from the oversold 30 to the overbought 70 in rapid fashion, which often sees further future PRICE runs. Looking at the chart below demonstrates an Intermarket relationship that has not acted as it traditionally would. Oil did blink somewhat last week, but with the group overall via the XLE, the best-acting major S&P sector over the last one and three-month periods, I think that will stabilize and resume its uptrend. The dollar on the other hand looks exhausted, although it seems like everyone is looking for a pullback there. It is no coincidence that the S&P 500 has started rolling over starting in August with both of these headwinds in place. Look for more of the same until Q4 gets underway and equities get their mojo back.
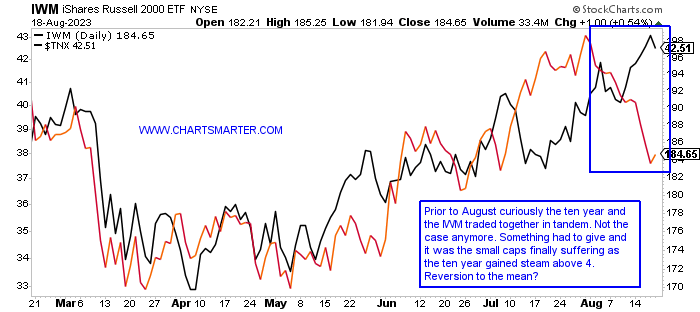
Size Matters:
- We often talk about how intermarket relationships do not always behave in their traditional manner, and that is where technical analysis comes into play. You do not act on something until the technical signal arrives. Notice how between March-August the 10-year and the IWM traded with a strong, unlikely correlation. The chart below displays the association between the 10-year rates and the IWM. We know the latter is more affected by interest rates as small caps are more sensitive as they require more financing. The IWM itself recorded a bullish piercing line candle Friday and it could be the start of a rally for the ETF. The small caps are known as leading indicators, and if one is bullish on them they most likely have a bearish stance on the 10-year. I am a fierce advocate of buying strength, ie what's working, and with the Nasdaq up 27% YTD and the Russell 2000 by just 6%, the small caps still have some work to do. That being said I think there is good risk/reward here with the IWM on the long side as long as it remains above 181.
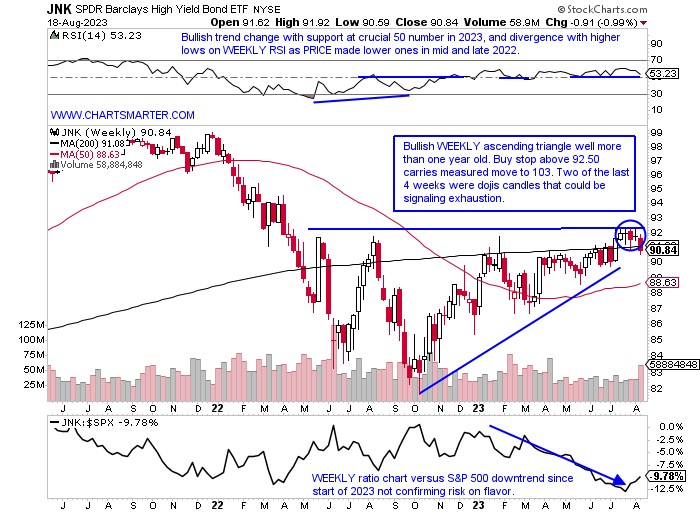
Risk Appetite:
- "Risk on" can be interpreted in many different ways in markets. One way is looking at the XLP to the XLY ratio chart to determine if consumers are spending on wants rather than needs. That is starting to turn up in the staple's favor which is a bit of concern. In fact, it is now showing a bullish inverse head and shoulders pattern in favor of the XLP. Below is yet another way market participants will gauge the risk appetite with the WEEKLY chart of the JNK, which has been repelled in this area just above the very round 90 number dating back to last spring. Last week fell 1% in the strongest WEEKLY volume in 4 months, and it lost its 200 WEEK SMA after spending 5 weeks above the secular line. Circled are two doji candles for the weeks ending 7/28 and 8/11 which could indicate some fatigue after it has run 10 handles from last October's lows. A move above 92 heading into year-end could be a good indication that the traditional rally for overall markets in Q4 is likely to kick off.
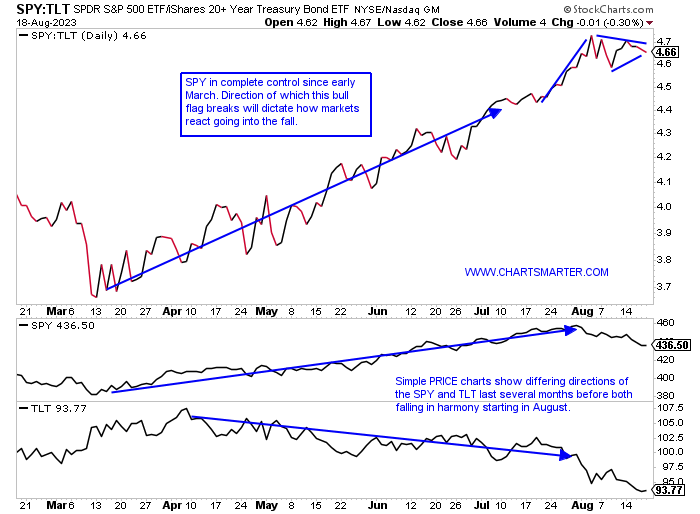
Revealing Ratio Chart:
- Yet another way to interpret how investors perceive market health is the chart below of the SPY:TLT ratio. If it is trending higher markets are generally in a good mood. One can see here that the SPY is firmly in control and we know that trends once in motion tend to remain that way, more likely than they are to reverse. A bull flag has formed and if this breaks LOWER we also know that from FALSE moves can come fast ones in the opposite direction. The SPY is on just its second 3-week losing streak of 2023, and each has been somewhat mild losing 4-5%. The February example did have a big shakeout a couple of weeks later slumping 4.5% the week ending 3/10, which prompted its ferocious run higher. The TLT looks sickly here now 18% off most recent 52-week highs and on a current 4-week losing streak with all four CLOSING at lows for the WEEKLY range. It has formed a bearish rounded top and a move back into the very round 90 number better hold. At the very least this should put a bid under interest rates moving higher.
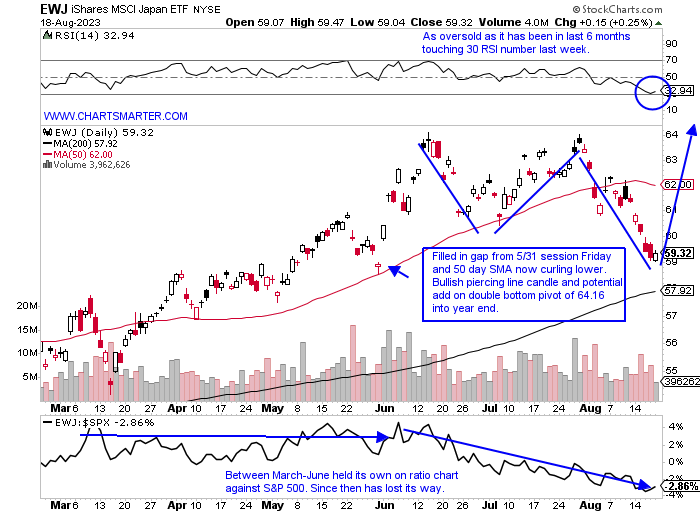
Land of the Rising Sun:
- Just a couple of months ago Japan was all rage as investors declared they were opening offices there. A sanguine approach has been backed up by improving economic conditions and more shareholder-friendly practices. Warren Buffett in June announced purchases in several of the country's largest trading houses. Hedge funds are reopening offices in Japan like Citadel and with all the positive vibes not surprisingly the headlines formed in conjunction with a top. Is that temporary? Of course, no one knows but the Nikkei recorded a doji candle on Thursday and a bullish inverted hammer candle Friday as a potential double bottom takes shape. Below is the chart of the EWJ which is on a 3-week losing streak like most other instruments (has fallen about half that of the FXI over the same time period) but the 200-day SMA is catching up in PRICE. Like anything else, it often pays to be patient when the media and investors are gushing like they were a few months back and let the dust settle. Japan may be worth a long look here as seasonality in September is quite "strong" relative to the S&P 500 over the last 5 years with a .2% return, compared with the S&P 500 down more than 4%). Let's take a look at the 2 largest names in the ETF below.
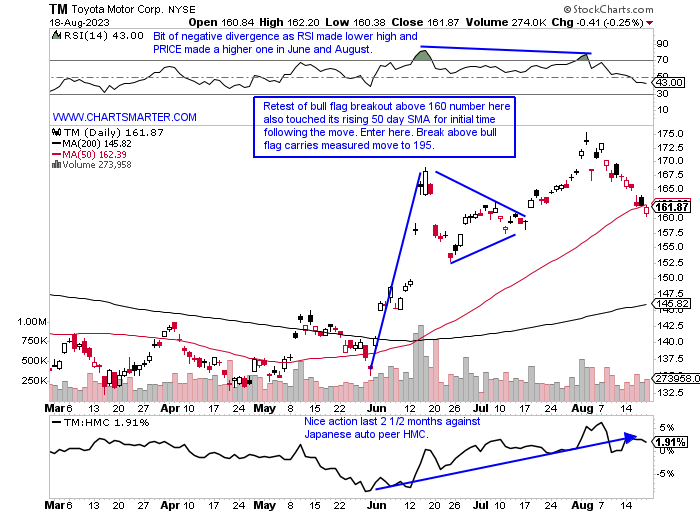
Toyota:
- Japanese auto play up 19% YTD and 2% over last one year period. Dividend yield of 2.6%.
- Name 8% off most recent 52-week highs and (TSLA F and GM are all more than 20% off their annual peaks) and last couple weeks could be building handle on WEEKLY cup base. Could be ready for a similar move doubling in PRICE on WEEKLY between March 2020-January 2022.
- Three straight positive earnings reactions up 2.1, 2, and .7% on 8/1, 5/10, and 2/9 after a loss of 2.6% on 11/1/22.
- Enter on first test of rising 50-day SMA following recent breakout.
- Entry TM here. Stop 157.
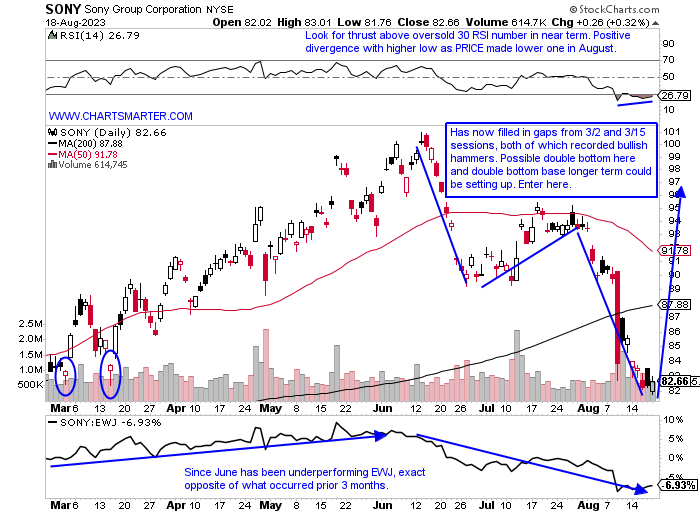
Sony Group:
- Japanese "old tech" play up 8% YTD and down 5% over last one year period. Dividend yield of .7%.
- Name 18% off most recent 52-week highs and current 3-week losing streak has fallen by a combined 12%. Weakness ensued following rejection at very round par number in June.
- Earnings reactions mixed up 4.7 and 9.7% on 2/2 and 11/1/22 before losses of 6.6 and 5.7% on 8/9 and 4/28.
- Enter on gap fill/double bottom potential.
- Entry SONY here. Stop 78.50.
Good luck.
This article requires a Chartsmarter membership. Please click here to join.
Dollar Dilemma:
- The greenback has been on an impressive run, with now a 5-week winning streak in place. Its previous runs in 2023 of 4 weeks in February and a 3-week streak in May quickly fizzled. Is that pattern going to play out once again? On its daily chart, it is running into resistance at its downward-sloping 200-day SMA. To its credit over the last one month, it has dropped just 6 sessions, and its RSI traveled from the oversold 30 to the overbought 70 in rapid fashion, which often sees further future PRICE runs. Looking at the chart below demonstrates an Intermarket relationship that has not acted as it traditionally would. Oil did blink somewhat last week, but with the group overall via the XLE, the best-acting major S&P sector over the last one and three-month periods, I think that will stabilize and resume its uptrend. The dollar on the other hand looks exhausted, although it seems like everyone is looking for a pullback there. It is no coincidence that the S&P 500 has started rolling over starting in August with both of these headwinds in place. Look for more of the same until Q4 gets underway and equities get their mojo back.
Size Matters:
- We often talk about how intermarket relationships do not always behave in their traditional manner, and that is where technical analysis comes into play. You do not act on something until the technical signal arrives. Notice how between March-August the 10-year and the IWM traded with a strong, unlikely correlation. The chart below displays the association between the 10-year rates and the IWM. We know the latter is more affected by interest rates as small caps are more sensitive as they require more financing. The IWM itself recorded a bullish piercing line candle Friday and it could be the start of a rally for the ETF. The small caps are known as leading indicators, and if one is bullish on them they most likely have a bearish stance on the 10-year. I am a fierce advocate of buying strength, ie what's working, and with the Nasdaq up 27% YTD and the Russell 2000 by just 6%, the small caps still have some work to do. That being said I think there is good risk/reward here with the IWM on the long side as long as it remains above 181.
Risk Appetite:
- "Risk on" can be interpreted in many different ways in markets. One way is looking at the XLP to the XLY ratio chart to determine if consumers are spending on wants rather than needs. That is starting to turn up in the staple's favor which is a bit of concern. In fact, it is now showing a bullish inverse head and shoulders pattern in favor of the XLP. Below is yet another way market participants will gauge the risk appetite with the WEEKLY chart of the JNK, which has been repelled in this area just above the very round 90 number dating back to last spring. Last week fell 1% in the strongest WEEKLY volume in 4 months, and it lost its 200 WEEK SMA after spending 5 weeks above the secular line. Circled are two doji candles for the weeks ending 7/28 and 8/11 which could indicate some fatigue after it has run 10 handles from last October's lows. A move above 92 heading into year-end could be a good indication that the traditional rally for overall markets in Q4 is likely to kick off.
Revealing Ratio Chart:
- Yet another way to interpret how investors perceive market health is the chart below of the SPY:TLT ratio. If it is trending higher markets are generally in a good mood. One can see here that the SPY is firmly in control and we know that trends once in motion tend to remain that way, more likely than they are to reverse. A bull flag has formed and if this breaks LOWER we also know that from FALSE moves can come fast ones in the opposite direction. The SPY is on just its second 3-week losing streak of 2023, and each has been somewhat mild losing 4-5%. The February example did have a big shakeout a couple of weeks later slumping 4.5% the week ending 3/10, which prompted its ferocious run higher. The TLT looks sickly here now 18% off most recent 52-week highs and on a current 4-week losing streak with all four CLOSING at lows for the WEEKLY range. It has formed a bearish rounded top and a move back into the very round 90 number better hold. At the very least this should put a bid under interest rates moving higher.
Land of the Rising Sun:
- Just a couple of months ago Japan was all rage as investors declared they were opening offices there. A sanguine approach has been backed up by improving economic conditions and more shareholder-friendly practices. Warren Buffett in June announced purchases in several of the country's largest trading houses. Hedge funds are reopening offices in Japan like Citadel and with all the positive vibes not surprisingly the headlines formed in conjunction with a top. Is that temporary? Of course, no one knows but the Nikkei recorded a doji candle on Thursday and a bullish inverted hammer candle Friday as a potential double bottom takes shape. Below is the chart of the EWJ which is on a 3-week losing streak like most other instruments (has fallen about half that of the FXI over the same time period) but the 200-day SMA is catching up in PRICE. Like anything else, it often pays to be patient when the media and investors are gushing like they were a few months back and let the dust settle. Japan may be worth a long look here as seasonality in September is quite "strong" relative to the S&P 500 over the last 5 years with a .2% return, compared with the S&P 500 down more than 4%). Let's take a look at the 2 largest names in the ETF below.
Toyota:
- Japanese auto play up 19% YTD and 2% over last one year period. Dividend yield of 2.6%.
- Name 8% off most recent 52-week highs and (TSLA F and GM are all more than 20% off their annual peaks) and last couple weeks could be building handle on WEEKLY cup base. Could be ready for a similar move doubling in PRICE on WEEKLY between March 2020-January 2022.
- Three straight positive earnings reactions up 2.1, 2, and .7% on 8/1, 5/10, and 2/9 after a loss of 2.6% on 11/1/22.
- Enter on first test of rising 50-day SMA following recent breakout.
- Entry TM here. Stop 157.
Sony Group:
- Japanese "old tech" play up 8% YTD and down 5% over last one year period. Dividend yield of .7%.
- Name 18% off most recent 52-week highs and current 3-week losing streak has fallen by a combined 12%. Weakness ensued following rejection at very round par number in June.
- Earnings reactions mixed up 4.7 and 9.7% on 2/2 and 11/1/22 before losses of 6.6 and 5.7% on 8/9 and 4/28.
- Enter on gap fill/double bottom potential.
- Entry SONY here. Stop 78.50.
Good luck.