"It's the basics that make you brilliant." - Darren Cahill
Rates Matter:
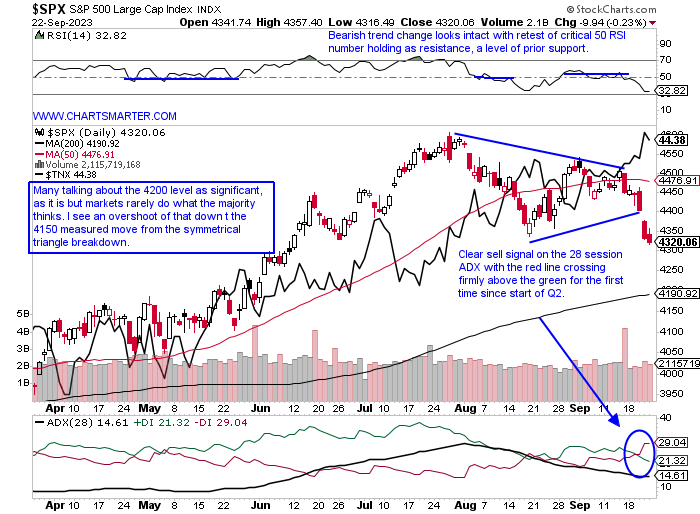
- The S&P 500 broke below the 8/18 lows last week and the rough 4350 level, which everyone ad nauseam has been talking about as the bearish head and shoulders breakdown. I see it as the symmetrical triangle break, and interestingly both patterns would have a measured move to the 4150 area. The 10-year rate, which is the solid black line on the chart below, is starting to diverge in PRICE from the S&P 500 which until late August climbed in tandem basically. The 7/27 session reversed hard right at the very round 4600 number when the 10-year yield first hit the very round 4% number, and it has felt heavy ever since. Last week fell almost 3% its largest WEEKLY loss since the week ending 3/10 and notice how the widely watched benchmark has fallen 6 of the last 8 weeks, with all six CLOSING at the lows for the WEEKLY range beginning with the bearish engulfing candle the week ending 8/4. Its 50-day SMA is curling lower for the first time since last November and with rates on the ascent, this pullback could be ready to pick up some steam.
Magnetic Round Number Sprint?
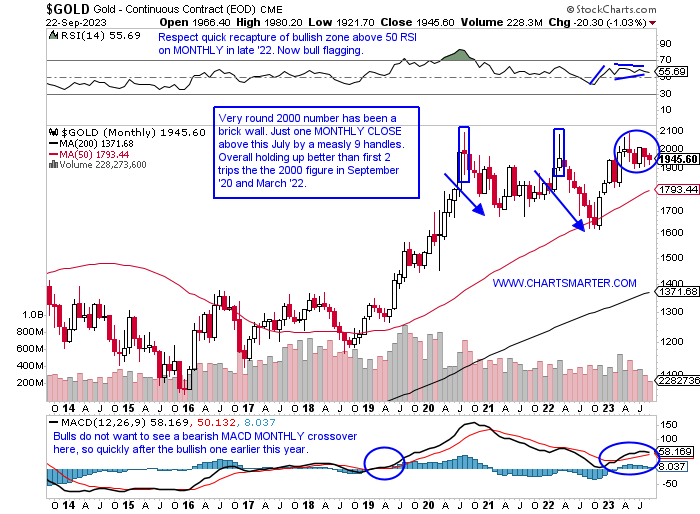
- Will Gold Bugs finally get a chance to rejoice? I have never been involved in a meaningful way with the glittery metal, and this is simply an observation, but It feels like it could be ready for a potential beach ball held underwater moment. I make this statement as this time around at the very round 2000 number it is showing much better resilience. Notice on the MONTHLY chart below how quickly it retreated from the level after a long spinning top candle in September 2020 and a bearish shooting star in March 2022. The 2021 example slipped back toward 1700 and 2022 to 1600. This time around it is trading in a tight range between 1900-2000, and the last 6 months have been above 2000, albeit with just one CLOSE above. If market conditions deteriorate quickly here could gold make a sprint next week toward the number once again into the end of the month? I would not rule it out, although bulls do not want to see a bearish MACD crossover here. It recorded a bullish one earlier in 2023, its first since 2019 when the PRICE started a firm uptrend.
Tide Turning?
- Investors in Chinese equities must have similar feelings to biotech traders. Seemingly always being let down, as each time a decent move to the upside is about to appear, a rug gets pulled from under their feet. The KWEB is now nearly down one-quarter of its value from its most recent 52-week highs, but give it some credit as Friday completed a bullish island reversal and the last 3 weeks have all CLOSED very taut within just .21 of each other. We know that type of coiling action leads to powerful moves, and to be frank I would not be surprised in which direction it went. When we compare it to our domestic internet rivals in the FDN (which fell 5% last week, its largest WEEKLY loss in more than 6 months) KWEB showed decent relative strength slipping less than 1%. Favorite names in the fund include PDD which has a nice look on the WEEKLY chart as it can be interpreted as a cup or bull flag. Either way a WEEKLY CLOSE above the very round par number, which it was above intraweek each of the last 3 weeks but recorded zero CLOSES above would be very bullish. A move to 125 would then not be out of the question into year-end.

Energy Strength Inkling:
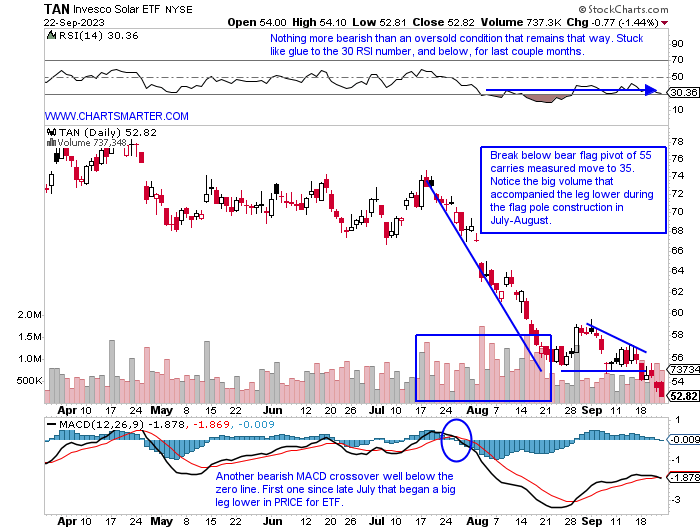
- There are select groups that can not blame the overall market's frailty for their demise. One that could be the poster boy for that statement is the solar group. The TAN ETF below is now a whopping 37% off its most recent 52-week highs and it has declined 7 of the last 9 weeks, with 5 of the down weeks off at least 4%. In my opinion, this is a sign that the energy rally is still intact, and likely to firm into year-end. Solar stocks used to catch a bid when crude PRICES accelerated higher and that is just not the case anymore. Of course, it will not be a straight line up for the XLE, but the PRICE action in TAN is saying it is just not competitive with energy. This week's break below a bear flag will most likely be the start of another waterfall lower, and there is a quote I love "Never confuse the bottom of a chart with support." Not surprisingly round number theory came into play for the TAN with a rejection at par in November 2021, with a couple of WEEKLY bearish hanging man candles. And the big break lower from the symmetrical triangle does not bode well either. The top 2 holdings in the fund ENPH and SEDG are more than 60% off their annual peaks.
REIT Anxiety:
- The REIT group has been under pressure with the XLRE now one of 5 major S&P sectors in the red on a YTD basis so far with basically one quarter left in 2023. Notice it is the more defensive groups often where investors go to seek the safety of comfortable dividends. But that has been thwarted by the rise in interest rates. As yields on the 5, 10, and 30-year all hit highs this week not seen in at least 10 years. The diverse nature of the XLRE group though has some names acting better than others. Of course, with the recent weakness in the fund, there will be plenty of laggards to select from. O for example has declined 8 of the last 9 weeks with all 9 CLOSING at or in the lower half of the WEEKLY range. DOUG, my namesake, recorded just one WEEKLY CLOSE above the very round 10 number, the first week it came public and has been in a nasty decline ever since. Some interesting plays include IIPR which facilitates marijuana production and the group witnessed a buzz with the MSOS more than doubling before hitting a brick wall at the very round 10 number on recording a bearish filled-in black candlestick on 9/15 (I would not recommend that ETF). IIPR could start a range between 80-90 numbers. Let's be balanced and take a look at a couple of REITS that could accommodate a bullish or bearish bias below.

St Joe Corp:
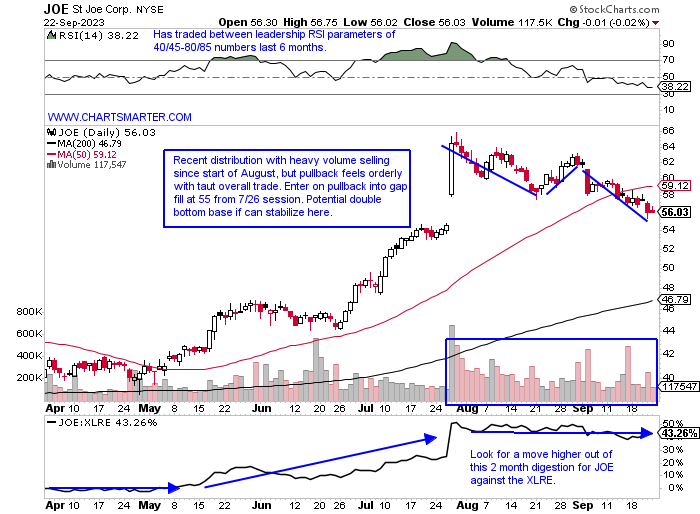
- REIT play up 45% YTD and 71% over last one year period. Dividend yield of .8%.
- Name 15% off most recent 52-week highs and is lower 5 of the last 8 weeks, acceptable given that stock doubled in PRICE from last October to this July. Now on just the second 3-week losing streak in last one-year period.
- Earnings reactions mixed up 18.1 and .7% on 7/27 and 4/27 and fell 2 and .7% on 2/22 and 10/27/22.
- Enter on pullback into gap fill.
- Entry JOE 55. Stop 52.
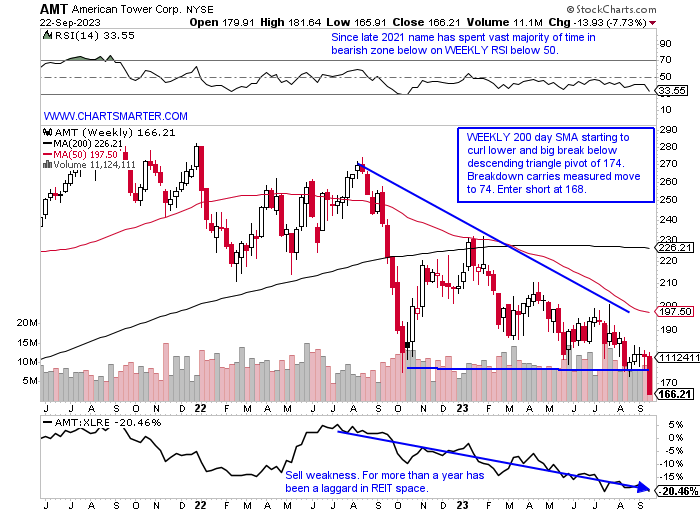
American Tower Corp:
- REIT play down 22% YTD and 29% over last one year period. Dividend yield of 3.9%.
- Name 29% off most recent 52-week highs and last week slumped 7.7% its largest WEEKLY loss in one year. Broke below 3-week tight pattern this week with the 3 weeks ending between 9/1-15 all CLOSING within just .75 of each other.
- Earnings reactions mostly higher up 1.7, 1.3, and .9% on 7/27, 2/23, and 10/27/22, and fell .7% on 4/26.
- Enter short with break below WEEKLY descending triangle.
- Entry AMT 168. Buy stop 181.
Good luck.
This article requires a Chartsmarter membership. Please click here to join.
"It's the basics that make you brilliant." - Darren Cahill
Rates Matter:
- The S&P 500 broke below the 8/18 lows last week and the rough 4350 level, which everyone ad nauseam has been talking about as the bearish head and shoulders breakdown. I see it as the symmetrical triangle break, and interestingly both patterns would have a measured move to the 4150 area. The 10-year rate, which is the solid black line on the chart below, is starting to diverge in PRICE from the S&P 500 which until late August climbed in tandem basically. The 7/27 session reversed hard right at the very round 4600 number when the 10-year yield first hit the very round 4% number, and it has felt heavy ever since. Last week fell almost 3% its largest WEEKLY loss since the week ending 3/10 and notice how the widely watched benchmark has fallen 6 of the last 8 weeks, with all six CLOSING at the lows for the WEEKLY range beginning with the bearish engulfing candle the week ending 8/4. Its 50-day SMA is curling lower for the first time since last November and with rates on the ascent, this pullback could be ready to pick up some steam.
Magnetic Round Number Sprint?
- Will Gold Bugs finally get a chance to rejoice? I have never been involved in a meaningful way with the glittery metal, and this is simply an observation, but It feels like it could be ready for a potential beach ball held underwater moment. I make this statement as this time around at the very round 2000 number it is showing much better resilience. Notice on the MONTHLY chart below how quickly it retreated from the level after a long spinning top candle in September 2020 and a bearish shooting star in March 2022. The 2021 example slipped back toward 1700 and 2022 to 1600. This time around it is trading in a tight range between 1900-2000, and the last 6 months have been above 2000, albeit with just one CLOSE above. If market conditions deteriorate quickly here could gold make a sprint next week toward the number once again into the end of the month? I would not rule it out, although bulls do not want to see a bearish MACD crossover here. It recorded a bullish one earlier in 2023, its first since 2019 when the PRICE started a firm uptrend.
Tide Turning?
- Investors in Chinese equities must have similar feelings to biotech traders. Seemingly always being let down, as each time a decent move to the upside is about to appear, a rug gets pulled from under their feet. The KWEB is now nearly down one-quarter of its value from its most recent 52-week highs, but give it some credit as Friday completed a bullish island reversal and the last 3 weeks have all CLOSED very taut within just .21 of each other. We know that type of coiling action leads to powerful moves, and to be frank I would not be surprised in which direction it went. When we compare it to our domestic internet rivals in the FDN (which fell 5% last week, its largest WEEKLY loss in more than 6 months) KWEB showed decent relative strength slipping less than 1%. Favorite names in the fund include PDD which has a nice look on the WEEKLY chart as it can be interpreted as a cup or bull flag. Either way a WEEKLY CLOSE above the very round par number, which it was above intraweek each of the last 3 weeks but recorded zero CLOSES above would be very bullish. A move to 125 would then not be out of the question into year-end.
Energy Strength Inkling:
- There are select groups that can not blame the overall market's frailty for their demise. One that could be the poster boy for that statement is the solar group. The TAN ETF below is now a whopping 37% off its most recent 52-week highs and it has declined 7 of the last 9 weeks, with 5 of the down weeks off at least 4%. In my opinion, this is a sign that the energy rally is still intact, and likely to firm into year-end. Solar stocks used to catch a bid when crude PRICES accelerated higher and that is just not the case anymore. Of course, it will not be a straight line up for the XLE, but the PRICE action in TAN is saying it is just not competitive with energy. This week's break below a bear flag will most likely be the start of another waterfall lower, and there is a quote I love "Never confuse the bottom of a chart with support." Not surprisingly round number theory came into play for the TAN with a rejection at par in November 2021, with a couple of WEEKLY bearish hanging man candles. And the big break lower from the symmetrical triangle does not bode well either. The top 2 holdings in the fund ENPH and SEDG are more than 60% off their annual peaks.
REIT Anxiety:
- The REIT group has been under pressure with the XLRE now one of 5 major S&P sectors in the red on a YTD basis so far with basically one quarter left in 2023. Notice it is the more defensive groups often where investors go to seek the safety of comfortable dividends. But that has been thwarted by the rise in interest rates. As yields on the 5, 10, and 30-year all hit highs this week not seen in at least 10 years. The diverse nature of the XLRE group though has some names acting better than others. Of course, with the recent weakness in the fund, there will be plenty of laggards to select from. O for example has declined 8 of the last 9 weeks with all 9 CLOSING at or in the lower half of the WEEKLY range. DOUG, my namesake, recorded just one WEEKLY CLOSE above the very round 10 number, the first week it came public and has been in a nasty decline ever since. Some interesting plays include IIPR which facilitates marijuana production and the group witnessed a buzz with the MSOS more than doubling before hitting a brick wall at the very round 10 number on recording a bearish filled-in black candlestick on 9/15 (I would not recommend that ETF). IIPR could start a range between 80-90 numbers. Let's be balanced and take a look at a couple of REITS that could accommodate a bullish or bearish bias below.
St Joe Corp:
- REIT play up 45% YTD and 71% over last one year period. Dividend yield of .8%.
- Name 15% off most recent 52-week highs and is lower 5 of the last 8 weeks, acceptable given that stock doubled in PRICE from last October to this July. Now on just the second 3-week losing streak in last one-year period.
- Earnings reactions mixed up 18.1 and .7% on 7/27 and 4/27 and fell 2 and .7% on 2/22 and 10/27/22.
- Enter on pullback into gap fill.
- Entry JOE 55. Stop 52.
American Tower Corp:
- REIT play down 22% YTD and 29% over last one year period. Dividend yield of 3.9%.
- Name 29% off most recent 52-week highs and last week slumped 7.7% its largest WEEKLY loss in one year. Broke below 3-week tight pattern this week with the 3 weeks ending between 9/1-15 all CLOSING within just .75 of each other.
- Earnings reactions mostly higher up 1.7, 1.3, and .9% on 7/27, 2/23, and 10/27/22, and fell .7% on 4/26.
- Enter short with break below WEEKLY descending triangle.
- Entry AMT 168. Buy stop 181.
Good luck.