Dangerous Doji:
- As the market feels heavy currently, I thought I may share in retrospect how I look for potential topping formations in stocks. There is a variety of ways to do it, and sure it is easy to Monday morning quarterback. But this in the future could help to look for certain candlesticks that should put one on alert to at the very least trim positions, if not sell completely. I share 6 examples here of the doji candle and circled each one so everyone could visualize what it looks like. These candles are often adept at signaling possible changes in the prevailing direction. All of them were preceded by uptrends, so they were a clue to minimize holdings and wait one a better future entry. These work in both up and downtrends (NVDA is a possible example as Friday recorded a doji candle after a 100 handle decline. These are very rare and indicate uncertainty and have the same opening and CLOSING PRICES. Let's take a look at several illustrations.
Coinbase:
This software play is now 38% off the most recent 52-week highs following the doji candle on 7/18. Notice it may not work right away but if one witnesses other bearish candles in quick succession that could add to the bearish narrative.

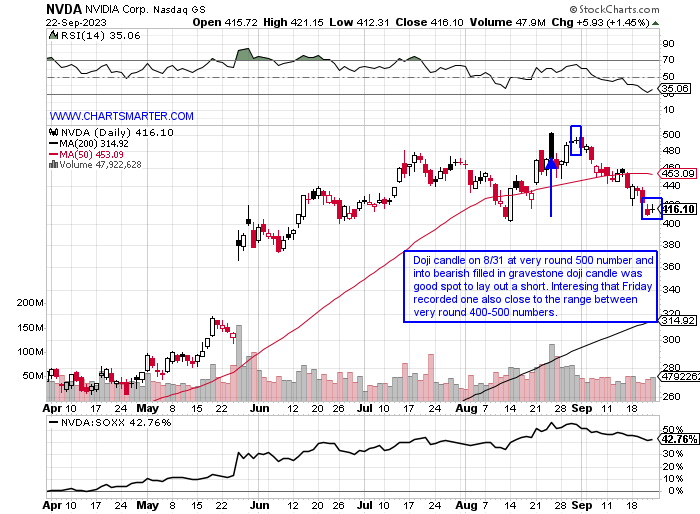
Nvidia:
Perhaps the most watched stock of all with AAPL, recorded a doji candle at the very round 500 number on 8/31 and a bearish engulfing candle the very next session. Will be interesting to see if it can find bids after Friday's doji candle here.
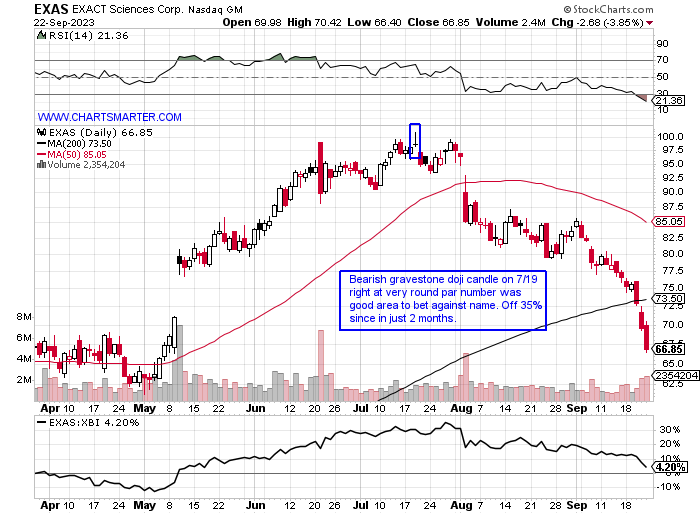
EXACT Sciences:
Biotech play formed a doji candle in conjunction with the very round par number that enhanced the negative narrative. It lost its 200-day SMA and the gap filled from early May did not see buyers come to its defense.
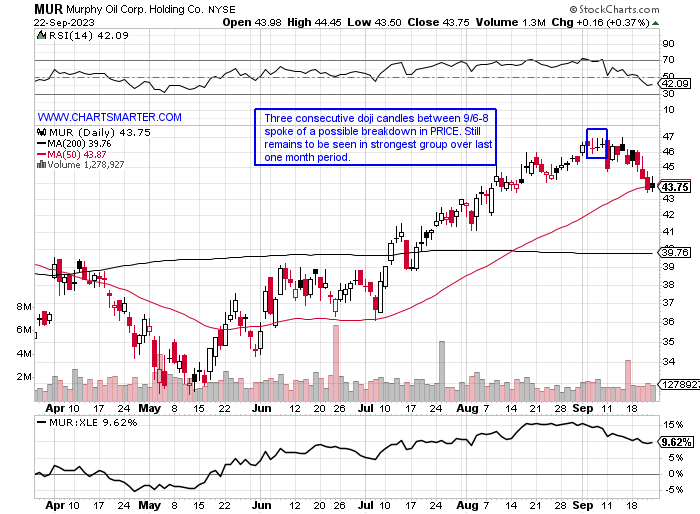
Murphy Oil:
This energy play has yet to see any meaningful weakness after the 3 straight doji candles from 9/6-8. It may be forming a WEEKLY cup with handle pattern almost a year in duration if it can stabilize here at 50-day SMA support.
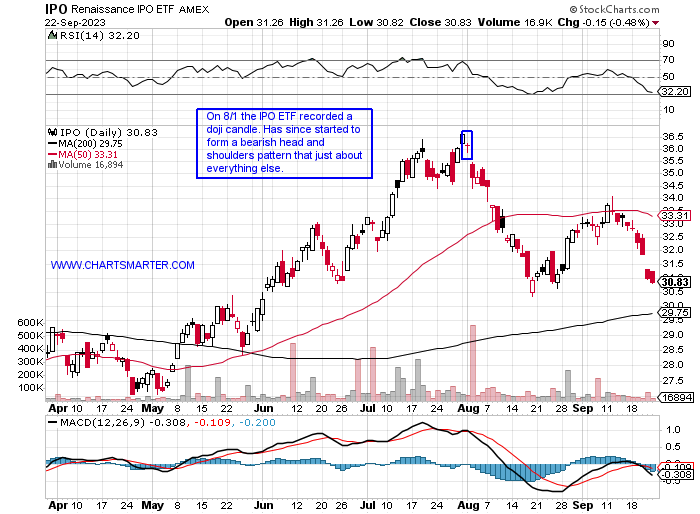
Renaissance IPO ETF:
The doji candle will work on any instrument that trades and the IPO ETF registered a doji on the first day of August. It dropped more than 6% last week its second-largest WEEKLY loss in 2023, even with anticipated offerings of ARM and CART that are both 30% from their opening-day highs.
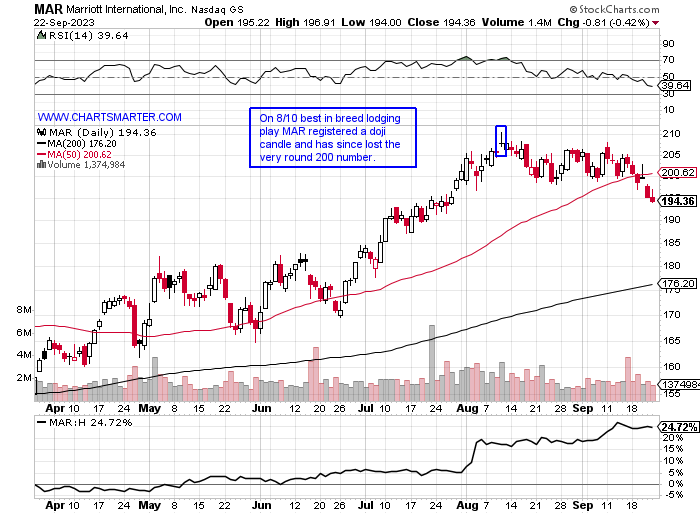
Marriott:
This name is just 8% off the most recent 52-week highs even with falling 5 of the last 6 weeks. Losing the very round 200 number could see additional momentum to the downside in the near term.
- Watch for these candles to form at extremes after sizable moves to the up or downside. They at the very least offer good risk/reward scenarios to play against. And like anything else nothing works all the time and if a stock ignores the doji and continues to power higher or slump lower afterward that could be a powerful sign that the overall underlying trend is very potent.
Good luck.
Dangerous Doji:
- As the market feels heavy currently, I thought I may share in retrospect how I look for potential topping formations in stocks. There is a variety of ways to do it, and sure it is easy to Monday morning quarterback. But this in the future could help to look for certain candlesticks that should put one on alert to at the very least trim positions, if not sell completely. I share 6 examples here of the doji candle and circled each one so everyone could visualize what it looks like. These candles are often adept at signaling possible changes in the prevailing direction. All of them were preceded by uptrends, so they were a clue to minimize holdings and wait one a better future entry. These work in both up and downtrends (NVDA is a possible example as Friday recorded a doji candle after a 100 handle decline. These are very rare and indicate uncertainty and have the same opening and CLOSING PRICES. Let's take a look at several illustrations.
Coinbase:
This software play is now 38% off the most recent 52-week highs following the doji candle on 7/18. Notice it may not work right away but if one witnesses other bearish candles in quick succession that could add to the bearish narrative.
Nvidia:
Perhaps the most watched stock of all with AAPL, recorded a doji candle at the very round 500 number on 8/31 and a bearish engulfing candle the very next session. Will be interesting to see if it can find bids after Friday's doji candle here.
EXACT Sciences:
Biotech play formed a doji candle in conjunction with the very round par number that enhanced the negative narrative. It lost its 200-day SMA and the gap filled from early May did not see buyers come to its defense.
Murphy Oil:
This energy play has yet to see any meaningful weakness after the 3 straight doji candles from 9/6-8. It may be forming a WEEKLY cup with handle pattern almost a year in duration if it can stabilize here at 50-day SMA support.
Renaissance IPO ETF:
The doji candle will work on any instrument that trades and the IPO ETF registered a doji on the first day of August. It dropped more than 6% last week its second-largest WEEKLY loss in 2023, even with anticipated offerings of ARM and CART that are both 30% from their opening-day highs.
Marriott:
This name is just 8% off the most recent 52-week highs even with falling 5 of the last 6 weeks. Losing the very round 200 number could see additional momentum to the downside in the near term.
- Watch for these candles to form at extremes after sizable moves to the up or downside. They at the very least offer good risk/reward scenarios to play against. And like anything else nothing works all the time and if a stock ignores the doji and continues to power higher or slump lower afterward that could be a powerful sign that the overall underlying trend is very potent.
Good luck.