"Tortoises can tell you more about the road than hares."
Walking the Tightrope:
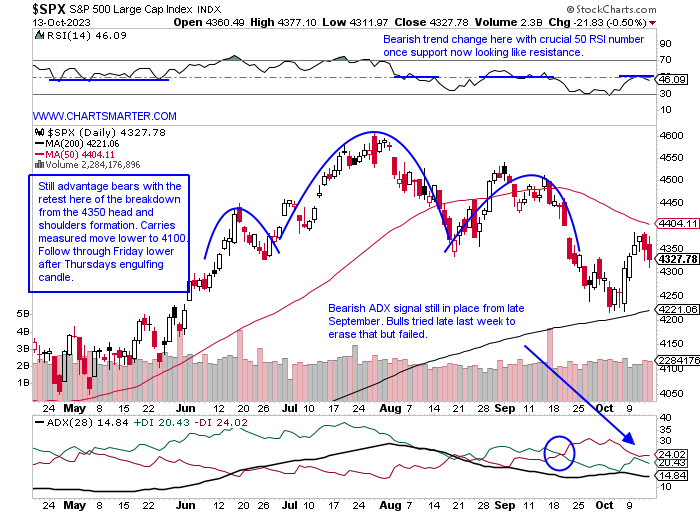
- The S&P 500, the most widely watched benchmark on the planet, looked poised for a solid week until the Thursday and Friday sessions dampened that belief. It is not how you start but how you finish, and the moves to end the week falling .6 and .5% may have looked pedestrian but technically there were some flaws. First, we filled in the upside gap on 10/10 from 9/20, and keep in mind gaps on indexes are somewhat rare. For example, the S&P 500 filled one on 7/6 from the 6/29 session before ramping higher by more than 200 handles (notice how on the bottom of that chart as well the number of stocks above their 50-day SMAs on the index has been in decline mode since late July). If one looks a little closer the intraday reversal on Tuesday produced a bearish shooting star that would have completed a bullish three white soldiers formation, and Wednesday a hanging man candle. The bounce of 4200 was one of the most telegraphed that I can remember, and my feeling is we can touch the 4100 area, measured move lower from the head and shoulders before we attempt the next leg up.
Gold a Safe Haven Again?
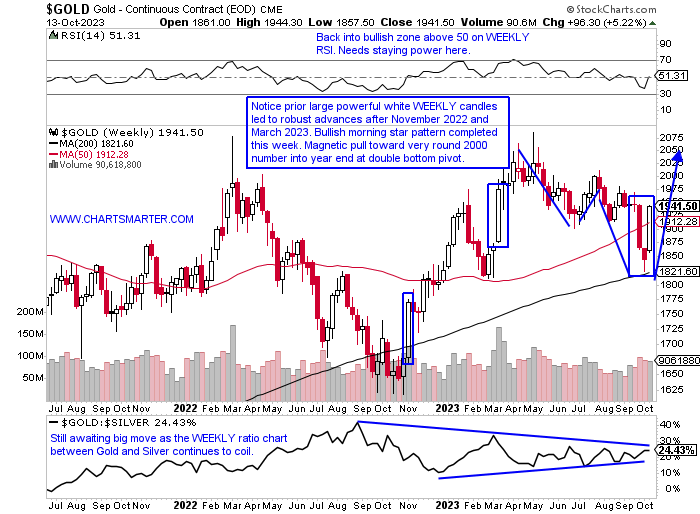
- Is gold going to be acting like the safe haven it was once thought of? Of course, that is a weak stab at humor but the precious metal recently has not responded the way it normally would have, and was the huge response Friday saying that something more ominous is on the horizon? We spoke of gold being alluring in our Week Ahead Note last week, but were we certainly not expecting the move we witnessed. Gold recorded its best week since March and notice the last 2 times it recorded large long bullish WEEKLY white candlesticks in November 2022 and March 2023 saw further PRICE advances. Of course, the November example was stronger, but even the March candle saw a quick 100-handle run to the highs in early May. It feels like there wants to be a push toward the very round 2000 figure where a double bottom pattern pivot lies, and on a WEEKLY CLOSING basis that area has seen forceful rejections. The bullish morning star pattern last week suggests another test of that level is likely. The road will be bumpy but I think it gets there sometime in 2023.
China Floundering:
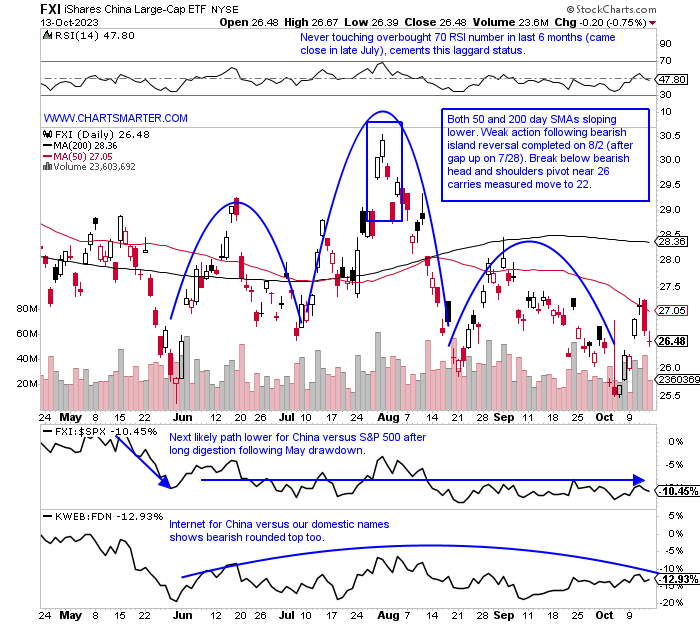
- Give the FXI credit as it is attempting to break ABOVE a bearish head and shoulders pattern as we know from FALSE moves come fast ones in the opposite direction, but the rebuttal at the 50-day SMA last Wednesday and then the bearish engulfing candle Thursday make it probable that the downtrend will resume. The weakness began right at the round 30 number this summer and it has been soft as it now trades more than 20% off most recent 52-week highs, while the S&P 500 is just 6% from its annual peak (this chart shows the bifurcation began around the start of Q2). Expect that relationship to continue, even if the S&P 500 does start to fall, as it will likely sink greater than our benchmark. We also included a ratio chart below comparing the KWEB to the FDN. Although the 3 month time periods are similar for the two on a YTD it is no contest with the KWEB down 10% and the FDN up 28%. BABA, the 2nd largest holding in the KWEB, has been a drag (top holding PDD has been strong), and lining it up against META and GOOGL which are in the top 3 of the FDN have been standouts in 2023.
Liquidity Crisis:
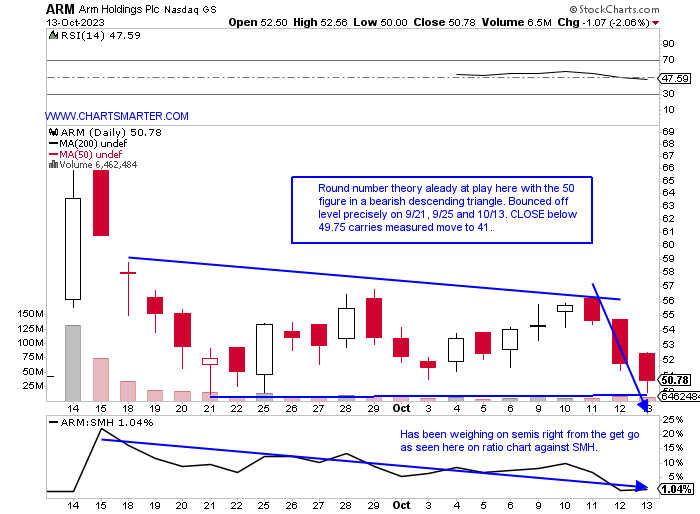
- The 30-year bond auction on Thursday was key as before that the market had basically shrugged off the CPI data much like it did to start the week with the Middle East as it was climbing the proverbial wall of worry. Demand was the reason for the disappointment, and can one overlay that with the action in some recent new issues. These names were acting weak before the recent market frailty and is that a question of them being mispriced at the offering, again no liquidity, or something more sinister? No one knows the real answer, and it is probably a combination of all three, but one thing for certain that we can gauge it upon is PRICE action. Spinoffs like KVUE are now down 15 of the last 21 weeks (VLTO from DHR recorded its second straight 8% WEEKLY decline). Examples of IPOs like ARM are off 26% from recent highs and fell 6% last week as the SMH was UNCH. CART is 40% from its peak already, and BIRK just entered the fray three days ago in a fragile environment and CLOSED hard upon its lows each day this week.
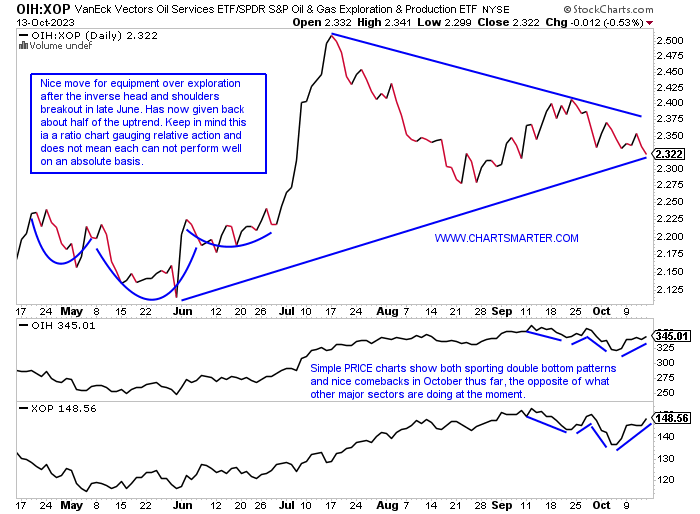
Oil Patch Inflections:
- The energy space has been acting overall in a firm manner, and although the XLE is not going to catch communication services, tech, and discretionary on a YTD basis it has put up a respectable showing. This considering the massive move the group had put up in 2021 and 2022 shines it in an even better light (was anyone expecting another 50% annual gain and notice the prior 3 years were the worst major S&P sector performer each time between 2018-2020). Consider the last 3 months the XLE has been basically the only game in town, and if we drill down even further, pun intended, and look at the XOP and OIH from the ratio chart below we see a symmetrical triangle forming, as the XOP is playing catch up a bit (perhaps some enthusiasm with the XOM PXD news). Each of those ETFs is sporting double bottom pivots of 151.63 and 359.65 respectively. Some patience as the triggers are a few percent away from current PRICES, but let's take a look at some attractive names in the space that have reset and could be ready for a year-end run.
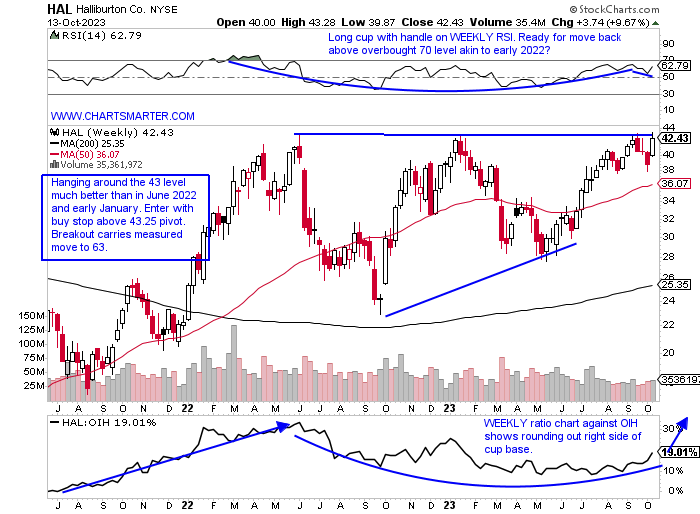
Halliburton:
- Oil equipment play up 8% YTD and 35% over last one year period. Dividend yield of 1.5%.
- Name 2% off most recent 52-week highs and good relative strength last week up almost 10% as OIH rose 6%. Break above WEEKLY ascending triangle would negate bearish engulfing and gravestone doji candles from weeks ending 9/22 and 9/29.
- Earnings reactions mostly lower off 2.9, 3.5, and 1.8% on 7/19, 4/25, and 1/24 after a gain of 1.2% on 10/25/22.
- Enter with buy stop above the WEEKLY bullish ascending triangle.
- Entry HAL 43.25. Stop 39 (REPORTS 10/24 before open).
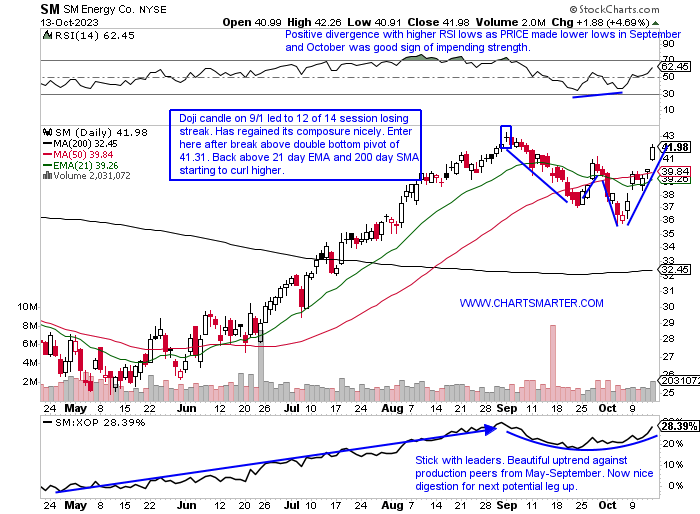
SM Energy:
- Production play up 21% YTD and lower by 7% over last one year period. Dividend yield of 1.4%.
- Name 14% off most recent 52-week highs and strong performance last week up better than 12%, its best WEEKLY gain in the last year. Recently recorded firm run of gaining 15 of 16 weeks ending between 5/19-9/1 (lone down week fell 12 cents week ending 6/16).
- FOUR consecutive positive earnings reactions up 4.7, 4.6, 1.1, and 2.9% on 8/3, 4/28, 2/23 and 11/4/22.
- Enter after recent double bottom breakout.
- Entry SM here. Stop 39 (REPORTS 11/2 after the close).
This article requires a Chartsmarter membership. Please click here to join.
"Tortoises can tell you more about the road than hares."
Walking the Tightrope:
- The S&P 500, the most widely watched benchmark on the planet, looked poised for a solid week until the Thursday and Friday sessions dampened that belief. It is not how you start but how you finish, and the moves to end the week falling .6 and .5% may have looked pedestrian but technically there were some flaws. First, we filled in the upside gap on 10/10 from 9/20, and keep in mind gaps on indexes are somewhat rare. For example, the S&P 500 filled one on 7/6 from the 6/29 session before ramping higher by more than 200 handles (notice how on the bottom of that chart as well the number of stocks above their 50-day SMAs on the index has been in decline mode since late July). If one looks a little closer the intraday reversal on Tuesday produced a bearish shooting star that would have completed a bullish three white soldiers formation, and Wednesday a hanging man candle. The bounce of 4200 was one of the most telegraphed that I can remember, and my feeling is we can touch the 4100 area, measured move lower from the head and shoulders before we attempt the next leg up.
Gold a Safe Haven Again?
- Is gold going to be acting like the safe haven it was once thought of? Of course, that is a weak stab at humor but the precious metal recently has not responded the way it normally would have, and was the huge response Friday saying that something more ominous is on the horizon? We spoke of gold being alluring in our Week Ahead Note last week, but were we certainly not expecting the move we witnessed. Gold recorded its best week since March and notice the last 2 times it recorded large long bullish WEEKLY white candlesticks in November 2022 and March 2023 saw further PRICE advances. Of course, the November example was stronger, but even the March candle saw a quick 100-handle run to the highs in early May. It feels like there wants to be a push toward the very round 2000 figure where a double bottom pattern pivot lies, and on a WEEKLY CLOSING basis that area has seen forceful rejections. The bullish morning star pattern last week suggests another test of that level is likely. The road will be bumpy but I think it gets there sometime in 2023.
China Floundering:
- Give the FXI credit as it is attempting to break ABOVE a bearish head and shoulders pattern as we know from FALSE moves come fast ones in the opposite direction, but the rebuttal at the 50-day SMA last Wednesday and then the bearish engulfing candle Thursday make it probable that the downtrend will resume. The weakness began right at the round 30 number this summer and it has been soft as it now trades more than 20% off most recent 52-week highs, while the S&P 500 is just 6% from its annual peak (this chart shows the bifurcation began around the start of Q2). Expect that relationship to continue, even if the S&P 500 does start to fall, as it will likely sink greater than our benchmark. We also included a ratio chart below comparing the KWEB to the FDN. Although the 3 month time periods are similar for the two on a YTD it is no contest with the KWEB down 10% and the FDN up 28%. BABA, the 2nd largest holding in the KWEB, has been a drag (top holding PDD has been strong), and lining it up against META and GOOGL which are in the top 3 of the FDN have been standouts in 2023.
Liquidity Crisis:
- The 30-year bond auction on Thursday was key as before that the market had basically shrugged off the CPI data much like it did to start the week with the Middle East as it was climbing the proverbial wall of worry. Demand was the reason for the disappointment, and can one overlay that with the action in some recent new issues. These names were acting weak before the recent market frailty and is that a question of them being mispriced at the offering, again no liquidity, or something more sinister? No one knows the real answer, and it is probably a combination of all three, but one thing for certain that we can gauge it upon is PRICE action. Spinoffs like KVUE are now down 15 of the last 21 weeks (VLTO from DHR recorded its second straight 8% WEEKLY decline). Examples of IPOs like ARM are off 26% from recent highs and fell 6% last week as the SMH was UNCH. CART is 40% from its peak already, and BIRK just entered the fray three days ago in a fragile environment and CLOSED hard upon its lows each day this week.
Oil Patch Inflections:
- The energy space has been acting overall in a firm manner, and although the XLE is not going to catch communication services, tech, and discretionary on a YTD basis it has put up a respectable showing. This considering the massive move the group had put up in 2021 and 2022 shines it in an even better light (was anyone expecting another 50% annual gain and notice the prior 3 years were the worst major S&P sector performer each time between 2018-2020). Consider the last 3 months the XLE has been basically the only game in town, and if we drill down even further, pun intended, and look at the XOP and OIH from the ratio chart below we see a symmetrical triangle forming, as the XOP is playing catch up a bit (perhaps some enthusiasm with the XOM PXD news). Each of those ETFs is sporting double bottom pivots of 151.63 and 359.65 respectively. Some patience as the triggers are a few percent away from current PRICES, but let's take a look at some attractive names in the space that have reset and could be ready for a year-end run.
Halliburton:
- Oil equipment play up 8% YTD and 35% over last one year period. Dividend yield of 1.5%.
- Name 2% off most recent 52-week highs and good relative strength last week up almost 10% as OIH rose 6%. Break above WEEKLY ascending triangle would negate bearish engulfing and gravestone doji candles from weeks ending 9/22 and 9/29.
- Earnings reactions mostly lower off 2.9, 3.5, and 1.8% on 7/19, 4/25, and 1/24 after a gain of 1.2% on 10/25/22.
- Enter with buy stop above the WEEKLY bullish ascending triangle.
- Entry HAL 43.25. Stop 39 (REPORTS 10/24 before open).
SM Energy:
- Production play up 21% YTD and lower by 7% over last one year period. Dividend yield of 1.4%.
- Name 14% off most recent 52-week highs and strong performance last week up better than 12%, its best WEEKLY gain in the last year. Recently recorded firm run of gaining 15 of 16 weeks ending between 5/19-9/1 (lone down week fell 12 cents week ending 6/16).
- FOUR consecutive positive earnings reactions up 4.7, 4.6, 1.1, and 2.9% on 8/3, 4/28, 2/23 and 11/4/22.
- Enter after recent double bottom breakout.
- Entry SM here. Stop 39 (REPORTS 11/2 after the close).