Semi Significance:
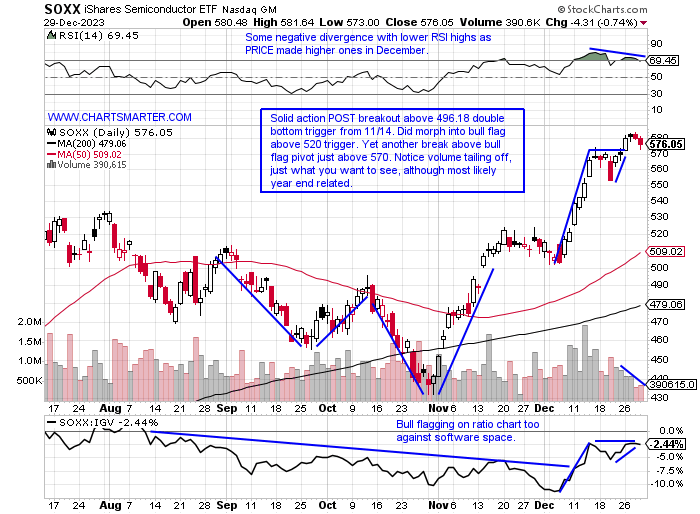
- Semiconductors carry a lot of clout, and when they are acting well it is a strong overall tailwind for equities. Looking at the chart below of the SOXX, this, in my opinion, is amid a gravitational pull toward the very round 600 number (notice the bounce at the 500 figure in early December) and higher. Amazingly seasonality is strong, the ETF averages MONTHLY gains over the last 5 years for 10 consecutive months), but the easy money has now been made (will put a heavy emphasis on stock picking in Q1 '24) after the big historical November-December surge, for an average of almost 18%, not a typo. AMD and AVGO are the top holdings, with NVDA the third largest component (in the SMH it is by far the largest comprising more than 20%). AMD has broken above a bull flag pivot of 140 which carries a measured move to 165, and AVGO is now bull flagging itself following a 250 handle run in the middle of December, but watch for the bearish MACD crossover for a tactical pullback to buy into. NVDA will have a big say, but its chart has become very wide and loose, hallmark bearish traits, and one should remain cautious until a decisive CLOSE is recorded above the very round 500 number. Its WEEKLY chart has a much better look to it as it consolidates between 400-500 within a bull flag pattern.
India Opportunity:
- The IT services play has seen some strong performers in 2023. IBM, among the "old tech" plays, is higher by 16% and sports a dividend yield of 4%. It recorded a recent 8-week win streak and the 3 weeks ending between 12/8-22 all CLOSED very taut within just .24 of each other and we know explosive move can come from breakouts above that type of digestion. Looking toward India which just recorded a powerful MONTHLY chart breakout above 24 (also recorded its first MONTHLY MACD crossover a couple of months back, its first in 3 years) the chart below of INFY may benefit. It REPORTS earnings on January 11th before the open and it has registered three consecutive negative reactions. The stock trades 6% off most recent 52-week highs and on its WEEKLY chart, it has broken a string of lower highs recently, although it has lagged overall Indian peers. It has been acting better overall since this summer with just one example of the stock losing ground in consecutive weeks in the second half of 2023.

Recent Examples:
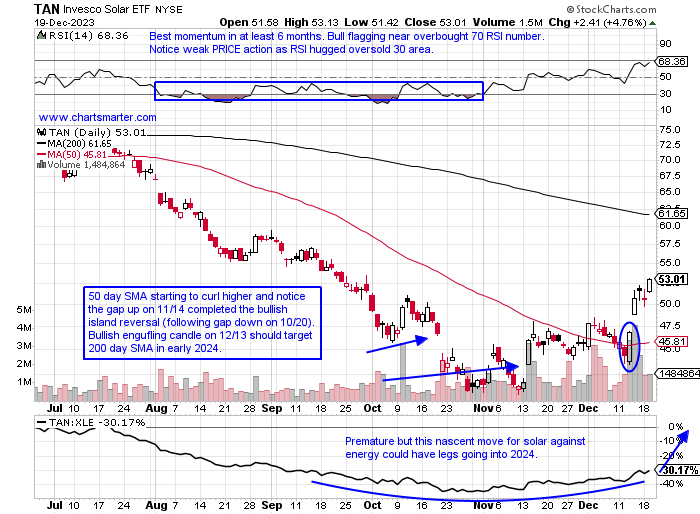
- One group that has lagged inside the technology space in 2023 was the solar equipment names. Of the large-cap names, only FSLR was in the green for the year with ENPH and SEDG lower by 50 and 66% respectively. Looking at the group as a whole with the chart below of TAN and how it appeared in our 12/20 Technology Note, I think this area could be ripe for a rebound in 2024. The ETF has behaved bullishly since the island reversal was completed on 11/14 with the gap up rising 10.4% on well above average daily volume (obviously the fund bottomed later than the rest of the market in late October). Search for names that shrugged off the weakness best this year as they will most likely be the winners next year. We have spoken about NXT and it is on a 5-session losing streak, after a rejection at the very round 50 number, but still above the WEEKLY cup base breakout pivot of 44. Keep an eye on RUN which recently recorded a triple bottom at the very round 10 number (from late 2018-early 2019 and again in March-April 2020).
Special Situations:
Datadog:
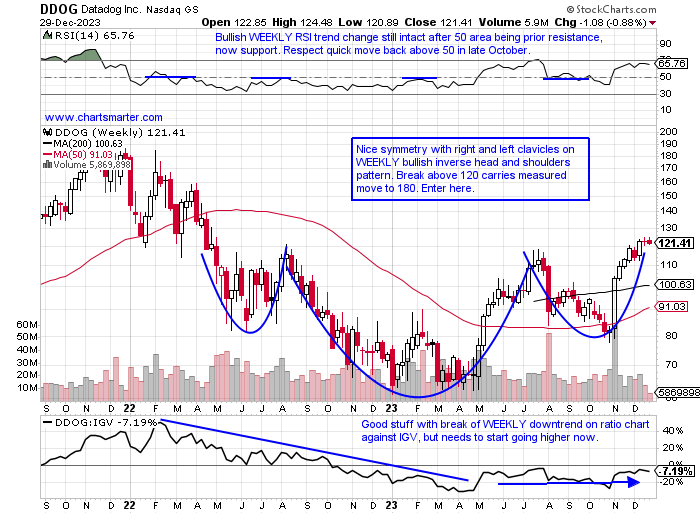
- Software play up 65% YTD and 33% over last 3-month period.
- Name 3% off most recent 52-week highs and this week completed 3-week tight pattern with all 3 weeks CLOSING very taut within just 1.24 of each other. Admire action following big week-ending gain from 11/10 rising 26% in second-best WEEKLY volume ever.
- Earnings reactions mixed up 28.5 and 14.5% on 11/7 and 5/4 and fell 17.2 and 7% on 8/8 and 2/16.
- Enter after break above WEEKLY inverse head and shoulders formation.
- Entry DDOG here. Stop 113.50.
Fiserv:
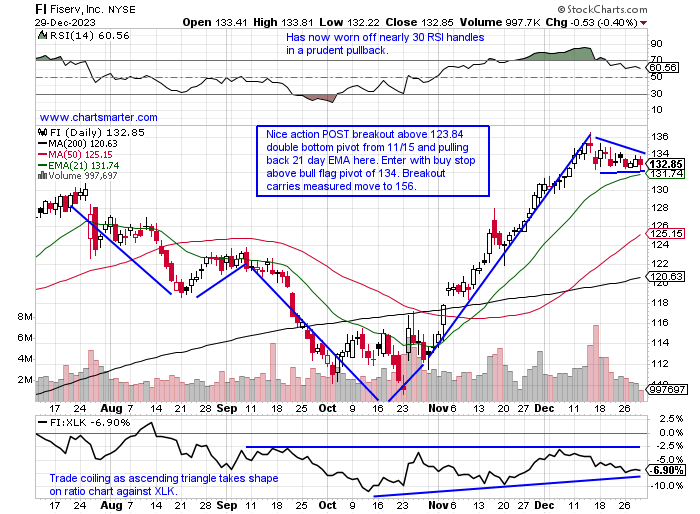
- IT play up 32% YTD and 18% over last 3-month period.
- Name 3% off most recent 52-week highs and this week's small decline put an end to a 9-week win streak. Strong volume during the recent run, but some digestion is needed on the WEEKLY chart as weeks ending 12/15 and 12/22 both recorded doji candles.
- Earnings reactions mostly higher up 5.3, 2.4, and 8.3% on 10/24, 4/25, and 2/7, and fell 2.1% on 7/26.
- Enter with buy stop above bull flag.
- Entry FISV 134. Stop 131.
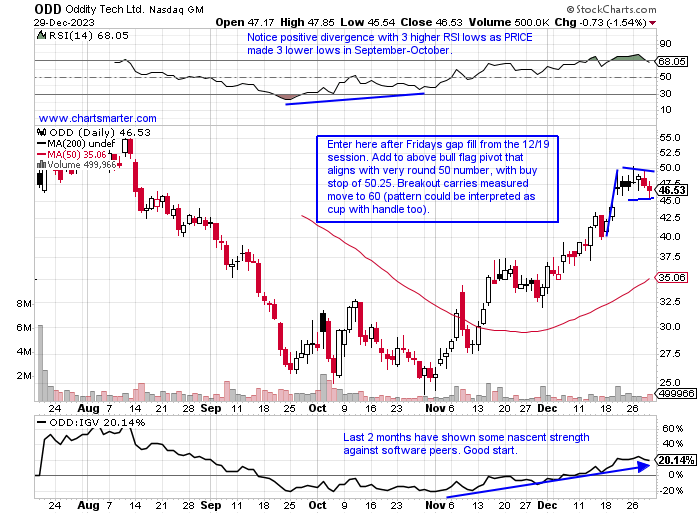
Oddity Tech:
- Recent Israeli software IPO up 41% over last one month period and 64% over last 3 months.
- Name 17% off early August highs and has DOUBLED in PRICE over last 2 months. Stock is digesting here just below very round 50 number for the second week, not surprising given 4 weeks ending between 7/21-8/11 all CLOSED above 50. Moving above area can be very powerful.
- Earnings reactions mixed with just 2 so far up 8.5% on 8/10 and fell 5.2% on 11/8.
- Enter after gap fill.
- Entry ODD here. Stop 44.
Good luck.
Entry summaries:
Buy after break above WEEKLY inverse head and shoulders formation DDOG here. Stop 113.50.
Buy stop above bull flag FISV 134. Stop 131.
Buy after gap fill ODD here. Stop 44.
This article requires a Chartsmarter membership. Please click here to join.
Semi Significance:
- Semiconductors carry a lot of clout, and when they are acting well it is a strong overall tailwind for equities. Looking at the chart below of the SOXX, this, in my opinion, is amid a gravitational pull toward the very round 600 number (notice the bounce at the 500 figure in early December) and higher. Amazingly seasonality is strong, the ETF averages MONTHLY gains over the last 5 years for 10 consecutive months), but the easy money has now been made (will put a heavy emphasis on stock picking in Q1 '24) after the big historical November-December surge, for an average of almost 18%, not a typo. AMD and AVGO are the top holdings, with NVDA the third largest component (in the SMH it is by far the largest comprising more than 20%). AMD has broken above a bull flag pivot of 140 which carries a measured move to 165, and AVGO is now bull flagging itself following a 250 handle run in the middle of December, but watch for the bearish MACD crossover for a tactical pullback to buy into. NVDA will have a big say, but its chart has become very wide and loose, hallmark bearish traits, and one should remain cautious until a decisive CLOSE is recorded above the very round 500 number. Its WEEKLY chart has a much better look to it as it consolidates between 400-500 within a bull flag pattern.
India Opportunity:
- The IT services play has seen some strong performers in 2023. IBM, among the "old tech" plays, is higher by 16% and sports a dividend yield of 4%. It recorded a recent 8-week win streak and the 3 weeks ending between 12/8-22 all CLOSED very taut within just .24 of each other and we know explosive move can come from breakouts above that type of digestion. Looking toward India which just recorded a powerful MONTHLY chart breakout above 24 (also recorded its first MONTHLY MACD crossover a couple of months back, its first in 3 years) the chart below of INFY may benefit. It REPORTS earnings on January 11th before the open and it has registered three consecutive negative reactions. The stock trades 6% off most recent 52-week highs and on its WEEKLY chart, it has broken a string of lower highs recently, although it has lagged overall Indian peers. It has been acting better overall since this summer with just one example of the stock losing ground in consecutive weeks in the second half of 2023.
Recent Examples:
- One group that has lagged inside the technology space in 2023 was the solar equipment names. Of the large-cap names, only FSLR was in the green for the year with ENPH and SEDG lower by 50 and 66% respectively. Looking at the group as a whole with the chart below of TAN and how it appeared in our 12/20 Technology Note, I think this area could be ripe for a rebound in 2024. The ETF has behaved bullishly since the island reversal was completed on 11/14 with the gap up rising 10.4% on well above average daily volume (obviously the fund bottomed later than the rest of the market in late October). Search for names that shrugged off the weakness best this year as they will most likely be the winners next year. We have spoken about NXT and it is on a 5-session losing streak, after a rejection at the very round 50 number, but still above the WEEKLY cup base breakout pivot of 44. Keep an eye on RUN which recently recorded a triple bottom at the very round 10 number (from late 2018-early 2019 and again in March-April 2020).
Special Situations:
Datadog:
- Software play up 65% YTD and 33% over last 3-month period.
- Name 3% off most recent 52-week highs and this week completed 3-week tight pattern with all 3 weeks CLOSING very taut within just 1.24 of each other. Admire action following big week-ending gain from 11/10 rising 26% in second-best WEEKLY volume ever.
- Earnings reactions mixed up 28.5 and 14.5% on 11/7 and 5/4 and fell 17.2 and 7% on 8/8 and 2/16.
- Enter after break above WEEKLY inverse head and shoulders formation.
- Entry DDOG here. Stop 113.50.
Fiserv:
- IT play up 32% YTD and 18% over last 3-month period.
- Name 3% off most recent 52-week highs and this week's small decline put an end to a 9-week win streak. Strong volume during the recent run, but some digestion is needed on the WEEKLY chart as weeks ending 12/15 and 12/22 both recorded doji candles.
- Earnings reactions mostly higher up 5.3, 2.4, and 8.3% on 10/24, 4/25, and 2/7, and fell 2.1% on 7/26.
- Enter with buy stop above bull flag.
- Entry FISV 134. Stop 131.
Oddity Tech:
- Recent Israeli software IPO up 41% over last one month period and 64% over last 3 months.
- Name 17% off early August highs and has DOUBLED in PRICE over last 2 months. Stock is digesting here just below very round 50 number for the second week, not surprising given 4 weeks ending between 7/21-8/11 all CLOSED above 50. Moving above area can be very powerful.
- Earnings reactions mixed with just 2 so far up 8.5% on 8/10 and fell 5.2% on 11/8.
- Enter after gap fill.
- Entry ODD here. Stop 44.
Good luck.
Entry summaries:
Buy after break above WEEKLY inverse head and shoulders formation DDOG here. Stop 113.50.
Buy stop above bull flag FISV 134. Stop 131.
Buy after gap fill ODD here. Stop 44.