"To think too much is a disease". - Dostoevsky
"SPY"tacular:
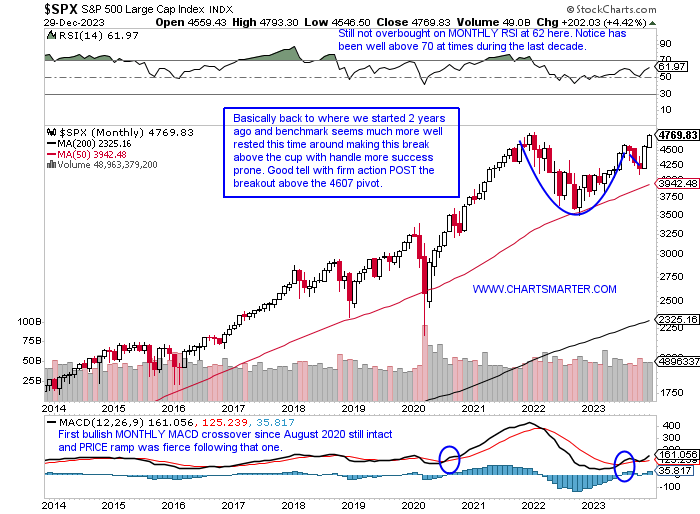
- The adage goes "It is not where you start but where you finish", and if we apply that to the MONTHLY chart of the S&P 500 below it was a great way to go out in November and December (to be fair we started 2023 off with a strong January advancing by 6.2%). Notice the nice follow-through last month after the break above the cup with handle, and we know the best breakouts tend to work right away so that is a good omen for 2024. The widely followed benchmark is now on a 9-week win streak and the last 2 WEEKLY candles were spinning tops suggesting some tiring, so a pullback here would be considered healthy (notice on the simple PRICE charts on that link that the Dow is the only one of the major 3 trading at all-time highs). Could that mean a continuation of some strength in the "growth versus value" debate, for the latter, that started recently as one can see where the action is over the last month's period? In my opinion, breadth is expanding and that is benign for all the major averages going forward.
Rates Reckoning:
- Rates had a miserable Q4 with a relentless drawdown, of course providing a nice tailwind for equities. I still recall how people would be afraid of not the rate increases themselves but the velocity of them. What about when this occurs on the downside? Is something sinister taking place? Of course, we will never know but evaluating PRICE action on the 10-year yield below shows some soft action and we know trends once in motion are more likely to remain in place than to reverse. There are some positives to highlight with the potential of a bullish MACD crossover and Thursday's bullish harami candle. I think this will move higher to fill in the gap from the 12/13 session in January, which should put pressure on stocks and give them a chance to rest for the next potential move upward. On its WEEKLY chart, although it is lower 7 of the last 10 weeks, with 2 of the decliners doji candles, it is now retesting the rising 50 WEEK SMA where it has found support during the last couple of years. Peaking at the greenback chart which the 10-year has a strong correlation could be bottoming near the very round par number which should aid rates too.

Red Dragon Awakening?
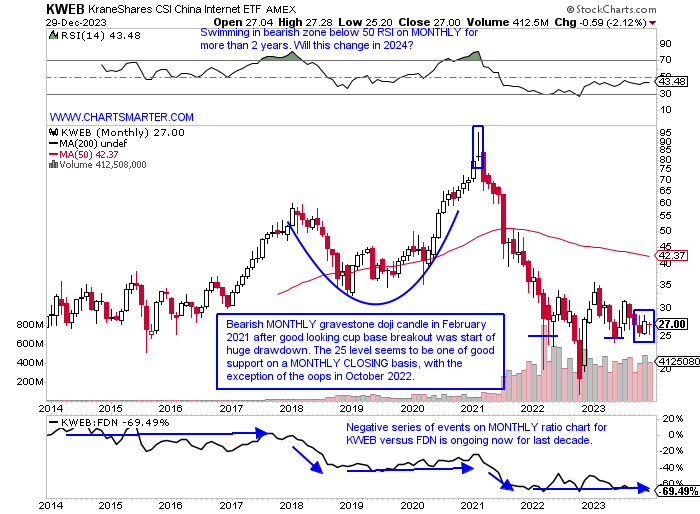
- There is no question that Chinese stocks were a big disappointment in 2023, compared to our domestic counterparts especially, and this chart shows the theme after there was some correlation between the FXI and S&P 500 in a lot of 2022. They started to diverge in Q2 '23 but will the region be happy to put an end to last year? The MONTHLY chart below of the internet names via KWEB advocates for a potential sanguine approach. I come to that conclusion with December recording a rare doji candle at the 25 level which has plenty of PRICE memory, and on a MONTHLY CLOSING basis has been a nice cushion of support. Additionally, this month's range was one of the tautest in years, and some may say that was due to the traditionally slow holiday time, but one could argue that trade could also be more volatile with fewer market participants around. Either way to me that says selling pressure could be drying up. As always stick with best-of-breed names and here is the MONTHLY chart of PDD I bet that this will touch the very round 200 number in the first half of 2024 (measured move from a break above the daily flag) as it rounds the right side of a cup base. Again notice how tight December's range was, even more notable after the surge in November.
Natty Feels Ready:
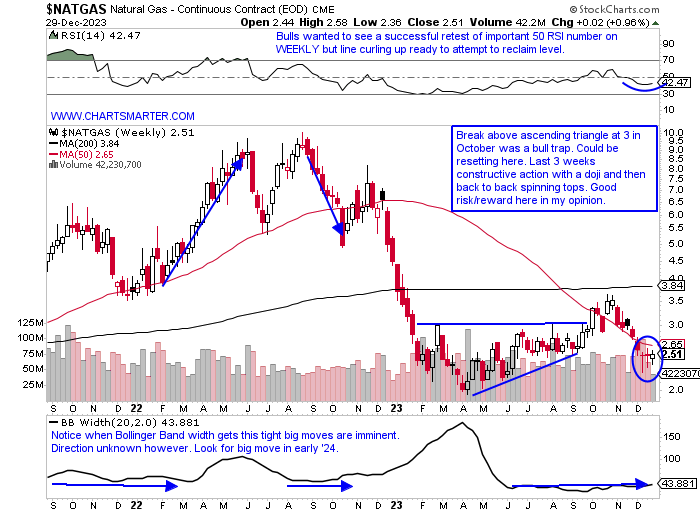
- The "widowmaker" never ceases to amaze and always lives up to its moniker. Could the instrument be ready for a run in 2024? First I was surprised just how weak the November-December seasonality period was the last 5 years with November CLOSING lower than where it started 4 of the last 5, and December all 5, each with negative double digits returns. From November-March it shows 5 consecutive MONTHLY returns, but the worst seems to be behind it. Can we be opportunistic here? PRICE is my ultimate guide and the WEEKLY chart below shows 3 straight bottoming candlesticks. The week ending 12/15 was a Doji, and then the last 2 spinning tops suggesting that selling pressure is abating. I would like to see this back above the 50 WEEK SMA, but it offers good risk/reward here with a WEEKLY CLOSING stop of 2.30. As far as individual stocks in the space go I still like AR, and this is how we looked at the name a couple of weeks back after the bullish WEEKLY piercing line candle off the very round 20 number the week ending 12/15 rising 5% in the firmest WEEKLY volume in 14 months.
Tactical Bear:
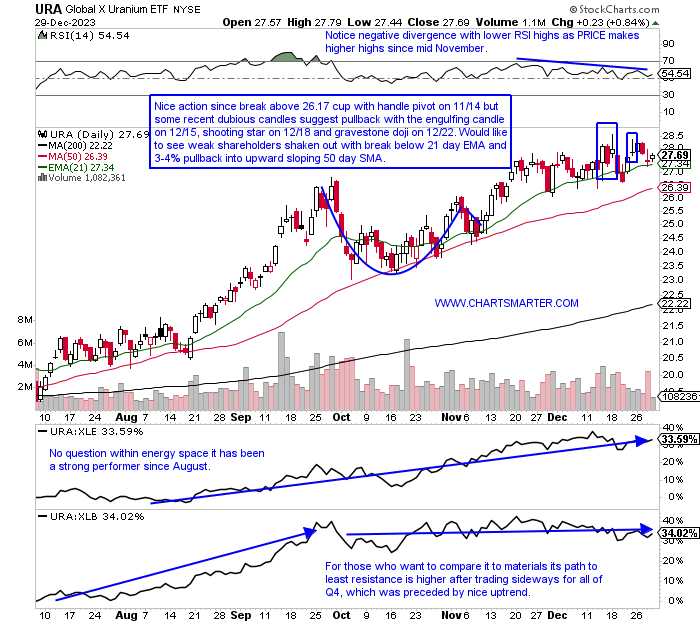
- Let me be clear I think Uranium will be a big winner again in 2024 (URA rose 40% in 2023), but nothing goes up in a straight line and we can be tactical trading around a core position. Below is the chart of the URA and it has been riding along its 21-day EMA throughout December and may be getting too comfortable there. Indeed the MONTHLY bull flag breakout above 22 we spoke about in late summer is still intact and carries a measured move to 38. Its WEEKLY chart feels a bit stretched as it trades well north of its 21 WEEK EMA and 50 WEEK SMA, and notice the last 6 weeks have recorded spinning top candles which indicate some possible fatigue. A prudent pullback of 3-4% would be a welcome sign for bulls to add to their stake. There are some periphery plays that I was very bullish on and caught the meat of the move in CEG, but even this play looks as if it is starting to build the right clavicle on a potential bearish head and shoulders formation. Let us look at a couple of other names in the arena with CCJ and BWXT, and once measured moves lower are hit can flip and go long.
Cameco:
- Canadian uranium play up 90% YTD and 9% over the last 3-month period. Dividend yield of .2%.
- Name 8% off most recent 52-week highs and on a current 4-week losing streak. The week ending 12/22 fell 3% and broke below a 4-week tight pattern with the 4 weeks ending between all CLOSING within just .44 of each other. Look for a move back into rising 21 WEEK EMA in the near term.
- Earnings reactions mostly higher up 8, 3.3, and 4.4% on 10/31, 4/28, and 2/9, and fell 3.8% on 8/2.
- Enter short with sell stop below bear flag.
- Entry CCJ 42.75. Buy stop 44.25.

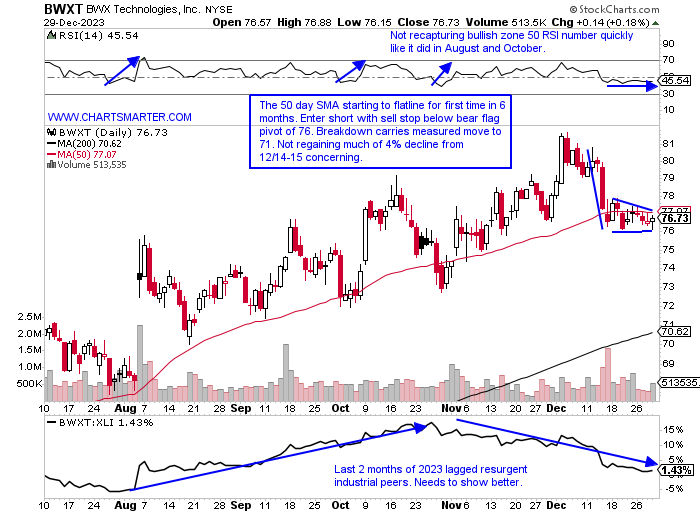
BWX Technologies:
- Industrial play makes nuclear equipment up 32% YTD and 2% over last 3-month period. Dividend yield of 1.2%.
- Name 6% off most recent 52-week highs and well extended from 50 WEEK SMA. The WEEKLY chart shows the last 3 weeks all CLOSING very taut within just .47 of each other following the bearish shooting star candle the week ending 12/8.
- FOUR straight positive earnings reactions up 3.1, 7.6, 2.4 and 2.6% on 11/2, 8/4, 5/9 and 2/24.
- Enter short with sell stop below bear flag.
- Entry BWXT 76. Buy stop 77.50.
This article requires a Chartsmarter membership. Please click here to join.
"To think too much is a disease". - Dostoevsky
"SPY"tacular:
- The adage goes "It is not where you start but where you finish", and if we apply that to the MONTHLY chart of the S&P 500 below it was a great way to go out in November and December (to be fair we started 2023 off with a strong January advancing by 6.2%). Notice the nice follow-through last month after the break above the cup with handle, and we know the best breakouts tend to work right away so that is a good omen for 2024. The widely followed benchmark is now on a 9-week win streak and the last 2 WEEKLY candles were spinning tops suggesting some tiring, so a pullback here would be considered healthy (notice on the simple PRICE charts on that link that the Dow is the only one of the major 3 trading at all-time highs). Could that mean a continuation of some strength in the "growth versus value" debate, for the latter, that started recently as one can see where the action is over the last month's period? In my opinion, breadth is expanding and that is benign for all the major averages going forward.
Rates Reckoning:
- Rates had a miserable Q4 with a relentless drawdown, of course providing a nice tailwind for equities. I still recall how people would be afraid of not the rate increases themselves but the velocity of them. What about when this occurs on the downside? Is something sinister taking place? Of course, we will never know but evaluating PRICE action on the 10-year yield below shows some soft action and we know trends once in motion are more likely to remain in place than to reverse. There are some positives to highlight with the potential of a bullish MACD crossover and Thursday's bullish harami candle. I think this will move higher to fill in the gap from the 12/13 session in January, which should put pressure on stocks and give them a chance to rest for the next potential move upward. On its WEEKLY chart, although it is lower 7 of the last 10 weeks, with 2 of the decliners doji candles, it is now retesting the rising 50 WEEK SMA where it has found support during the last couple of years. Peaking at the greenback chart which the 10-year has a strong correlation could be bottoming near the very round par number which should aid rates too.
Red Dragon Awakening?
- There is no question that Chinese stocks were a big disappointment in 2023, compared to our domestic counterparts especially, and this chart shows the theme after there was some correlation between the FXI and S&P 500 in a lot of 2022. They started to diverge in Q2 '23 but will the region be happy to put an end to last year? The MONTHLY chart below of the internet names via KWEB advocates for a potential sanguine approach. I come to that conclusion with December recording a rare doji candle at the 25 level which has plenty of PRICE memory, and on a MONTHLY CLOSING basis has been a nice cushion of support. Additionally, this month's range was one of the tautest in years, and some may say that was due to the traditionally slow holiday time, but one could argue that trade could also be more volatile with fewer market participants around. Either way to me that says selling pressure could be drying up. As always stick with best-of-breed names and here is the MONTHLY chart of PDD I bet that this will touch the very round 200 number in the first half of 2024 (measured move from a break above the daily flag) as it rounds the right side of a cup base. Again notice how tight December's range was, even more notable after the surge in November.
Natty Feels Ready:
- The "widowmaker" never ceases to amaze and always lives up to its moniker. Could the instrument be ready for a run in 2024? First I was surprised just how weak the November-December seasonality period was the last 5 years with November CLOSING lower than where it started 4 of the last 5, and December all 5, each with negative double digits returns. From November-March it shows 5 consecutive MONTHLY returns, but the worst seems to be behind it. Can we be opportunistic here? PRICE is my ultimate guide and the WEEKLY chart below shows 3 straight bottoming candlesticks. The week ending 12/15 was a Doji, and then the last 2 spinning tops suggesting that selling pressure is abating. I would like to see this back above the 50 WEEK SMA, but it offers good risk/reward here with a WEEKLY CLOSING stop of 2.30. As far as individual stocks in the space go I still like AR, and this is how we looked at the name a couple of weeks back after the bullish WEEKLY piercing line candle off the very round 20 number the week ending 12/15 rising 5% in the firmest WEEKLY volume in 14 months.
Tactical Bear:
- Let me be clear I think Uranium will be a big winner again in 2024 (URA rose 40% in 2023), but nothing goes up in a straight line and we can be tactical trading around a core position. Below is the chart of the URA and it has been riding along its 21-day EMA throughout December and may be getting too comfortable there. Indeed the MONTHLY bull flag breakout above 22 we spoke about in late summer is still intact and carries a measured move to 38. Its WEEKLY chart feels a bit stretched as it trades well north of its 21 WEEK EMA and 50 WEEK SMA, and notice the last 6 weeks have recorded spinning top candles which indicate some possible fatigue. A prudent pullback of 3-4% would be a welcome sign for bulls to add to their stake. There are some periphery plays that I was very bullish on and caught the meat of the move in CEG, but even this play looks as if it is starting to build the right clavicle on a potential bearish head and shoulders formation. Let us look at a couple of other names in the arena with CCJ and BWXT, and once measured moves lower are hit can flip and go long.
Cameco:
- Canadian uranium play up 90% YTD and 9% over the last 3-month period. Dividend yield of .2%.
- Name 8% off most recent 52-week highs and on a current 4-week losing streak. The week ending 12/22 fell 3% and broke below a 4-week tight pattern with the 4 weeks ending between all CLOSING within just .44 of each other. Look for a move back into rising 21 WEEK EMA in the near term.
- Earnings reactions mostly higher up 8, 3.3, and 4.4% on 10/31, 4/28, and 2/9, and fell 3.8% on 8/2.
- Enter short with sell stop below bear flag.
- Entry CCJ 42.75. Buy stop 44.25.
BWX Technologies:
- Industrial play makes nuclear equipment up 32% YTD and 2% over last 3-month period. Dividend yield of 1.2%.
- Name 6% off most recent 52-week highs and well extended from 50 WEEK SMA. The WEEKLY chart shows the last 3 weeks all CLOSING very taut within just .47 of each other following the bearish shooting star candle the week ending 12/8.
- FOUR straight positive earnings reactions up 3.1, 7.6, 2.4 and 2.6% on 11/2, 8/4, 5/9 and 2/24.
- Enter short with sell stop below bear flag.
- Entry BWXT 76. Buy stop 77.50.