"So Much Has Happened, But Nothing Has Changed" Glen Frey
Momentum Building:
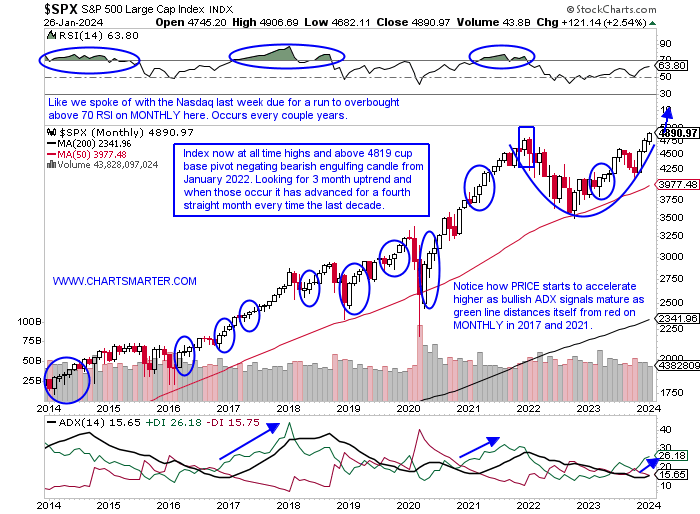
- Those lyrics from the Glen Frey song "You Belong to the City" could very well be describing the PRICE action of the S&P 500 as seen on its MONTHLY chart below. The widely followed benchmark is simply back to levels seen roughly 2 years ago. It is just above the 4819 cup base breakout pivot, meaning we could be on the cusp of another major move higher. What has happened between those 2 years is plenty, with the main thing being the 28% drawdown from the top to the bottom of the range. The Dow and S&P 500 have led the charge recently as seen on this performance chart, and impressive is the DOW leading since the start of Q2 (green line). If it is on the verge of another sizable jump, of course, no one knows this, but if so it has to start somewhere. Notice that each time the index has recorded a 3-month win streak, it has happened 10 times over the last decade, all 10 times saw at least another MONTHLY gain and in many cases more than that. So if the S&P 500 can CLOSE above 4870 next Wednesday could the gravy train be getting ready to pull out of the station again? Keep in mind next week has some of the most influential names REPORTING earnings, so a 2.5% move lower the first 3 days of next week (MSFT AMD, and GOOGL release Tuesday after the CLOSE) is certainly not out of the question and could throw a wrench into the program.
Interesting Affair:
- We may have touched on the unusual action in the intermarket relationship between WTI and the dollar which traditionally trade inversely. Which one is going to blink first? Or does one have to at all? Is crude strength signaling an improving economy or sniffing out a wider conflict in the Middle East? Is it supply and demand? No one knows, and why it pays to focus on PRICE action. One thing we do know is that energy was easily the best-performing major S&P sector with the XLE jumping more than 5% last week. No question rising crude PRICES will help the XLE as seen here and if we get to see the measured move from the break above the bullish ascending triangle to 84 perhaps last week's rally will gain steam. The OIH was the largest beneficiary last week up more than 6% and we spoke about the potential robust move for the equipment names here, and the fund is now on an 8-session win streak and trading right into the teeth of its 200-day SMA. As for the greenback, it is getting sticky here after a 3% move to start 2024, an impressive advance while it forms a bull flag. Even if it breaks higher, for a measured move to 106.50, the chart below says crude may not be adversely affected. It may even benefit from the correlation. It could even help equities as they both have gained in tandem to start 2024, something they did not do the last 5 months of 2o23.

Silver Lining:
- With all the attention surrounding gold as of late, one may be better off honing in on another precious metal silver. The WEEKLY chart below shows how it bounced off the upward-sloping line in a bullish ascending triangle and recorded a spinning top candle (they are adept at signaling a potential change in the prevailing direction) following a 16% decline from highs the first week of December which recorded an ugly bearish engulfing candle. On a YTD and one-year lookback period they are both in negative territory but in my opinion, offer good risk/reward here. Many speak to it as being an industrial metal that can benefit from a resurgent economy (it is used in making semiconductors) and it is also used in making renewable energy equipment (solar). If one wants to play the mean reversion game the chart here shows the largest PRICE difference in 2 years between gold and silver. The daily chart is attractive here too as it sports a bullish RSI divergence and a possible bullish MACD crossover. It does face some seasonality issues with its only negative 3-month streak during the last 5 years, but that's what we have our stop for.

Risk Hmmm.....
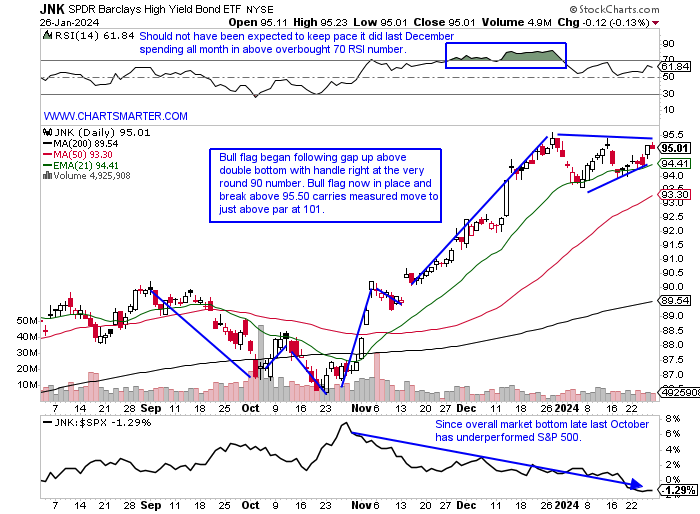
- Risk on or off can be looked at in a myriad of ways. Often one will look to junk bonds to see how they are acting and the chart below of the JNK suggests we are currently in a "risk on" environment. Notice how nicely it has adhered to the 21-day EMA since the break above the swing trader's toolbox key in early November. Its WEEKLY chart also sports a bull flag with a larger measured move to 104, and impressive is how it shrugged off the bearish rising wedge pattern. Another way investors can gauge risk is in the consumer staples versus discretionary ratio chart. This one is a bit more concerning, with the break below a bearish head and shoulders formation, as it favors the more defensive staples space. Notice here last week the XLY was the worst actor of the 11 major S&P sectors down almost 2%. Of course many will attribute this to the weakness in TSLA driving in reverse, pun intended, dropping almost 14% in above-average WEEKLY volume, its first 6-week losing streak in at least 5 years. The MONTHLY doji candle in November 2021 has led to an overall precipitous decline. That coupled with the strength in PG jumping almost 6% last week, its best WEEKLY gain since the week ending 6/14/22 in enormous volume and COST just 2% off all-time highs (being repelled by very round 700 number) is making the difference.
Communication Issues:
- As 2024 takes shape one group has flown out of the gate, separating itself from the 10 other major S&P sectors. That would be the communication services group with the XLC up almost 7% YTD, and outperforming the second-best actor in technology by more than 200 basis points. The ETF is on a 7 session-winning streak and at fresh 52-week highs, something only the financials can boast about. Of course internet plays have been behind the strength, but notice how mobile telecommunications and publishing are helping too. It is interesting to see firmness in names like NYT (albeit bearish rising wedge at the very round 50 number) and NWSA (just above a short double-bottom pivot of 24.65) as others like the Los Angeles Times and Business Insider announce layoffs. Below is the WEEKLY chart of the XLC and its measured move to 85 would equal the highs made in late summer of 2021 which would be the top a cup base (within is the cup with handle breakout) on the MONTHLY chart. Notice the softness on the ratio chart against the broader market as META was in a deep spiral lower. Let us take a look at a couple of interesting plays in the group in SHOP and NTES, the latter for those looking for Chinese exposure.

GoDaddy:
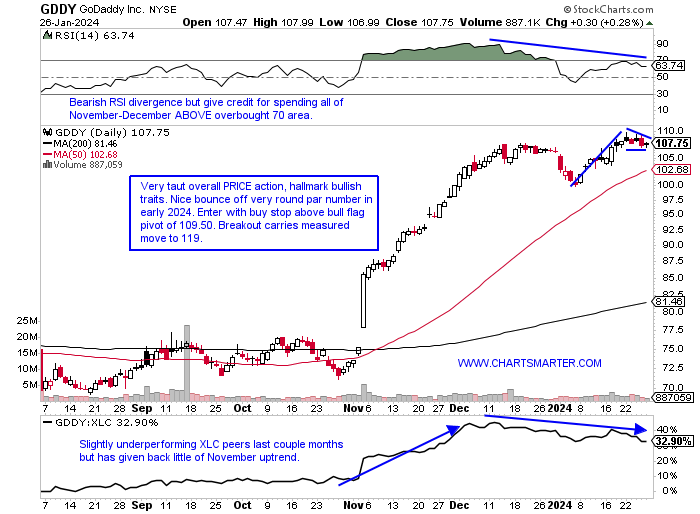
- Communication services play up 1% YTD and 31% over the last one year period.
- Name 2% off most recent 52-week highs and digesting 9 week win streak between early November into year end. WEEKLY chart shows nice action following symmetrical triangle breakout, and demand strength going forward as last 3 weeks of 2024 recorded two bearish shooting stars and a doji candle.
- Earnings reactions mostly lower down 8, 3.6, and .6% on 8/4, 5/5, and 2/15 before a recent gain of 13.8% on 11/3.
- Enter with buy stop above bull flag.
- Entry GDDY 109.50. Stop 106.
Netease:
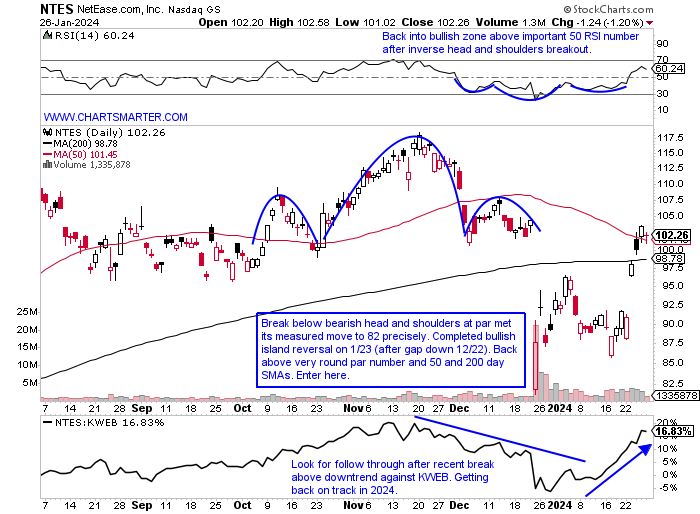
- Chinese communication services play up 10% YTD and 11% over the last one-year period. Dividend yield of 1.7%.
- Name 14% off most recent 52-week highs (compared to peers BIDU BABA and JD off 33, 38 and 63% from their respective annual peaks) and great relative strength last week up 11.5% as KWEB rose 3%. WEEKLY chart shows successful retest of bull flag breakout from last summer recently.
- Earnings reactions mostly lower off 2.4, 3.9, and 3.7% on 11/16, 8/24, and 2/23 and rose 2.7% on 5/25.
- Enter after break above very round par number/bullish island reversal.
- Entry NTES here. Stop 96.25.
This article requires a Chartsmarter membership. Please click here to join.
"So Much Has Happened, But Nothing Has Changed" Glen Frey
Momentum Building:
- Those lyrics from the Glen Frey song "You Belong to the City" could very well be describing the PRICE action of the S&P 500 as seen on its MONTHLY chart below. The widely followed benchmark is simply back to levels seen roughly 2 years ago. It is just above the 4819 cup base breakout pivot, meaning we could be on the cusp of another major move higher. What has happened between those 2 years is plenty, with the main thing being the 28% drawdown from the top to the bottom of the range. The Dow and S&P 500 have led the charge recently as seen on this performance chart, and impressive is the DOW leading since the start of Q2 (green line). If it is on the verge of another sizable jump, of course, no one knows this, but if so it has to start somewhere. Notice that each time the index has recorded a 3-month win streak, it has happened 10 times over the last decade, all 10 times saw at least another MONTHLY gain and in many cases more than that. So if the S&P 500 can CLOSE above 4870 next Wednesday could the gravy train be getting ready to pull out of the station again? Keep in mind next week has some of the most influential names REPORTING earnings, so a 2.5% move lower the first 3 days of next week (MSFT AMD, and GOOGL release Tuesday after the CLOSE) is certainly not out of the question and could throw a wrench into the program.
Interesting Affair:
- We may have touched on the unusual action in the intermarket relationship between WTI and the dollar which traditionally trade inversely. Which one is going to blink first? Or does one have to at all? Is crude strength signaling an improving economy or sniffing out a wider conflict in the Middle East? Is it supply and demand? No one knows, and why it pays to focus on PRICE action. One thing we do know is that energy was easily the best-performing major S&P sector with the XLE jumping more than 5% last week. No question rising crude PRICES will help the XLE as seen here and if we get to see the measured move from the break above the bullish ascending triangle to 84 perhaps last week's rally will gain steam. The OIH was the largest beneficiary last week up more than 6% and we spoke about the potential robust move for the equipment names here, and the fund is now on an 8-session win streak and trading right into the teeth of its 200-day SMA. As for the greenback, it is getting sticky here after a 3% move to start 2024, an impressive advance while it forms a bull flag. Even if it breaks higher, for a measured move to 106.50, the chart below says crude may not be adversely affected. It may even benefit from the correlation. It could even help equities as they both have gained in tandem to start 2024, something they did not do the last 5 months of 2o23.
Silver Lining:
- With all the attention surrounding gold as of late, one may be better off honing in on another precious metal silver. The WEEKLY chart below shows how it bounced off the upward-sloping line in a bullish ascending triangle and recorded a spinning top candle (they are adept at signaling a potential change in the prevailing direction) following a 16% decline from highs the first week of December which recorded an ugly bearish engulfing candle. On a YTD and one-year lookback period they are both in negative territory but in my opinion, offer good risk/reward here. Many speak to it as being an industrial metal that can benefit from a resurgent economy (it is used in making semiconductors) and it is also used in making renewable energy equipment (solar). If one wants to play the mean reversion game the chart here shows the largest PRICE difference in 2 years between gold and silver. The daily chart is attractive here too as it sports a bullish RSI divergence and a possible bullish MACD crossover. It does face some seasonality issues with its only negative 3-month streak during the last 5 years, but that's what we have our stop for.
Risk Hmmm.....
- Risk on or off can be looked at in a myriad of ways. Often one will look to junk bonds to see how they are acting and the chart below of the JNK suggests we are currently in a "risk on" environment. Notice how nicely it has adhered to the 21-day EMA since the break above the swing trader's toolbox key in early November. Its WEEKLY chart also sports a bull flag with a larger measured move to 104, and impressive is how it shrugged off the bearish rising wedge pattern. Another way investors can gauge risk is in the consumer staples versus discretionary ratio chart. This one is a bit more concerning, with the break below a bearish head and shoulders formation, as it favors the more defensive staples space. Notice here last week the XLY was the worst actor of the 11 major S&P sectors down almost 2%. Of course many will attribute this to the weakness in TSLA driving in reverse, pun intended, dropping almost 14% in above-average WEEKLY volume, its first 6-week losing streak in at least 5 years. The MONTHLY doji candle in November 2021 has led to an overall precipitous decline. That coupled with the strength in PG jumping almost 6% last week, its best WEEKLY gain since the week ending 6/14/22 in enormous volume and COST just 2% off all-time highs (being repelled by very round 700 number) is making the difference.
Communication Issues:
- As 2024 takes shape one group has flown out of the gate, separating itself from the 10 other major S&P sectors. That would be the communication services group with the XLC up almost 7% YTD, and outperforming the second-best actor in technology by more than 200 basis points. The ETF is on a 7 session-winning streak and at fresh 52-week highs, something only the financials can boast about. Of course internet plays have been behind the strength, but notice how mobile telecommunications and publishing are helping too. It is interesting to see firmness in names like NYT (albeit bearish rising wedge at the very round 50 number) and NWSA (just above a short double-bottom pivot of 24.65) as others like the Los Angeles Times and Business Insider announce layoffs. Below is the WEEKLY chart of the XLC and its measured move to 85 would equal the highs made in late summer of 2021 which would be the top a cup base (within is the cup with handle breakout) on the MONTHLY chart. Notice the softness on the ratio chart against the broader market as META was in a deep spiral lower. Let us take a look at a couple of interesting plays in the group in SHOP and NTES, the latter for those looking for Chinese exposure.
GoDaddy:
- Communication services play up 1% YTD and 31% over the last one year period.
- Name 2% off most recent 52-week highs and digesting 9 week win streak between early November into year end. WEEKLY chart shows nice action following symmetrical triangle breakout, and demand strength going forward as last 3 weeks of 2024 recorded two bearish shooting stars and a doji candle.
- Earnings reactions mostly lower down 8, 3.6, and .6% on 8/4, 5/5, and 2/15 before a recent gain of 13.8% on 11/3.
- Enter with buy stop above bull flag.
- Entry GDDY 109.50. Stop 106.
Netease:
- Chinese communication services play up 10% YTD and 11% over the last one-year period. Dividend yield of 1.7%.
- Name 14% off most recent 52-week highs (compared to peers BIDU BABA and JD off 33, 38 and 63% from their respective annual peaks) and great relative strength last week up 11.5% as KWEB rose 3%. WEEKLY chart shows successful retest of bull flag breakout from last summer recently.
- Earnings reactions mostly lower off 2.4, 3.9, and 3.7% on 11/16, 8/24, and 2/23 and rose 2.7% on 5/25.
- Enter after break above very round par number/bullish island reversal.
- Entry NTES here. Stop 96.25.