"Whenever you find yourself on the side of the majority, it is time to pause and reflect." Mark Twain
Size Matters?
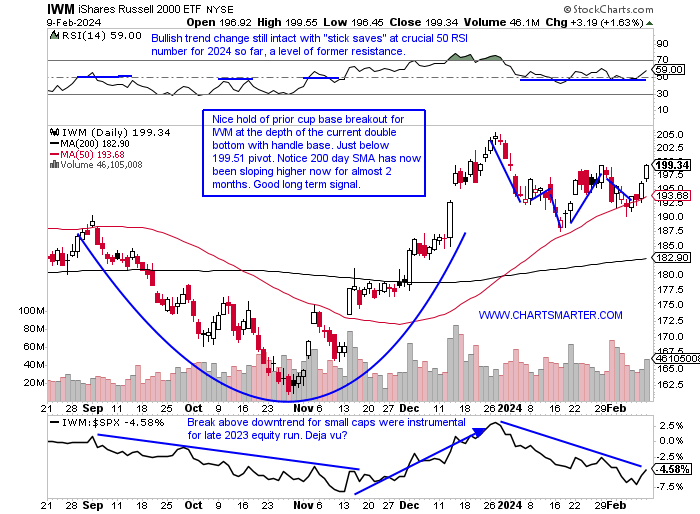
- It was refreshing to see last week's small caps put up the best showing with the Russell 2000 gaining 2.4%, compared to the Nasdaq up 2.3%, the S&P 500 higher by 1.4%, and the Dow UNCH. They are often thought of as leading indicators and of course, they often can give clues to the direction of interest rates, as most small-cap names need financing to survive in their formative years. Like most of the major averages, the Russell 2000 is dealing with round number theory as it inched above the very round 2000 figure Friday. The WEEKLY chart has the look of a bull flag which also recorded a bullish engulfing candle, but I would love to see a decisive break above 202, which would carry a measured move to the 240 area. Interesting to see here how in 2024, while small caps are in pursuit of the big three major averages, it is catching up first to the Dow which is beginning to flatline. The top holding in the Russell 2000 ETF is SMCI which at just more than 1%, is three times the size of the second-largest component in ELF. Wonder how much that is skewing the performance of the IWM? The bottom line is above the 200 number keep a constructive bullish point of view. The MONTHLY chart shows a cup base possibly taking shape which could travel toward 240 by the end of 2024, which would confirm the measured move of the WEEKLY bull flag.
Ten Year Angst:
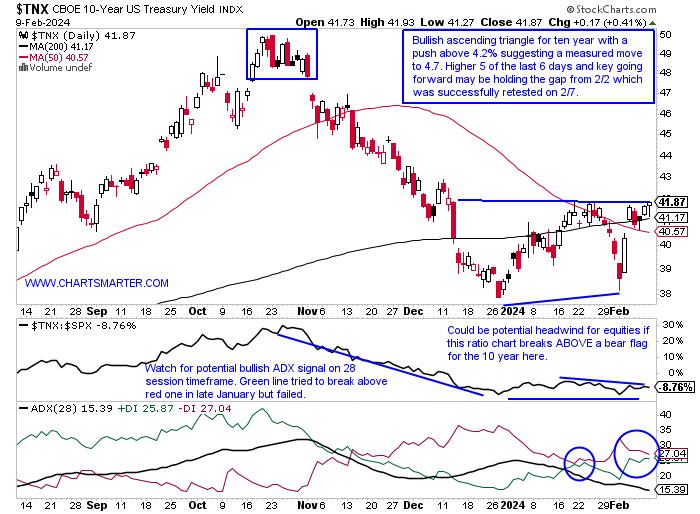
- All eyes have been on the 10-year, although for the time being the stock market has remained resilient in the face of rising rates. Notice the somewhat similar correlation since the start of 2024 for the stock market and interest rates, something that is traditionally not the norm, and was the complete opposite for Q4 2023. Which one is going to blink first? Looking at the daily chart below of the 10-year in hindsight looks clear in hindsight that the "round" 5 number was going to be a tough nut to crack with several dubious candlesticks there starting with the shooting star on 10/19 and then bearish engulfing candles on 10/26 and 11/1 before the completion of a bearish island reversal on 11/2 with the gap down (preceded by the gap up on 10/17). The WEEKLY chart of the 10-year suggests bullish action as it rests gathering stamina at the 50 WEEK SMA for the initial time following the double bottom breakout last summer, often an optimal entry point. Bulls do want to see it distance itself from that line soon, although it had spent about the same amount of time in Q2 2023 before a liftoff from 3.5 to 5%. Additionally, it found a bounce near the 40/45 RSI area where leaders will tend to floor and it could undergo a bullish WEEKLY MACD crossover too. Watch the homebuilders going forward as they have not shown any sign of weakness yet, a group that is particularly sensitive to higher rates.
China Rising:
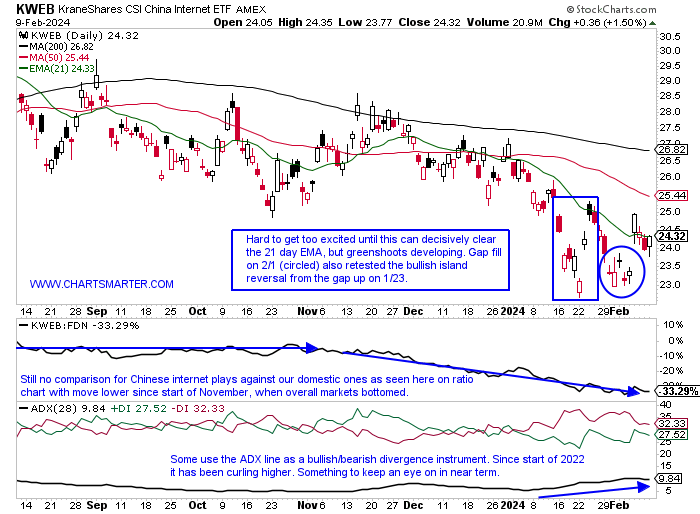
- Many have been declaring that the stimulus in China now can be putting a backstop to an ugly period since the MONTHLY bearish gravestone candle in February 2021. It is hard to catch a falling knife, one should only do so when a technical catalyst arrives (perhaps in the form of bullish candlesticks) but the KWEB chart is starting to show some signs that suggest selling pressure may be abating. First off an old technical axiom for the daily chart below comes to mind where "not to confuse the bottom of a chart with support". I have been WRONG on this in the past with a MONTHLY doji last December, which was also a bullish harami cross, but a filling of the gap within a bullish island reversal. My thoughts now are once can get long above 24.50 with a CLOSING stop below 23. Some names in the fund are looking solid with PDD, generally a best-in-breed play, which recently filled in the gap from the 11/27 session and could now be carving out a future add-on double-bottom of 147.44. It is still in the buy range here and the Friday doji candle indicates selling pressure is softening. NTES, which we spoke about in a recent WEEK AHEAD Note too, is looking better above the very round par number. It has been demonstrating fine relative strength recently up 11.5 and 8% in the weeks ending 1/26 and 2/9 while the KWEB rose by 3 and 5% respectively.
Risk "Muted":
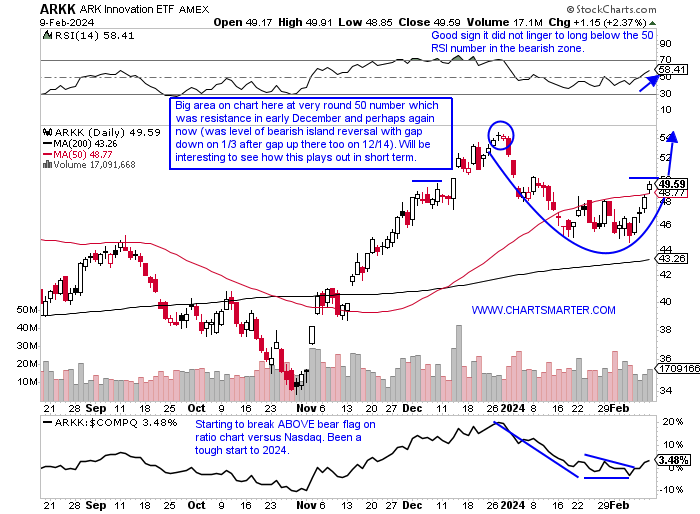
- We often discuss how "risk on" can be looked at in a myriad of ways in markets and this week we will examine the ARKK chart. Not surprisingly round number theory is coming into play here with the 50 figure. This was brief resistance in early December and if it can break through that level next week it could turn into support and would go on to start carving out the right side of a potential cup base (which began with a doji candle and spinning top on 12/27-28 after a 61% run from the late October lows suggested fatigue and a change in the prevailing direction which did occur). A push above 50 would also negate the bearish island reversal that was completed on the first day of 2024. Its three largest holdings in COIN TSLA and ROKU all represent roughly 8% of the fund (the concentration is a double-edged sword), and the first two have recorded swift pullbacks obviously to put it nicely. Last week COIN added 10% and looks to have successfully retested a WEEKLY bullish inverse head and shoulders breakout pivot of 115. TSLA we spoke about this week also potentially bottoming in our 2/9 Consumer Note. Other charts in the top 10 that have a nice technical note include PATH SHOP RBLX and ROKU.
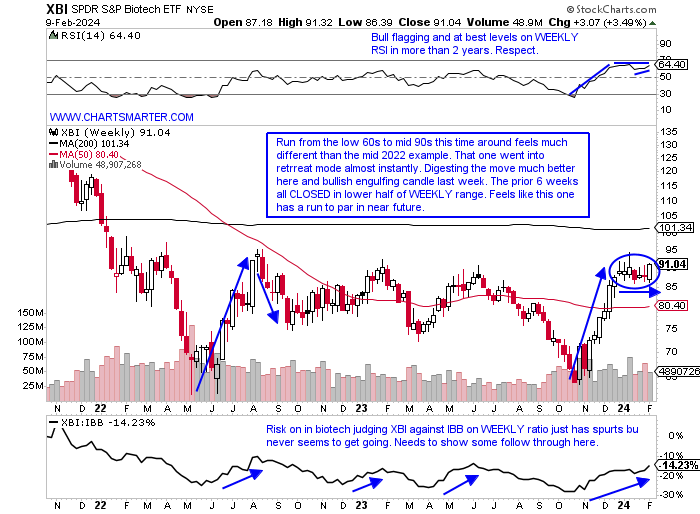
Biotech On Track:
- The biotech space has been known as a very soft space since a MONTHLY shooting star in February 2021, a month where it CLOSED 15% off its intramonth highs, before a rapid descent (notice it is breaking ABOVE a 5-year-long bearish head and shoulders and we know from FALSE moves come fast ones in the opposite direction). Looking at the WEEKLY timeframe below gives some green shoots too as last week recorded a bullish engulfing week here after the prior 6 weeks all CLOSED in the lower half of the WEEKLY range. Additionally, the last time it registered such a strong rush higher from the low 60s to the low 90s it began a precipitous drop after August of 2022 completed a bearish evening star pattern. I believe its willingness to remain at this altitude is a big positive and this could touch off a spirited move to par and beyond in 2024. This action is taking place when some of the biotech giants like AMGN GILD and BIIB (I am old enough to remember when these mattered) are floundering. AMGN put up an ugly bearish WEEKLY engulfing candle falling 10%, its largest WEEKLY decline in at least 5 years in the third largest volume. GILD recorded a rug pull now on a 3-week losing streak after a nice WEEKLY cup base breakout. Let us take a look at a couple lower lower-profile names that seem to be getting a lift in the group in ARWR and IOVA.
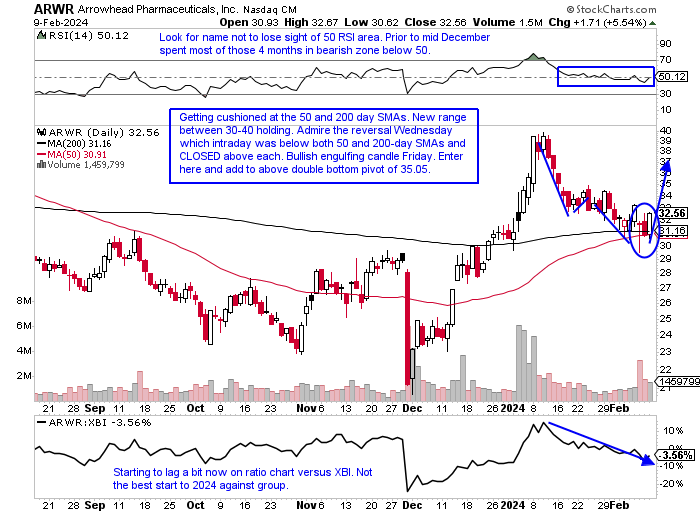
Arrowhead Pharma:
- Biotech play up 6% YTD and lower by 2% over last one year period.
- Name 23% off most recent 52-week highs and ended 3-week losing streak last week recording a bullish hammer candle and CLOSING above the 50 WEEK SMA. After more than doubling in PRICE from 20-40 recently, looks like it's comfortable with new range between 30-40.
- Earnings reactions mostly lower off 4.7, 26.8, and 10.8% on 2/7, 11/30, and 8/8 and rose 13.6% on 2/3.
- Enter after bullish engulfing candle in round number range.
- Entry ARWR here. Stop 29.
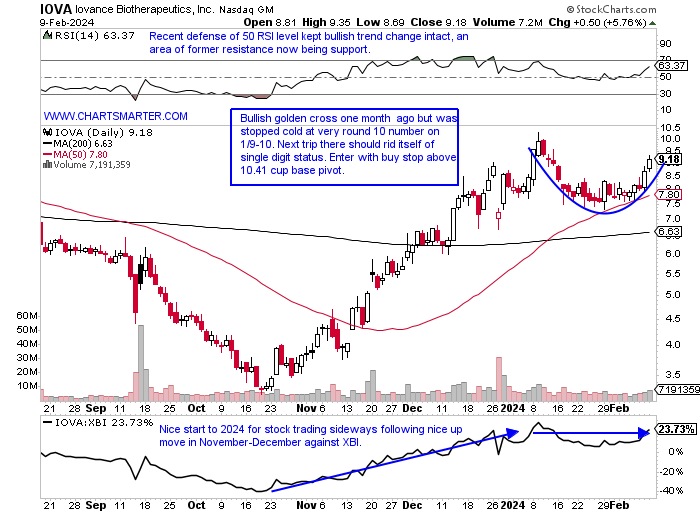
Iovance Biotherapeutics:
- Biotech play up 13% YTD and 24% over last one year period.
- Name 11% off most recent 52-week highs and excellent relative strength this week up more than 16%. More aggressive traders could enter here after a bull flag breakout above which carries a measured move to 15. WEEKLY chart sporting nice bullish inverse head and shoulders formation.
- Earnings reactions mostly higher up 6.4, 3.8, and .1% on 8/9, 5/10, and 3/1, and fell 3.5% on 11/8.
- Enter with buy stop above cup base.
- Entry IOVA 10.41. Stop 9.
This article requires a Chartsmarter membership. Please click here to join.
"Whenever you find yourself on the side of the majority, it is time to pause and reflect." Mark Twain
Size Matters?
- It was refreshing to see last week's small caps put up the best showing with the Russell 2000 gaining 2.4%, compared to the Nasdaq up 2.3%, the S&P 500 higher by 1.4%, and the Dow UNCH. They are often thought of as leading indicators and of course, they often can give clues to the direction of interest rates, as most small-cap names need financing to survive in their formative years. Like most of the major averages, the Russell 2000 is dealing with round number theory as it inched above the very round 2000 figure Friday. The WEEKLY chart has the look of a bull flag which also recorded a bullish engulfing candle, but I would love to see a decisive break above 202, which would carry a measured move to the 240 area. Interesting to see here how in 2024, while small caps are in pursuit of the big three major averages, it is catching up first to the Dow which is beginning to flatline. The top holding in the Russell 2000 ETF is SMCI which at just more than 1%, is three times the size of the second-largest component in ELF. Wonder how much that is skewing the performance of the IWM? The bottom line is above the 200 number keep a constructive bullish point of view. The MONTHLY chart shows a cup base possibly taking shape which could travel toward 240 by the end of 2024, which would confirm the measured move of the WEEKLY bull flag.
Ten Year Angst:
- All eyes have been on the 10-year, although for the time being the stock market has remained resilient in the face of rising rates. Notice the somewhat similar correlation since the start of 2024 for the stock market and interest rates, something that is traditionally not the norm, and was the complete opposite for Q4 2023. Which one is going to blink first? Looking at the daily chart below of the 10-year in hindsight looks clear in hindsight that the "round" 5 number was going to be a tough nut to crack with several dubious candlesticks there starting with the shooting star on 10/19 and then bearish engulfing candles on 10/26 and 11/1 before the completion of a bearish island reversal on 11/2 with the gap down (preceded by the gap up on 10/17). The WEEKLY chart of the 10-year suggests bullish action as it rests gathering stamina at the 50 WEEK SMA for the initial time following the double bottom breakout last summer, often an optimal entry point. Bulls do want to see it distance itself from that line soon, although it had spent about the same amount of time in Q2 2023 before a liftoff from 3.5 to 5%. Additionally, it found a bounce near the 40/45 RSI area where leaders will tend to floor and it could undergo a bullish WEEKLY MACD crossover too. Watch the homebuilders going forward as they have not shown any sign of weakness yet, a group that is particularly sensitive to higher rates.
China Rising:
- Many have been declaring that the stimulus in China now can be putting a backstop to an ugly period since the MONTHLY bearish gravestone candle in February 2021. It is hard to catch a falling knife, one should only do so when a technical catalyst arrives (perhaps in the form of bullish candlesticks) but the KWEB chart is starting to show some signs that suggest selling pressure may be abating. First off an old technical axiom for the daily chart below comes to mind where "not to confuse the bottom of a chart with support". I have been WRONG on this in the past with a MONTHLY doji last December, which was also a bullish harami cross, but a filling of the gap within a bullish island reversal. My thoughts now are once can get long above 24.50 with a CLOSING stop below 23. Some names in the fund are looking solid with PDD, generally a best-in-breed play, which recently filled in the gap from the 11/27 session and could now be carving out a future add-on double-bottom of 147.44. It is still in the buy range here and the Friday doji candle indicates selling pressure is softening. NTES, which we spoke about in a recent WEEK AHEAD Note too, is looking better above the very round par number. It has been demonstrating fine relative strength recently up 11.5 and 8% in the weeks ending 1/26 and 2/9 while the KWEB rose by 3 and 5% respectively.
Risk "Muted":
- We often discuss how "risk on" can be looked at in a myriad of ways in markets and this week we will examine the ARKK chart. Not surprisingly round number theory is coming into play here with the 50 figure. This was brief resistance in early December and if it can break through that level next week it could turn into support and would go on to start carving out the right side of a potential cup base (which began with a doji candle and spinning top on 12/27-28 after a 61% run from the late October lows suggested fatigue and a change in the prevailing direction which did occur). A push above 50 would also negate the bearish island reversal that was completed on the first day of 2024. Its three largest holdings in COIN TSLA and ROKU all represent roughly 8% of the fund (the concentration is a double-edged sword), and the first two have recorded swift pullbacks obviously to put it nicely. Last week COIN added 10% and looks to have successfully retested a WEEKLY bullish inverse head and shoulders breakout pivot of 115. TSLA we spoke about this week also potentially bottoming in our 2/9 Consumer Note. Other charts in the top 10 that have a nice technical note include PATH SHOP RBLX and ROKU.
Biotech On Track:
- The biotech space has been known as a very soft space since a MONTHLY shooting star in February 2021, a month where it CLOSED 15% off its intramonth highs, before a rapid descent (notice it is breaking ABOVE a 5-year-long bearish head and shoulders and we know from FALSE moves come fast ones in the opposite direction). Looking at the WEEKLY timeframe below gives some green shoots too as last week recorded a bullish engulfing week here after the prior 6 weeks all CLOSED in the lower half of the WEEKLY range. Additionally, the last time it registered such a strong rush higher from the low 60s to the low 90s it began a precipitous drop after August of 2022 completed a bearish evening star pattern. I believe its willingness to remain at this altitude is a big positive and this could touch off a spirited move to par and beyond in 2024. This action is taking place when some of the biotech giants like AMGN GILD and BIIB (I am old enough to remember when these mattered) are floundering. AMGN put up an ugly bearish WEEKLY engulfing candle falling 10%, its largest WEEKLY decline in at least 5 years in the third largest volume. GILD recorded a rug pull now on a 3-week losing streak after a nice WEEKLY cup base breakout. Let us take a look at a couple lower lower-profile names that seem to be getting a lift in the group in ARWR and IOVA.
Arrowhead Pharma:
- Biotech play up 6% YTD and lower by 2% over last one year period.
- Name 23% off most recent 52-week highs and ended 3-week losing streak last week recording a bullish hammer candle and CLOSING above the 50 WEEK SMA. After more than doubling in PRICE from 20-40 recently, looks like it's comfortable with new range between 30-40.
- Earnings reactions mostly lower off 4.7, 26.8, and 10.8% on 2/7, 11/30, and 8/8 and rose 13.6% on 2/3.
- Enter after bullish engulfing candle in round number range.
- Entry ARWR here. Stop 29.
Iovance Biotherapeutics:
- Biotech play up 13% YTD and 24% over last one year period.
- Name 11% off most recent 52-week highs and excellent relative strength this week up more than 16%. More aggressive traders could enter here after a bull flag breakout above which carries a measured move to 15. WEEKLY chart sporting nice bullish inverse head and shoulders formation.
- Earnings reactions mostly higher up 6.4, 3.8, and .1% on 8/9, 5/10, and 3/1, and fell 3.5% on 11/8.
- Enter with buy stop above cup base.
- Entry IOVA 10.41. Stop 9.