"Indecision is the Thief of Opportunity." - Cicero
Small Caps Stand Tall:
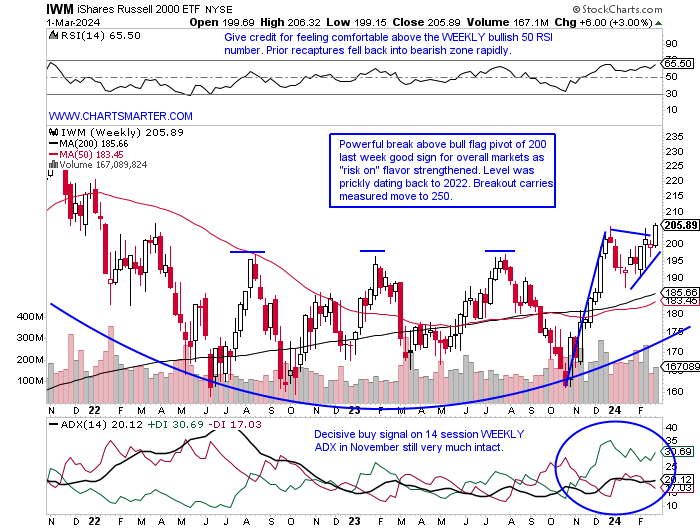
- The Russell 2000 looks ready to join the rally parade with the IWM jumping 3% last week, CLOSING at highs for the WEEKLY range and respect that it is now making it a habit finishing in the upper half of the WEEKLY range, doing so for the last 4 weeks. I will not disagree with anyone calling this a "rolling" bull market, as now the small caps take their turn showing some real strength. My opinion is that the area of former resistance just below the very round 200 number should now be support, or at least a very good risk/reward stance going forward. To me this chart looks similar to the XBI with both being sensitive to interest rate fluctunations and notice Q4 2023 the correlation between the two was almost perfect at a value of 1. The MONTHLY chart shows nice digestion of the November-December surge and is now well rested for a possible powerful move upward (notice the low of this budding cup base found support at a prior double bottom breakout from November 2020. Since the start of February it has kept pace with technology as seen here, and perhaps another sign of "risk on" is the stalling nature of the old stodgy Dow Jones, even as they attempt to spice it up with the recent addition of AMZN (the index now has just five true industrials).
Heavy Ten Year:
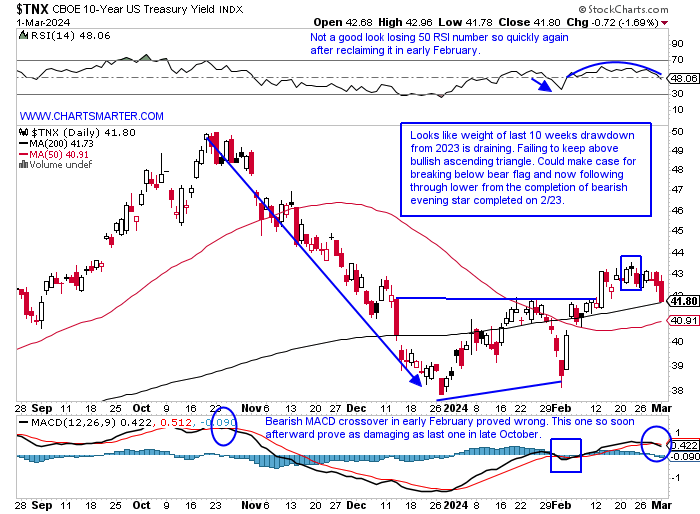
- Equity markets are cheering for a possible continuation of lower interest rates. One could maybe have foreseen some of the recent weakness with, housing stocks remaining firm amid the rates lift, and the ten-year falling almost 2 weeks and now back-to-back WEEKLY CLOSES at lows for the WEEKLY range. This may be now going from a positive to a negative after the strong WEEKLY breakout above a double bottom at the 4.1 pivot from last summer, now has the look of a bear flag which began with an evening star the week ending 11/3 that fell more than 5%, a massive move for the instrument. We have pondered which one would be the first to blink, as both rates and stocks were moving higher in tandem, but now it looks like the ten-year has, as it turns lower and the market rally marches on. One thing the bulls may be able to point to is the MONTHLY chart as it retests a bull flag breakout, but that argument is a bit flimsy with the bearish MACD crossover and no real PRICE improvement from the bearish candles last November and December (former an engulfing).
Energy Animated:
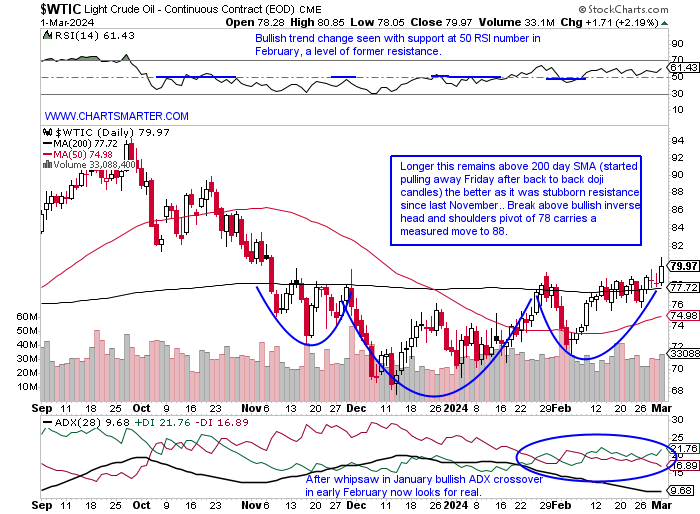
- Energy is starting to feel a bit perky and oil has not participated in the overall market rally since the lows late last October. Of course, in an election year, the last thing the incumbent party wants to see is rising crude, but this feels like it will drum to its beat. Technically the last 4 months have done just what bulls would want to see a gradual, rounding bottoming process, and the break above the bullish inverse head and shoulders Friday is a good start. Seasonality for WTI suggests some glaring weakness in March for the last four years with an average loss of more than 10%, not a typo (April-June all have positive returns each finishing the month higher than where it started). Crude and the XLE do not always trade in tandem but looking at the daily chart it is just pennies below a double bottom pivot of 87.21, and some drillers acted robustly Friday with TDW surging more than 14% after a well-received earnings reaction. The OIH feels like a good risk/reward trade here as it gains confidence above the very round 300 number which was a break above a downtrend that started in mid-October. I like how the 50 RSI level was held last week, as bearishly the 3 prior examples all quickly reversed back below the round number after reclaiming it.
Real Estate Sector Not "Reeling":
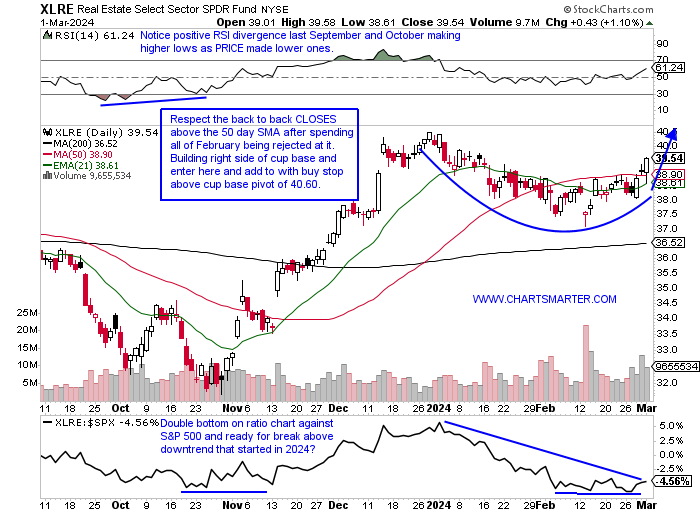
- The real estate sector is often thought of as the red-headed stepchild of the 11 major S&P sectors, but to me, this is flying nicely under the radar and technically looking sound. Last week as everyone was focusing on technology the XLRE put up a nice showing with the 2nd best return, and look at the relative rotation graph showing how powerfully the XLRE is acting. Sure this is thought of as a defensive group and if one wanted to compare it to the staples and utilities over the last 200 days this would again display a sanguine view. With all that being said I keep an overall simple approach to PRICE action and the daily chart below shows a nice, smooth rounded motion and notice how after recapturing the 21-day EMA on 2/15 (green line) if has found support there and it is now sloping higher. On its WEEKLY chart, it broke ABOVE a bearish descending triangle and it now has the look of a bull flag that the fund has found a cushion at the upward sloping 200 WEEK SMA. Looking at some top ten holdings SPG successfully retested a double bottom breakout pivot of 146.73 from 2/9 on Friday and bounced. WELL which has lagged the group somewhat also retested a double bottom breakout trigger of 91.73 Friday and now sports a bull flag and a decisive break above 94 carries a measured move to par.
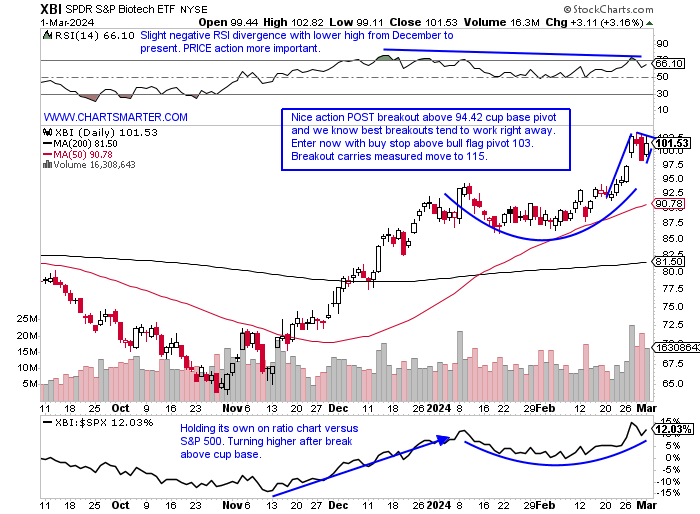
Biotech Leading:
- The biotech space last week rose more than 7% and CLOSED above the very round par number. I am a very big believer in round number theory and the fact that it blew right through it on 2/27 up 6% on the best daily volume in one year and CLOSE at the top of its range, when most instruments will reverse or pause initially at 100 was impressive. We looked at its WEEKLY chart a few weeks ago and admired how it was not shying away from the mid-90s area which was a roadblock, and more specifically holding up better than its last sprint higher in the summer of 2022. It did resemble a bull flag, but they are failure-prone below the 200 WEEK SMA and this one is now pushing right up against it with Friday's CLOSE. If one wants to look at the MONTHLY timeframe notice the firm action following the break ABOVE the bearish head and shoulders formation (we know from FALSE moves come fast ones in the opposite direction). The very round par number is crucial on this chart as well as if it can conclude March above 100 that would be its first CLOSE above the 200 WEEK SMA in more than 2 years and notice that the secular line was good support between 2016 and 2020.
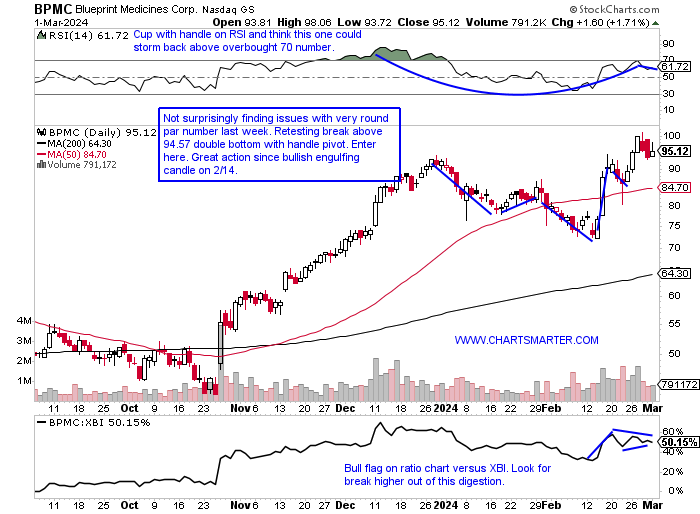
Blueprint Medicines:
- Biotech play up 3% YTD and 120% over last one year period.
- Name 6% off most recent 52-week highs and WEEKLY chart shows nice break above bull flag pivot of 85 and breakout carries measured move to 125. Has been outperforming strong biotech group for one year now.
- Earnings reactions mostly higher up 14, 25.6, and 12.6% on 2/15, 10/26, and 5/4/23, and fell 15.3% on 8/2/23.
- Enter after break above double bottom with handle pivot.
- Entry BPMC here. Stop 89.
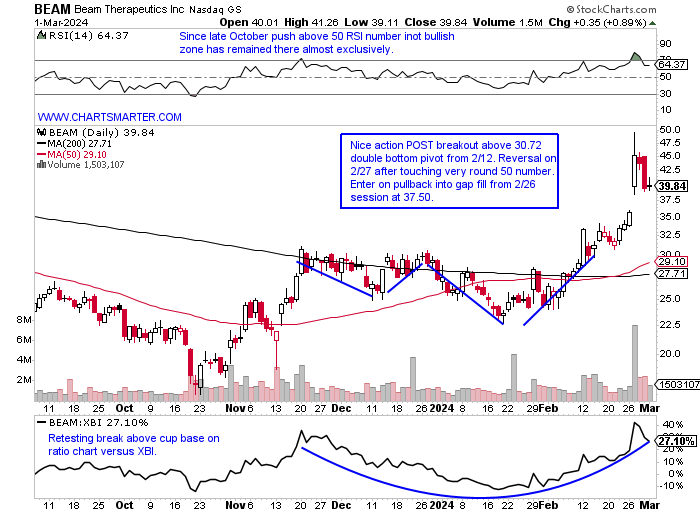
Beam Therapeuctics:
- Biotech play up 46% YTD and 3% over last one year period.
- Name 20% off most recent 52-week highs (from this week alone) and MONTHLY chart shows a definitive break above that began with a bearish dark cloud cover candle in July 2021. Strong accumulation last November and February.
- Earnings reactions mostly higher up 25.9, 2.8, and 3.9% on 2/27, 8/8, and 5/10/23, and fell 8.4% on 11/8/23.
- Enter on pullback into gap fill.
- Entry BEAM 37.50. Stop 34.25.
This article requires a Chartsmarter membership. Please click here to join.
"Indecision is the Thief of Opportunity." - Cicero
Small Caps Stand Tall:
- The Russell 2000 looks ready to join the rally parade with the IWM jumping 3% last week, CLOSING at highs for the WEEKLY range and respect that it is now making it a habit finishing in the upper half of the WEEKLY range, doing so for the last 4 weeks. I will not disagree with anyone calling this a "rolling" bull market, as now the small caps take their turn showing some real strength. My opinion is that the area of former resistance just below the very round 200 number should now be support, or at least a very good risk/reward stance going forward. To me this chart looks similar to the XBI with both being sensitive to interest rate fluctunations and notice Q4 2023 the correlation between the two was almost perfect at a value of 1. The MONTHLY chart shows nice digestion of the November-December surge and is now well rested for a possible powerful move upward (notice the low of this budding cup base found support at a prior double bottom breakout from November 2020. Since the start of February it has kept pace with technology as seen here, and perhaps another sign of "risk on" is the stalling nature of the old stodgy Dow Jones, even as they attempt to spice it up with the recent addition of AMZN (the index now has just five true industrials).
Heavy Ten Year:
- Equity markets are cheering for a possible continuation of lower interest rates. One could maybe have foreseen some of the recent weakness with, housing stocks remaining firm amid the rates lift, and the ten-year falling almost 2 weeks and now back-to-back WEEKLY CLOSES at lows for the WEEKLY range. This may be now going from a positive to a negative after the strong WEEKLY breakout above a double bottom at the 4.1 pivot from last summer, now has the look of a bear flag which began with an evening star the week ending 11/3 that fell more than 5%, a massive move for the instrument. We have pondered which one would be the first to blink, as both rates and stocks were moving higher in tandem, but now it looks like the ten-year has, as it turns lower and the market rally marches on. One thing the bulls may be able to point to is the MONTHLY chart as it retests a bull flag breakout, but that argument is a bit flimsy with the bearish MACD crossover and no real PRICE improvement from the bearish candles last November and December (former an engulfing).
Energy Animated:
- Energy is starting to feel a bit perky and oil has not participated in the overall market rally since the lows late last October. Of course, in an election year, the last thing the incumbent party wants to see is rising crude, but this feels like it will drum to its beat. Technically the last 4 months have done just what bulls would want to see a gradual, rounding bottoming process, and the break above the bullish inverse head and shoulders Friday is a good start. Seasonality for WTI suggests some glaring weakness in March for the last four years with an average loss of more than 10%, not a typo (April-June all have positive returns each finishing the month higher than where it started). Crude and the XLE do not always trade in tandem but looking at the daily chart it is just pennies below a double bottom pivot of 87.21, and some drillers acted robustly Friday with TDW surging more than 14% after a well-received earnings reaction. The OIH feels like a good risk/reward trade here as it gains confidence above the very round 300 number which was a break above a downtrend that started in mid-October. I like how the 50 RSI level was held last week, as bearishly the 3 prior examples all quickly reversed back below the round number after reclaiming it.
Real Estate Sector Not "Reeling":
- The real estate sector is often thought of as the red-headed stepchild of the 11 major S&P sectors, but to me, this is flying nicely under the radar and technically looking sound. Last week as everyone was focusing on technology the XLRE put up a nice showing with the 2nd best return, and look at the relative rotation graph showing how powerfully the XLRE is acting. Sure this is thought of as a defensive group and if one wanted to compare it to the staples and utilities over the last 200 days this would again display a sanguine view. With all that being said I keep an overall simple approach to PRICE action and the daily chart below shows a nice, smooth rounded motion and notice how after recapturing the 21-day EMA on 2/15 (green line) if has found support there and it is now sloping higher. On its WEEKLY chart, it broke ABOVE a bearish descending triangle and it now has the look of a bull flag that the fund has found a cushion at the upward sloping 200 WEEK SMA. Looking at some top ten holdings SPG successfully retested a double bottom breakout pivot of 146.73 from 2/9 on Friday and bounced. WELL which has lagged the group somewhat also retested a double bottom breakout trigger of 91.73 Friday and now sports a bull flag and a decisive break above 94 carries a measured move to par.
Biotech Leading:
- The biotech space last week rose more than 7% and CLOSED above the very round par number. I am a very big believer in round number theory and the fact that it blew right through it on 2/27 up 6% on the best daily volume in one year and CLOSE at the top of its range, when most instruments will reverse or pause initially at 100 was impressive. We looked at its WEEKLY chart a few weeks ago and admired how it was not shying away from the mid-90s area which was a roadblock, and more specifically holding up better than its last sprint higher in the summer of 2022. It did resemble a bull flag, but they are failure-prone below the 200 WEEK SMA and this one is now pushing right up against it with Friday's CLOSE. If one wants to look at the MONTHLY timeframe notice the firm action following the break ABOVE the bearish head and shoulders formation (we know from FALSE moves come fast ones in the opposite direction). The very round par number is crucial on this chart as well as if it can conclude March above 100 that would be its first CLOSE above the 200 WEEK SMA in more than 2 years and notice that the secular line was good support between 2016 and 2020.
Blueprint Medicines:
- Biotech play up 3% YTD and 120% over last one year period.
- Name 6% off most recent 52-week highs and WEEKLY chart shows nice break above bull flag pivot of 85 and breakout carries measured move to 125. Has been outperforming strong biotech group for one year now.
- Earnings reactions mostly higher up 14, 25.6, and 12.6% on 2/15, 10/26, and 5/4/23, and fell 15.3% on 8/2/23.
- Enter after break above double bottom with handle pivot.
- Entry BPMC here. Stop 89.
Beam Therapeuctics:
- Biotech play up 46% YTD and 3% over last one year period.
- Name 20% off most recent 52-week highs (from this week alone) and MONTHLY chart shows a definitive break above that began with a bearish dark cloud cover candle in July 2021. Strong accumulation last November and February.
- Earnings reactions mostly higher up 25.9, 2.8, and 3.9% on 2/27, 8/8, and 5/10/23, and fell 8.4% on 11/8/23.
- Enter on pullback into gap fill.
- Entry BEAM 37.50. Stop 34.25.