Biotech Line in the Sand:
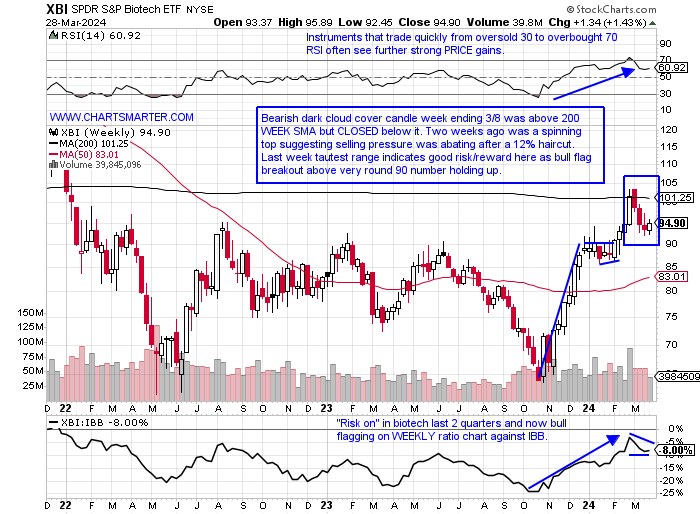
- The XBI has been tricky in 2024, and I have been chopped up somewhat. The robust move above the very round par number the week ending 3/1, which jumped more than 7% in the strongest WEEKLY volume since the week ending 5/13/22, I felt was a very good signal. All of those gains and more have been evaporated and the fund now sits 8% off most recent 52-week highs, but this week recorded a bullish engulfing candle, with the tightest range in more than 4 months (and the week before was a spinning top which often indicates at least a pause in selling or better yet a change in the prevailing direction). On the WEEKLY chart below we can see how since the start of 2023 the very round 90 number was resistance, before a bull flag breakout above the level which carries a measured move to the 115 area. I think this area offers good risk/reward here. One caveat continues to be the MONTHLY chart with the very round par number being resistance at the 50 MONTH SMA, a secular moving average it has traded above in both February and March but CLOSED below each time. A break, and CLOSE, above 100 in April would be a very bullish development for the space. On the bright side, it is still trading ABOVE the break higher from the bearish head and shoulders formation, and we know from FALSE moves come fast ones in the opposite direction.
CRISPR Participation Wanted:
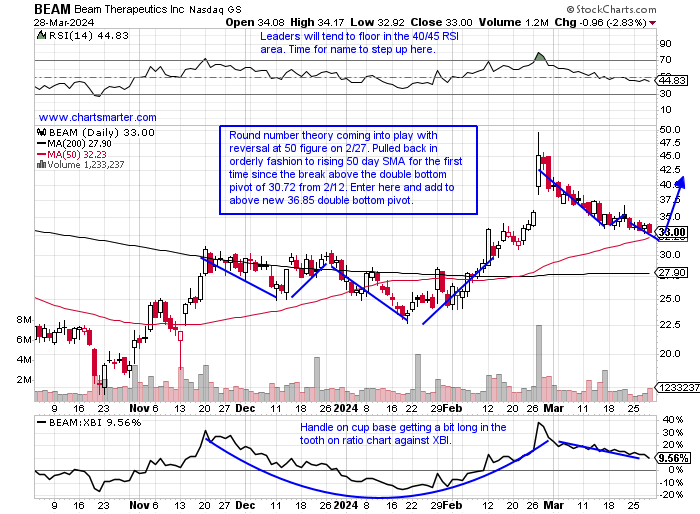
- Biotechs came alive last November with the rest of the overall market, but some stocks were more influential than others. CRSP doubled in PRICE, not a typo, in Q4 but then proceeded to break BELOW bull flags in early December and early March. It has now declined 18 of the last 22 sessions and is on a 5-week losing streak with all five CLOSING at or near lows for the WEEKLY range and is now 25% off most recent 52-week highs. If it can turn around it is setting up a 76.01 double bottom pivot. TWST is another popular name in the arena, and it too is off more than 20% from its annual peak and this chart has traded essentially sideways for the last 3 1/2 months. To me, this chart has some work to do and has the look of perhaps building the right clavicle in a bearish head and shoulders pattern. The daily chart below of BEAM in my opinion is the most attractive. It has come into contact with the rising 50-day SMA the first time following a breakout, often an optimal entry point. If any of these three names can catch a bid it could restart a nice move upward in the XBI. Notice the 50-WEEK SMA starting to curl higher for the first time in at least 2 years.
Recent Examples:
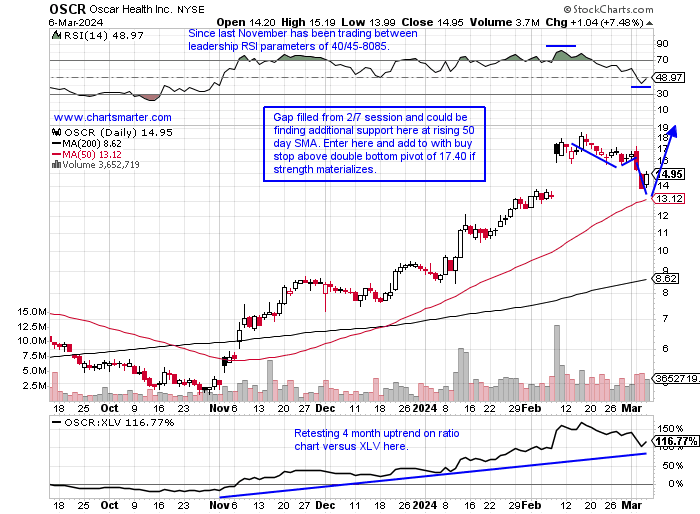
- The healthcare providers via the IHF, which is a top-heavy fund, have overall been acting well as the ETF is right at its 52-week high. It is an illiquid fund with an average daily volume of 100K shares and is now on a 4-week winning streak and has underperformed the overall healthcare space since the summer of 2022, but notice on its WEEKLY chart earlier this year it put an end to a series of lower highs and broke above a symmetrical triangle. The top holding in UNH also happens to be the most influential name in the PRICE-weighted Dow Jones at close to the very round 500 number. It is 11% off its most recent 52-week highs and recently recorded a bearish death cross. Below is the chart of OSCR, a healthcare provider, and how it appeared in our 3/7 Healthcare Note. It is back near the suggested entry and never took out the 13 stop. It continues to digest following the gap fill from the 2/7 session and presently it is back above the 21-day EMA and 50-day SMA as it potentially carves out the right side of a cup base pattern. If strength can materialize add to above to 18.65 pivot.
Special Situations:
Iovance Biotherapeutics:
- Biopharma play up 82% YTD and 138% over last one-year period.
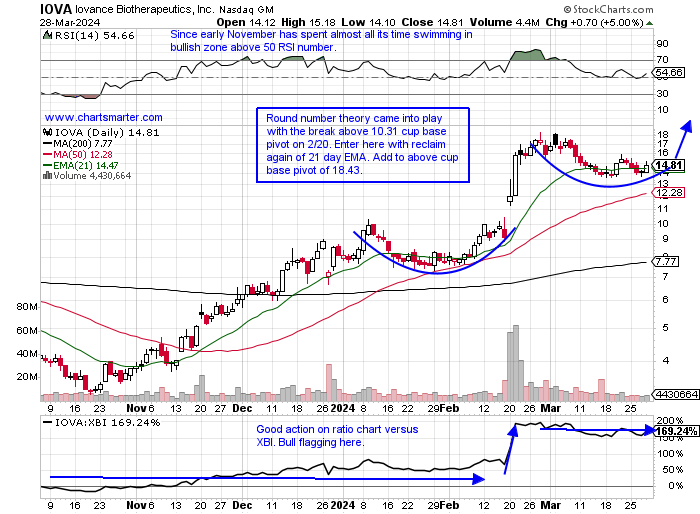
- Name 19% off most recent 52-week highs and rejection at WEEKLY downward sloping 200-day SMA with bearish engulfing candle week ending 3/8 is not following through lower. Bull flagging on WEEKLY ratio chart versus XBI.
- Earnings reactions mixed off 8.7 and 3.5% on 2/29 and 11/8/23 and rose 6.4 and 3.8% on 8/9 and 5/10/23.
- Enter with recapture of 21-day EMA.
- Entry IOVA here. Stop 13.50.
Blueprint Medicines:
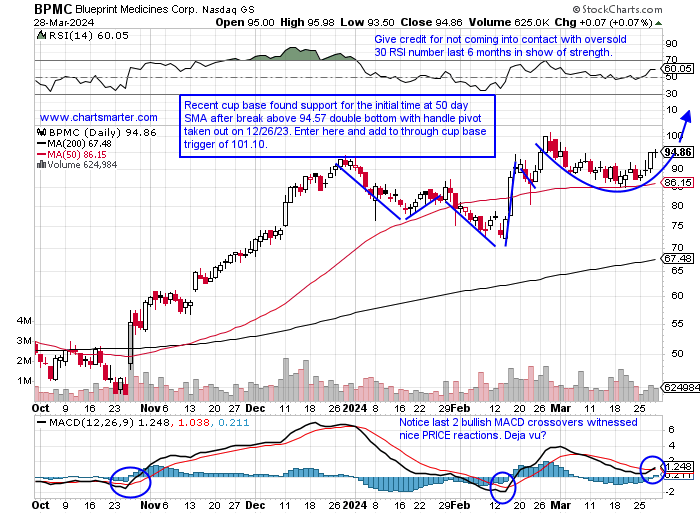
- Biotech up 3% YTD and 123% over last one year period.
- Name 6% off most recent 52-week highs and WEEKLY chart shows rejection at very round par number last week of February. Right back to WEEKLY cup with handle pivot of 94.10 and name has been outperforming biotech peers for 5 quarters now.
- Earnings reactions mostly higher up 14, 25.6, and 12.6% on 2/15, 10/26, and 5/4/23, and fell 15.3% on 8/2/23.
- Enter after reclaim of prior double bottom with handle breakout.
- Entry BPMC here. Stop 88.50.
Agios Pharma:
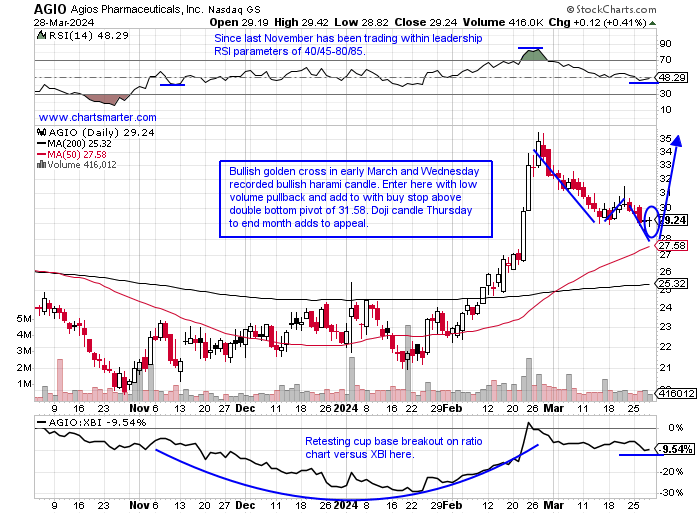
- Biopharma name up 31% YTD and 29% over last one year period.
- Name 18% off most recent 52-week highs and on 5-week losing streak. Week ending 3/22 recorded doji candle, retesting prior WEEKLY double bottom breakout, which suggests selling pressure abating. Notice on WEEKLY RSI quick move from oversold 30 to overbought 70 number bodes well for future PRICE gains.
- Earnings reactions mixed up 3.5 and 7.6% on 2/15 and 5/4/23 and fell 1.4 and .1% on 11/2 and 8/3/23.
- Enter after bullish harami candle.
- Entry AGIO here. Stop 27.50.
Good luck.
Entry summaries:
Buy after recapture of 21-day EMA IOVA here. Stop 13.50.
Buy after reclaim of prior double bottom with handle breakout BPMC here. Stop 88.50.
Buy after bullish harami candle AGIO here. Stop 27.50.
This article requires a Chartsmarter membership. Please click here to join.
Biotech Line in the Sand:
- The XBI has been tricky in 2024, and I have been chopped up somewhat. The robust move above the very round par number the week ending 3/1, which jumped more than 7% in the strongest WEEKLY volume since the week ending 5/13/22, I felt was a very good signal. All of those gains and more have been evaporated and the fund now sits 8% off most recent 52-week highs, but this week recorded a bullish engulfing candle, with the tightest range in more than 4 months (and the week before was a spinning top which often indicates at least a pause in selling or better yet a change in the prevailing direction). On the WEEKLY chart below we can see how since the start of 2023 the very round 90 number was resistance, before a bull flag breakout above the level which carries a measured move to the 115 area. I think this area offers good risk/reward here. One caveat continues to be the MONTHLY chart with the very round par number being resistance at the 50 MONTH SMA, a secular moving average it has traded above in both February and March but CLOSED below each time. A break, and CLOSE, above 100 in April would be a very bullish development for the space. On the bright side, it is still trading ABOVE the break higher from the bearish head and shoulders formation, and we know from FALSE moves come fast ones in the opposite direction.
CRISPR Participation Wanted:
- Biotechs came alive last November with the rest of the overall market, but some stocks were more influential than others. CRSP doubled in PRICE, not a typo, in Q4 but then proceeded to break BELOW bull flags in early December and early March. It has now declined 18 of the last 22 sessions and is on a 5-week losing streak with all five CLOSING at or near lows for the WEEKLY range and is now 25% off most recent 52-week highs. If it can turn around it is setting up a 76.01 double bottom pivot. TWST is another popular name in the arena, and it too is off more than 20% from its annual peak and this chart has traded essentially sideways for the last 3 1/2 months. To me, this chart has some work to do and has the look of perhaps building the right clavicle in a bearish head and shoulders pattern. The daily chart below of BEAM in my opinion is the most attractive. It has come into contact with the rising 50-day SMA the first time following a breakout, often an optimal entry point. If any of these three names can catch a bid it could restart a nice move upward in the XBI. Notice the 50-WEEK SMA starting to curl higher for the first time in at least 2 years.
Recent Examples:
- The healthcare providers via the IHF, which is a top-heavy fund, have overall been acting well as the ETF is right at its 52-week high. It is an illiquid fund with an average daily volume of 100K shares and is now on a 4-week winning streak and has underperformed the overall healthcare space since the summer of 2022, but notice on its WEEKLY chart earlier this year it put an end to a series of lower highs and broke above a symmetrical triangle. The top holding in UNH also happens to be the most influential name in the PRICE-weighted Dow Jones at close to the very round 500 number. It is 11% off its most recent 52-week highs and recently recorded a bearish death cross. Below is the chart of OSCR, a healthcare provider, and how it appeared in our 3/7 Healthcare Note. It is back near the suggested entry and never took out the 13 stop. It continues to digest following the gap fill from the 2/7 session and presently it is back above the 21-day EMA and 50-day SMA as it potentially carves out the right side of a cup base pattern. If strength can materialize add to above to 18.65 pivot.
Special Situations:
Iovance Biotherapeutics:
- Biopharma play up 82% YTD and 138% over last one-year period.
- Name 19% off most recent 52-week highs and rejection at WEEKLY downward sloping 200-day SMA with bearish engulfing candle week ending 3/8 is not following through lower. Bull flagging on WEEKLY ratio chart versus XBI.
- Earnings reactions mixed off 8.7 and 3.5% on 2/29 and 11/8/23 and rose 6.4 and 3.8% on 8/9 and 5/10/23.
- Enter with recapture of 21-day EMA.
- Entry IOVA here. Stop 13.50.
Blueprint Medicines:
- Biotech up 3% YTD and 123% over last one year period.
- Name 6% off most recent 52-week highs and WEEKLY chart shows rejection at very round par number last week of February. Right back to WEEKLY cup with handle pivot of 94.10 and name has been outperforming biotech peers for 5 quarters now.
- Earnings reactions mostly higher up 14, 25.6, and 12.6% on 2/15, 10/26, and 5/4/23, and fell 15.3% on 8/2/23.
- Enter after reclaim of prior double bottom with handle breakout.
- Entry BPMC here. Stop 88.50.
Agios Pharma:
- Biopharma name up 31% YTD and 29% over last one year period.
- Name 18% off most recent 52-week highs and on 5-week losing streak. Week ending 3/22 recorded doji candle, retesting prior WEEKLY double bottom breakout, which suggests selling pressure abating. Notice on WEEKLY RSI quick move from oversold 30 to overbought 70 number bodes well for future PRICE gains.
- Earnings reactions mixed up 3.5 and 7.6% on 2/15 and 5/4/23 and fell 1.4 and .1% on 11/2 and 8/3/23.
- Enter after bullish harami candle.
- Entry AGIO here. Stop 27.50.
Good luck.
Entry summaries:
Buy after recapture of 21-day EMA IOVA here. Stop 13.50.
Buy after reclaim of prior double bottom with handle breakout BPMC here. Stop 88.50.
Buy after bullish harami candle AGIO here. Stop 27.50.