"Victory is reserved for those who are willing to pay its price." -Sun Tzu
Weary Nasdaq?
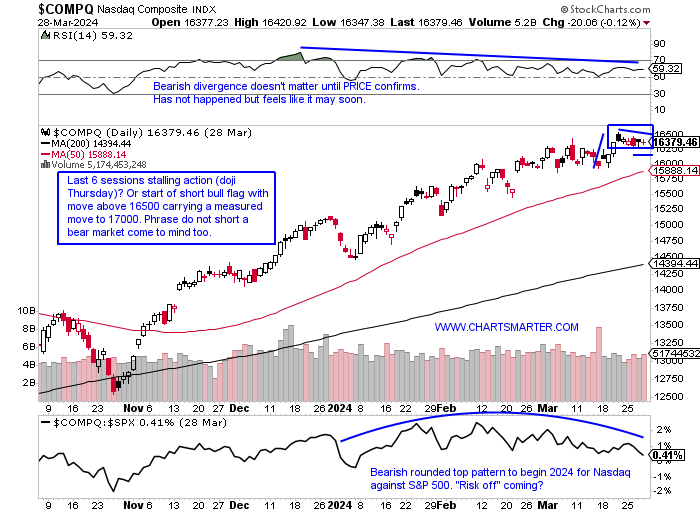
- Technology has been in the shadows recently with the exception of the semis, and last week it was the worst-performing major S&P sector out of 11 and only one of two in the red with the XLK dropping .75%. On a YTD basis, the group has been floundering, albeit higher by more than 8%, but making it just the 7th best actor overall. We will talk about software later in this note but the semis are coming into a soft seasonality period in April with the SMH CLOSING lower 3 of the last 4 years with a pedestrian average loss of 1.7%, but notice it is followed up by powerful months of May and July finishing up almost 8% and CLOSING higher 100 % of the time dating back to 2020. The daily chart of the Nasdaq below does feel stretched, now 2000 handles above its upward-sloping 200-day SMA, but peering at the MONTHLY chart Thursday broke above a 29-month cup base pivot of 16212, negating the bearish gravestone doji candle from November 2021. It is now on a 5-month win streak and 2 of the last 3 times that occurred, it fell 2 months in a row in September-October 2020, and then fell 3 months straight in August-October 2023. It feels like a continuing rotation is going on out of tech and into energy, industrials, and materials.
Golden Reversal:
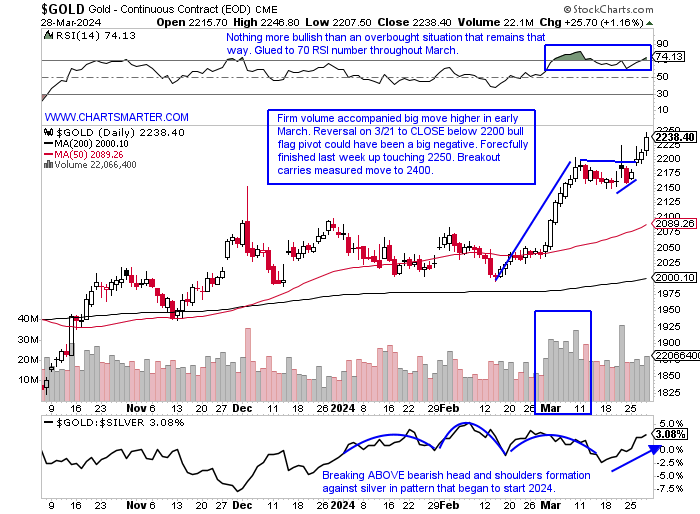
- I will frequently mention that the best breakouts tend to work right away, and if they do not it is a red flag. Last week ended with a flourish for gold gaining every day in the holiday-shortened week. However, it did not end the prior week very well with a spinning top candle on 3/21 then some follow-through lower on Friday. That reversal below the bull flag pivot at the very round 2200 number on 3/21 should have been an all-clear sign for the bears to weigh on the precious metal, but it feels like they missed their opportunity. Of course, anything can happen going forward but gold now looks like it is on a path forward to 2400 in the near term. The MONTHLY chart perhaps looks the best of all the time frames with a clear breakout above the 2100 bullish ascending triangle pivot, and it CLOSED right at the top of the MONTHLY range. Admire the volume which displayed conviction, and the fact that it negated the doji candle from February, and the back-to-back spinning tops in January and last December (which all indicate fatigue) was a very positive sign. Notice too how the MONTHLY RSI is still below the overbought 70 number, where it touched the mid-80s back in 2020 and this rally still could have legs. Any pullback toward the bull flag breakout in my opinion should be bought.
Confident Greenback:
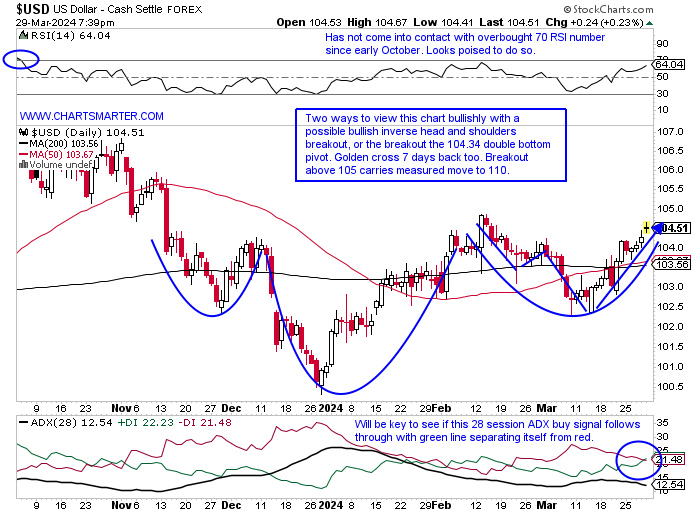
- The US dollar is feeling perky as of late. Last week it rose each session and has broken above a double bottom pivot. It has acted well since bottoming at the very round par number on 12/28/23 after recording a bullish piercing line candle. More recently it registered powerful engulfing candles on 3/14 and 3/21 with both CLOSING at highs for the daily range. At the moment the dollar and the S&P 500 are moving higher in tandem, something the total opposite of the last 2 months of 2023 seen here. Are we returning to a regime that Larry Kudlow deemed "king dollar", where markets and the greenback will rise together, or will they start to deviate away from each other like they did last November and December? It does seem like the "end of the dollar" calls have been less common and the WEEKLY chart seems to be showing some green shoots. Notice how the selloffs as of late seem to be shallower than in the past. Since the start of 2024, the dollar has recorded just 3 WEEKLY losses, and bulls have defended well since last summer with 3 higher lows. Between last July and September it recorded an 11 of 12-week win streak and a 7-week win streak to begin 2024. Prior to that, the pointed arrows on the WEEKLY chart show poor stretches falling 11 of 17, 9 of 10, 5 of 7, and 8 of 9 weeks starting in September 2022 then 3 times in 2023. The path to least resistance feels higher. On the MONTHLY chart notice the bounce off the 61.8% Fib retracement from the low in January 2021 to the peak in September 2022.
Crypto Outlier:
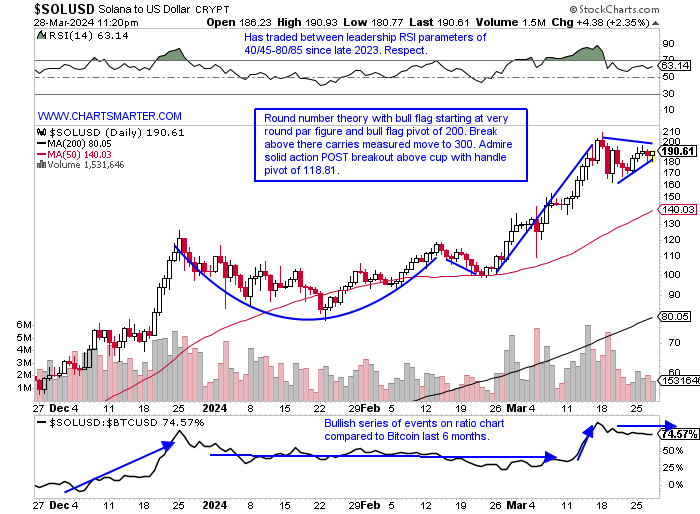
- One may think it would be a no-brainer that I am talking about Bitcoin here and that would be well deserved. It seems to be spoken about incessantly, but the reality is that Solana, since the market lows late last October has been a very impressive leader and that can be seen here. The daily chart below looks solid as a bull flag formation has taken shape, and volume has tailed off in the pattern, just what you want to see. As with any asset class, one wants to take a look at different timeframes. The WEEKLY period shows how it has now met its measured move to the 190 area from a break above the flag trigger just above 100. Notice the WEEKLY RSI has been above the overbought 70 RSI number since last October, showing that overbought does not mean PRICE is overdone as it has traveled from 60 to just above 200. Looking at the MONTHLY chart, it is approaching a cup base trigger of 260.05, albeit it is still 37% away from it. The chart complexion has a nice look to it and notice how the evening star completed in December 2021 saw a drawdown from 260 to 8, where a bullish morning star was finished in January 2023. First things first, this can be bought with a buy stop and CLOSE above 200. If that occurs look out above.
Software Lagging:
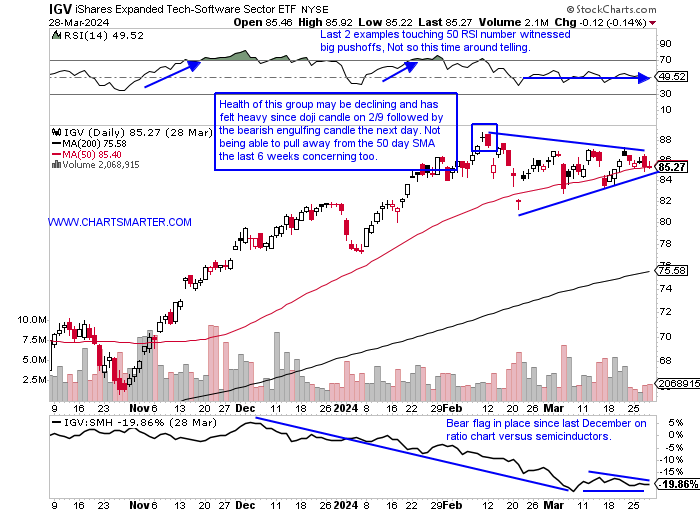
- When one brings up the software space they can not go far without mentioning MSFT. Not only is it the lone $3T company on the planet but it is the largest holding in the IGV at almost 9%. It is on a 5 session losing streak, its first since last September, but it has not amounted to much as it still trades just 2% off its most recent all-time highs. The chart may be getting ahead of itself with the back-to-back spinning top candles on 3/21-22 and like many other instruments is displaying negative RSI divergence (notice on the 28 session ADX black signal line has been slanting lower for 6 weeks which many see as a precursor to a possible trend change). The second largest holding in CRM has been waffling since the doji candle on 3/4 (was a bearish harami cross as well), and until the 320 level can be negated one should remain cautious. Notice the bearish head and shoulders (multiple) on the RSI with the important 50 level as the neckline. These 2 comprise more than 17% of the IGV and notice the ETF has been clinging to its 50-day SMA since late February. Usually one wants to see that moving average act as a springboard, and not a lengthy rest stop. A break below that symmetrical triangle now formed would be an obvious negative. The prior trend is higher so we must give it the benefit of the doubt until PRICE tells us otherwise (break below 84). Let us look at two opportunities in the space in CRWD and IOT.
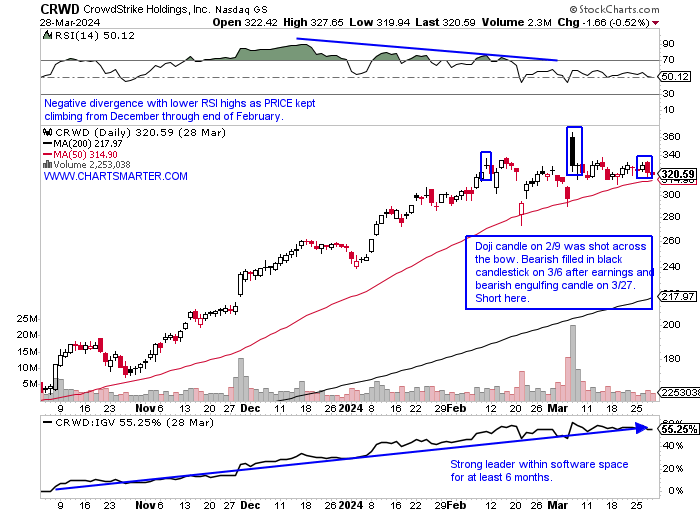
Crowdstrike:
- Software security play up 26% YTD and 149% over last one year period.
- Name 12% off most recent 52-week highs and MONTHLY chart shows spinning top candle in March, in big WEEKLY volume, which is adept at signaling changes in the prevailing direction. Still above 298.58 cup base pivot and look for retest in near term. Round number theory came into play with par save at bottom of cup pattern.
- Earnings reactions mostly higher up 10.8, 10.4, and 9.3% on 3/6, 11/29, and 8/31/23 after a loss of 1.6% on 6/1/23.
- Enter short after large filled in black candlestick.
- Entry CRWD here. Buy stop 334.
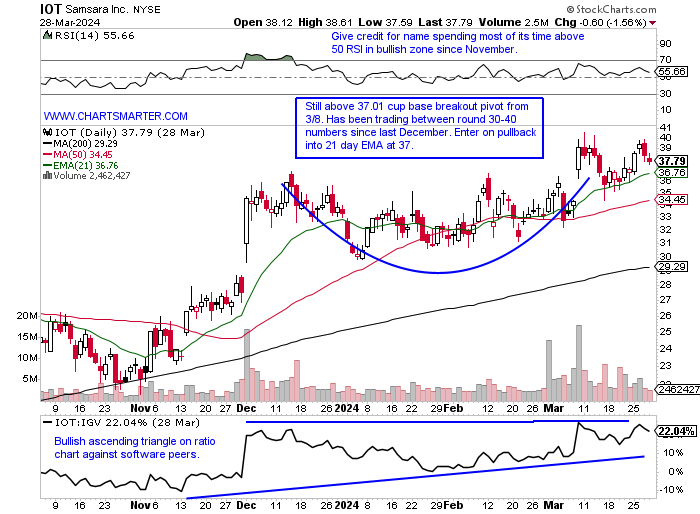
Samsara:
- Software play 13% YTD and 108% over last one year period.
- Name 7% off most recent 52-week highs and WEEKLY chart displays an institutional affinity for name over last one year period with a series of big volume WEEKLY gains and notice all of them CLOSED near the top of WEEKLY range.
- FOUR consecutive positive earnings reactions (six in total) up 14, 25.6, 13 27.9% on 3/1, 12/1, 9/1, and 6/2/23.
- Enter on pullback into 21-day EMA.
- Entry IOT 37. Stop 34.50.
This article requires a Chartsmarter membership. Please click here to join.
"Victory is reserved for those who are willing to pay its price." -Sun Tzu
Weary Nasdaq?
- Technology has been in the shadows recently with the exception of the semis, and last week it was the worst-performing major S&P sector out of 11 and only one of two in the red with the XLK dropping .75%. On a YTD basis, the group has been floundering, albeit higher by more than 8%, but making it just the 7th best actor overall. We will talk about software later in this note but the semis are coming into a soft seasonality period in April with the SMH CLOSING lower 3 of the last 4 years with a pedestrian average loss of 1.7%, but notice it is followed up by powerful months of May and July finishing up almost 8% and CLOSING higher 100 % of the time dating back to 2020. The daily chart of the Nasdaq below does feel stretched, now 2000 handles above its upward-sloping 200-day SMA, but peering at the MONTHLY chart Thursday broke above a 29-month cup base pivot of 16212, negating the bearish gravestone doji candle from November 2021. It is now on a 5-month win streak and 2 of the last 3 times that occurred, it fell 2 months in a row in September-October 2020, and then fell 3 months straight in August-October 2023. It feels like a continuing rotation is going on out of tech and into energy, industrials, and materials.
Golden Reversal:
- I will frequently mention that the best breakouts tend to work right away, and if they do not it is a red flag. Last week ended with a flourish for gold gaining every day in the holiday-shortened week. However, it did not end the prior week very well with a spinning top candle on 3/21 then some follow-through lower on Friday. That reversal below the bull flag pivot at the very round 2200 number on 3/21 should have been an all-clear sign for the bears to weigh on the precious metal, but it feels like they missed their opportunity. Of course, anything can happen going forward but gold now looks like it is on a path forward to 2400 in the near term. The MONTHLY chart perhaps looks the best of all the time frames with a clear breakout above the 2100 bullish ascending triangle pivot, and it CLOSED right at the top of the MONTHLY range. Admire the volume which displayed conviction, and the fact that it negated the doji candle from February, and the back-to-back spinning tops in January and last December (which all indicate fatigue) was a very positive sign. Notice too how the MONTHLY RSI is still below the overbought 70 number, where it touched the mid-80s back in 2020 and this rally still could have legs. Any pullback toward the bull flag breakout in my opinion should be bought.
Confident Greenback:
- The US dollar is feeling perky as of late. Last week it rose each session and has broken above a double bottom pivot. It has acted well since bottoming at the very round par number on 12/28/23 after recording a bullish piercing line candle. More recently it registered powerful engulfing candles on 3/14 and 3/21 with both CLOSING at highs for the daily range. At the moment the dollar and the S&P 500 are moving higher in tandem, something the total opposite of the last 2 months of 2023 seen here. Are we returning to a regime that Larry Kudlow deemed "king dollar", where markets and the greenback will rise together, or will they start to deviate away from each other like they did last November and December? It does seem like the "end of the dollar" calls have been less common and the WEEKLY chart seems to be showing some green shoots. Notice how the selloffs as of late seem to be shallower than in the past. Since the start of 2024, the dollar has recorded just 3 WEEKLY losses, and bulls have defended well since last summer with 3 higher lows. Between last July and September it recorded an 11 of 12-week win streak and a 7-week win streak to begin 2024. Prior to that, the pointed arrows on the WEEKLY chart show poor stretches falling 11 of 17, 9 of 10, 5 of 7, and 8 of 9 weeks starting in September 2022 then 3 times in 2023. The path to least resistance feels higher. On the MONTHLY chart notice the bounce off the 61.8% Fib retracement from the low in January 2021 to the peak in September 2022.
Crypto Outlier:
- One may think it would be a no-brainer that I am talking about Bitcoin here and that would be well deserved. It seems to be spoken about incessantly, but the reality is that Solana, since the market lows late last October has been a very impressive leader and that can be seen here. The daily chart below looks solid as a bull flag formation has taken shape, and volume has tailed off in the pattern, just what you want to see. As with any asset class, one wants to take a look at different timeframes. The WEEKLY period shows how it has now met its measured move to the 190 area from a break above the flag trigger just above 100. Notice the WEEKLY RSI has been above the overbought 70 RSI number since last October, showing that overbought does not mean PRICE is overdone as it has traveled from 60 to just above 200. Looking at the MONTHLY chart, it is approaching a cup base trigger of 260.05, albeit it is still 37% away from it. The chart complexion has a nice look to it and notice how the evening star completed in December 2021 saw a drawdown from 260 to 8, where a bullish morning star was finished in January 2023. First things first, this can be bought with a buy stop and CLOSE above 200. If that occurs look out above.
Software Lagging:
- When one brings up the software space they can not go far without mentioning MSFT. Not only is it the lone $3T company on the planet but it is the largest holding in the IGV at almost 9%. It is on a 5 session losing streak, its first since last September, but it has not amounted to much as it still trades just 2% off its most recent all-time highs. The chart may be getting ahead of itself with the back-to-back spinning top candles on 3/21-22 and like many other instruments is displaying negative RSI divergence (notice on the 28 session ADX black signal line has been slanting lower for 6 weeks which many see as a precursor to a possible trend change). The second largest holding in CRM has been waffling since the doji candle on 3/4 (was a bearish harami cross as well), and until the 320 level can be negated one should remain cautious. Notice the bearish head and shoulders (multiple) on the RSI with the important 50 level as the neckline. These 2 comprise more than 17% of the IGV and notice the ETF has been clinging to its 50-day SMA since late February. Usually one wants to see that moving average act as a springboard, and not a lengthy rest stop. A break below that symmetrical triangle now formed would be an obvious negative. The prior trend is higher so we must give it the benefit of the doubt until PRICE tells us otherwise (break below 84). Let us look at two opportunities in the space in CRWD and IOT.
Crowdstrike:
- Software security play up 26% YTD and 149% over last one year period.
- Name 12% off most recent 52-week highs and MONTHLY chart shows spinning top candle in March, in big WEEKLY volume, which is adept at signaling changes in the prevailing direction. Still above 298.58 cup base pivot and look for retest in near term. Round number theory came into play with par save at bottom of cup pattern.
- Earnings reactions mostly higher up 10.8, 10.4, and 9.3% on 3/6, 11/29, and 8/31/23 after a loss of 1.6% on 6/1/23.
- Enter short after large filled in black candlestick.
- Entry CRWD here. Buy stop 334.
Samsara:
- Software play 13% YTD and 108% over last one year period.
- Name 7% off most recent 52-week highs and WEEKLY chart displays an institutional affinity for name over last one year period with a series of big volume WEEKLY gains and notice all of them CLOSED near the top of WEEKLY range.
- FOUR consecutive positive earnings reactions (six in total) up 14, 25.6, 13 27.9% on 3/1, 12/1, 9/1, and 6/2/23.
- Enter on pullback into 21-day EMA.
- Entry IOT 37. Stop 34.50.