Markets finished up a nice week Friday as the major averages all went out on highs, but CLOSING near the UNCH mark. The Nasdaq is on a 9 session winning streak, and more impressive is the last 8 day CLOSED at or in the upper half of the daily range, a hallmark trait (the first day of the streak recorded a bullish harami off the rising 50 day SMA on 9/26). More to like is the tech rich index is higher 4 of the last 6 weeks and all four of the up weeks gained 1% or more. The S&P 500 is one upping the Nasdaq as it has risen 6 of the last 7 weeks, with all 7 CLOSING in the upper half of the weekly range. For the week the Nasdaq added 1.4% and the S&P 500 1.2%. The Russell 2000 rose 1.3% and has the look of a bull flag formation and could have a measured move of 160 handles, which seems incredulous at this point. On a YTD basis the small cap benchmark is up 11.3% and quickly playing catch up to the S&P 500 that has risen 13.9% thus far. The Nasdaq looks like Secretariat here, higher by 22.4%.
Looking at individual groups today technology led, but meekly so with the XLK higher by just .15%. The cyclicals and financials were the only other major S&P sector to gain ground Friday and both did so fractionally. Lagging badly were the energy and the staples, with the XLE down .8% and the XLP by 1%. The bullish inverse head and shoulders breakout for WTI, at the very round 50 figure, is being threatened here as it CLOSED below its 200 day SMA. Crude has decline 5 of the last 7 sessions beginning with the bearish shooting star on 9/28. On a weekly basis the materials were the clear leader with the XLB jumping 2%, and it is now on a 4 week winning streak up 5.2% in the time frame. The financials were runners up as the XLF rose 1.9%. The only two S&P sectors to fall on a weekly basis were the XLE hitting a bump at its 200 day SMA. The XLP dropped .3% in the largest weekly volume in 10 months, and is still off just a modest 6% from most recent 52 week highs.
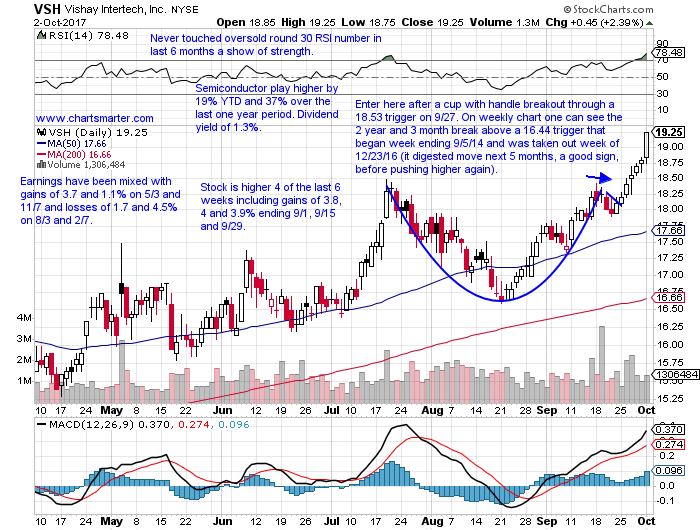
As the indexes scored nice gains and stocks obviously followed along, some outperformed handsomely. On the other hand some acted fabulously. Lets stick with the technology group and look at VSH, and below is how it was presented in our Tuesday 10/3 Game Plan. This week it romped higher by more than 9% in the best weekly volume in 22 months and CLOSED above the very round 20 number for the first time in more than 13 years. Notice the RSI was at 78 earlier in the week, and finished the week above 87, so one may want to see some digestion here around the 20 figure before entering, or even closer to the cup with handle retest. But this is a good example of why stocks that look overbought on an RSI basis can still climb firmly higher. Many traders I know just focus on PRICE action and take indicators like RSI and MACD off their charts.
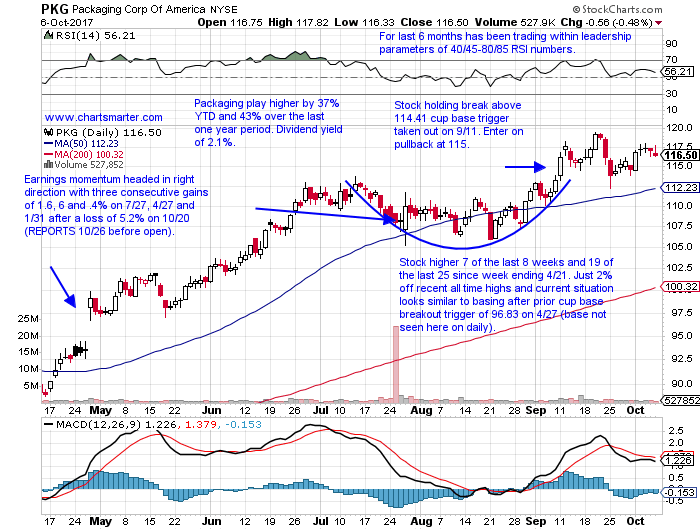
Stocks that can be bought after recent cup base breakouts are PKG. PKG is a packaging play higher by 37% YTD and 43% over the last one year period and sports a dividend yield of 2.1%. Earnings momentum is headed in right direction with three consecutive gains of 1.6, 6 and .4% on 7/27, 4/27 and 1/31 after a loss of 5.2% on 10/20 (it REPORTS 10/26 before open). The stock is higher 7 of the last 8 weeks, and 19 of the last 25 since week ending 4/21. It not sits just 2% off recent all time highs and current situation looks similar to basing after prior cup base breakout trigger of 96.83 on 4/27. PKG is holding the break above a 114.41 cup base trigger taken out on 9/11. Enter on pullback at 115.
Trigger PKG 115. Stop 111.
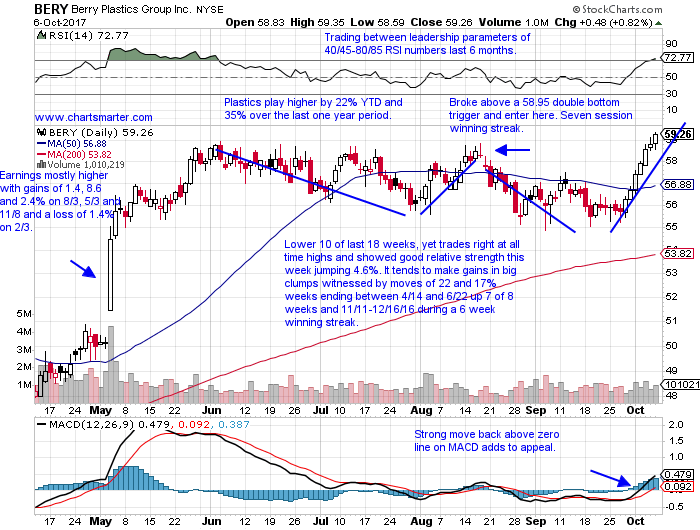
Stocks that can be bought after recent double bottom breakouts are BERY. BERY is a plastics play higher by 22% YTD and 35% over the last one year period. Earnings have been mostly higher with gains of 1.4, 8.6 and 2.4% on 8/3, 5/3 and 11/8 and a loss of 1.4% on 2/3. The stock is lower 10 of the last 18 weeks, yet trades right at all time highs and did demonstrate good relative strength this week jumping 4.6%. It tends to make gains in big clumps witnessed by moves of 22 and 17% weeks ending between 4/14 and 6/22 up 7 of 8 weeks and 11/11-12/16/16 during a 6 week winning streak. BERY broke above a 58.95 double bottom trigger and enter here.
Trigger BERY here. Stop 57.
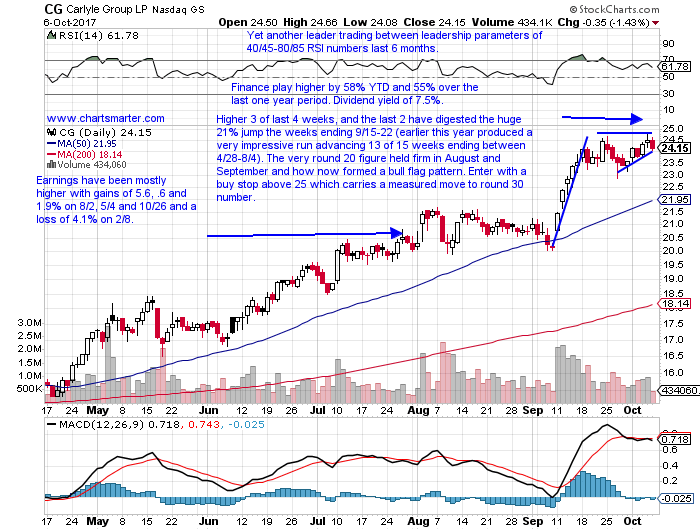
Stocks that can be bought as they take out bull flag formations are CG. CG is a finance play higher by 58% YTD and 55% over the last one year period and sports a dividend yield of 7.5%. Earnings have been mostly higher with gains of 5.6, .6 and 1.9% on 8/2, 5/4 and 10/26 and a loss of 4.1% on 2/8. The stock is higher 3 of the last 4 weeks, and the last 2 have digested the huge 21% jump the weeks ending 9/15-22 (earlier this year produced a very impressive run advancing 13 of 15 weeks ending between 4/28-8/4). The very round 20 figure held firm in August and September and how now formed a bull flag pattern. Enter CG with a buy stop above 25 which carries a measured move to round 30 number.
Trigger CG 25. Stop 23.50.
Stocks that can be bought after recent breaks above bull flag formations are LQ PII. LQ is a leisure play higher by 25% YTD and 59% over last one year period. Earnings have been mostly lower with three consecutive losses of 4.1, .7 and .1% on 5/4, 3/1 and 11/3 before a recent gain of 1.3% on 8/8. The stock is on a 7 week winning streak and higher 10 of the last 11 and recorded a nice double bottom at round 10 number weeks ending 2/12/16 and 11/4/16 (the latter kicked off an 11 week winning streak ending between 11/4-1/13/17 which rose 30%). LQ broke above a bull flag trigger of 17.50 in strong trade Friday and has a measured move to round 20 number. Enter here.
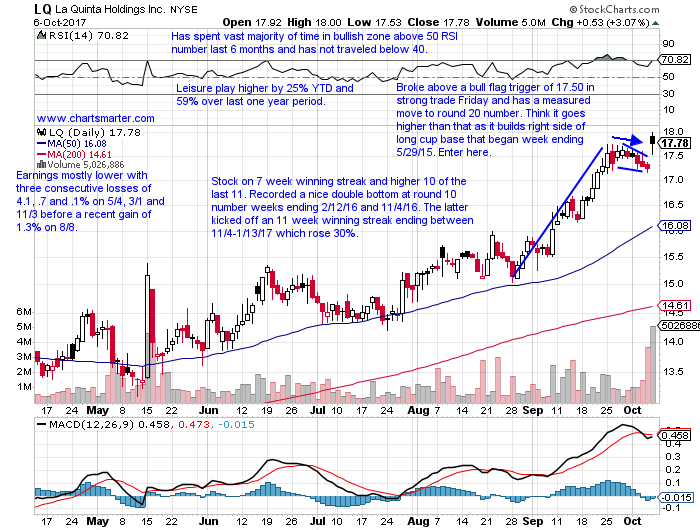
Trigger LQ here. Stop 17.
PII is a consumer play higher by 26% YTD and 34% over the last one year period and sports a dividend yield of 2.2%. Earnings momentum is decent with back to back gains of 4.3 and .5% on 7/20 and 4/25 and losses of 1.3 and 3.7% on 1/24 and 10/25 (it REPORTS 10/24 before open). The stock is lower the last 2 weeks by a combined 3.2%, but prior to that rose 19% during 5 week winning streak ending between 8/25-9/22. PII broke above a bull flag trigger that aligned with the very round par number on 9/13 and enter on pullback at 102.50. On weekly chart it looks like a break above a bullish weekly ascending triangle that was halted at the round 100 number weeks ending 3/18-4/1/16, 4/22-5/6/16 (week ending 4/22 CLOSED above), 7/29/16 and 7/21/17. Measured move there would be to 132 as pattern began week ending 1/29/16 near 68. Admire the bullish hammer candles the last 2 days of the week.
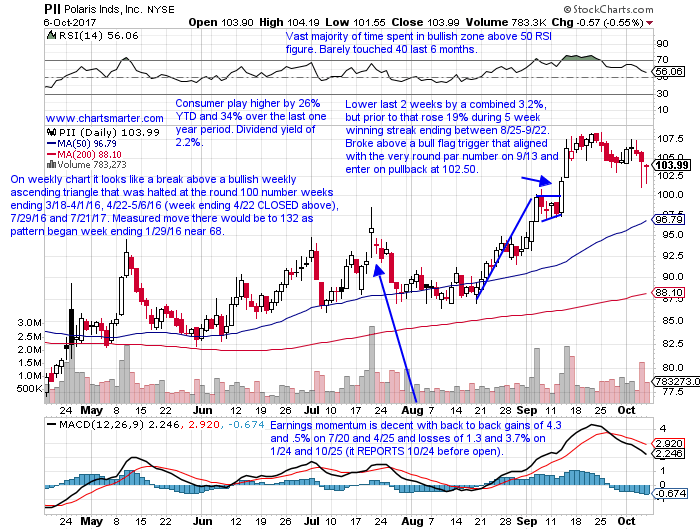
Trigger PII 102.50. Stop 97.25.
Stocks to be considered shorting opportunities are BBBY. BBBY is a retail laggard lower by 44% YTD and 47% over the last one year period and sports a dividend yield of 2.6% (the fact that it has not participated whereas many in the group have bounced strongly is very well a tell). Earnings have been mostly lower with big losses of 15.9, 12.1 and 9.2% on 9/20, 6/23 and 12/22 and a gain of 3.4% on 4/6. The stock is lower 9 of the last 17 weeks and is now 53% off most recent 52 week highs. BBBY now sports a bear flag pattern and look to short with a sell stop of 22.80 which carries a measured move to 15.
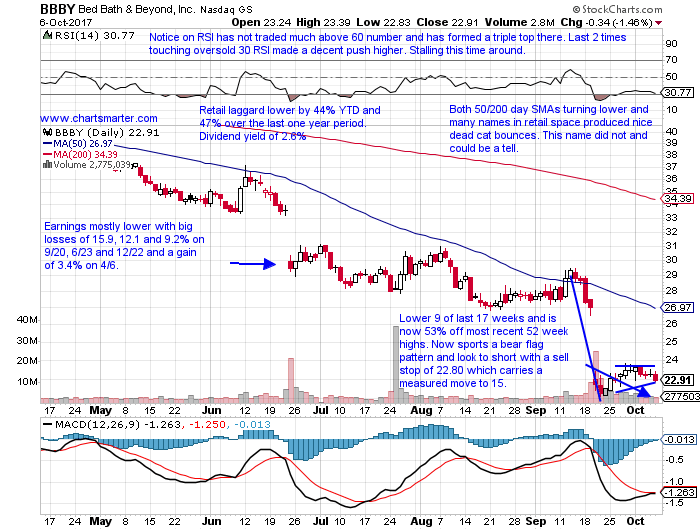
Trigger BBBY 22.80. Buy stop 24.
Good luck.
The author is flat.
Trigger summaries:
Buy after recent cup base breakout PKG 115. Stop 111.
Buy after recent double bottom breakout BERY here. Stop 57.
Buy stop above bull flag CG 25. Stop 23.50.
Buy after recent break above bull flag LQ here. Stop 17.
Buy after recent break above bull flag PII 102.50. Stop 97.25.
Sell stop to short below bear flag BBBY 22.80. Buy stop 24.
Markets finished up a nice week Friday as the major averages all went out on highs, but CLOSING near the UNCH mark. The Nasdaq is on a 9 session winning streak, and more impressive is the last 8 day CLOSED at or in the upper half of the daily range, a hallmark trait (the first day of the streak recorded a bullish harami off the rising 50 day SMA on 9/26). More to like is the tech rich index is higher 4 of the last 6 weeks and all four of the up weeks gained 1% or more. The S&P 500 is one upping the Nasdaq as it has risen 6 of the last 7 weeks, with all 7 CLOSING in the upper half of the weekly range. For the week the Nasdaq added 1.4% and the S&P 500 1.2%. The Russell 2000 rose 1.3% and has the look of a bull flag formation and could have a measured move of 160 handles, which seems incredulous at this point. On a YTD basis the small cap benchmark is up 11.3% and quickly playing catch up to the S&P 500 that has risen 13.9% thus far. The Nasdaq looks like Secretariat here, higher by 22.4%.
Looking at individual groups today technology led, but meekly so with the XLK higher by just .15%. The cyclicals and financials were the only other major S&P sector to gain ground Friday and both did so fractionally. Lagging badly were the energy and the staples, with the XLE down .8% and the XLP by 1%. The bullish inverse head and shoulders breakout for WTI, at the very round 50 figure, is being threatened here as it CLOSED below its 200 day SMA. Crude has decline 5 of the last 7 sessions beginning with the bearish shooting star on 9/28. On a weekly basis the materials were the clear leader with the XLB jumping 2%, and it is now on a 4 week winning streak up 5.2% in the time frame. The financials were runners up as the XLF rose 1.9%. The only two S&P sectors to fall on a weekly basis were the XLE hitting a bump at its 200 day SMA. The XLP dropped .3% in the largest weekly volume in 10 months, and is still off just a modest 6% from most recent 52 week highs.
As the indexes scored nice gains and stocks obviously followed along, some outperformed handsomely. On the other hand some acted fabulously. Lets stick with the technology group and look at VSH, and below is how it was presented in our Tuesday 10/3 Game Plan. This week it romped higher by more than 9% in the best weekly volume in 22 months and CLOSED above the very round 20 number for the first time in more than 13 years. Notice the RSI was at 78 earlier in the week, and finished the week above 87, so one may want to see some digestion here around the 20 figure before entering, or even closer to the cup with handle retest. But this is a good example of why stocks that look overbought on an RSI basis can still climb firmly higher. Many traders I know just focus on PRICE action and take indicators like RSI and MACD off their charts.
Stocks that can be bought after recent cup base breakouts are PKG. PKG is a packaging play higher by 37% YTD and 43% over the last one year period and sports a dividend yield of 2.1%. Earnings momentum is headed in right direction with three consecutive gains of 1.6, 6 and .4% on 7/27, 4/27 and 1/31 after a loss of 5.2% on 10/20 (it REPORTS 10/26 before open). The stock is higher 7 of the last 8 weeks, and 19 of the last 25 since week ending 4/21. It not sits just 2% off recent all time highs and current situation looks similar to basing after prior cup base breakout trigger of 96.83 on 4/27. PKG is holding the break above a 114.41 cup base trigger taken out on 9/11. Enter on pullback at 115.
Trigger PKG 115. Stop 111.
Stocks that can be bought after recent double bottom breakouts are BERY. BERY is a plastics play higher by 22% YTD and 35% over the last one year period. Earnings have been mostly higher with gains of 1.4, 8.6 and 2.4% on 8/3, 5/3 and 11/8 and a loss of 1.4% on 2/3. The stock is lower 10 of the last 18 weeks, yet trades right at all time highs and did demonstrate good relative strength this week jumping 4.6%. It tends to make gains in big clumps witnessed by moves of 22 and 17% weeks ending between 4/14 and 6/22 up 7 of 8 weeks and 11/11-12/16/16 during a 6 week winning streak. BERY broke above a 58.95 double bottom trigger and enter here.
Trigger BERY here. Stop 57.
Stocks that can be bought as they take out bull flag formations are CG. CG is a finance play higher by 58% YTD and 55% over the last one year period and sports a dividend yield of 7.5%. Earnings have been mostly higher with gains of 5.6, .6 and 1.9% on 8/2, 5/4 and 10/26 and a loss of 4.1% on 2/8. The stock is higher 3 of the last 4 weeks, and the last 2 have digested the huge 21% jump the weeks ending 9/15-22 (earlier this year produced a very impressive run advancing 13 of 15 weeks ending between 4/28-8/4). The very round 20 figure held firm in August and September and how now formed a bull flag pattern. Enter CG with a buy stop above 25 which carries a measured move to round 30 number.
Trigger CG 25. Stop 23.50.
Stocks that can be bought after recent breaks above bull flag formations are LQ PII. LQ is a leisure play higher by 25% YTD and 59% over last one year period. Earnings have been mostly lower with three consecutive losses of 4.1, .7 and .1% on 5/4, 3/1 and 11/3 before a recent gain of 1.3% on 8/8. The stock is on a 7 week winning streak and higher 10 of the last 11 and recorded a nice double bottom at round 10 number weeks ending 2/12/16 and 11/4/16 (the latter kicked off an 11 week winning streak ending between 11/4-1/13/17 which rose 30%). LQ broke above a bull flag trigger of 17.50 in strong trade Friday and has a measured move to round 20 number. Enter here.
Trigger LQ here. Stop 17.
PII is a consumer play higher by 26% YTD and 34% over the last one year period and sports a dividend yield of 2.2%. Earnings momentum is decent with back to back gains of 4.3 and .5% on 7/20 and 4/25 and losses of 1.3 and 3.7% on 1/24 and 10/25 (it REPORTS 10/24 before open). The stock is lower the last 2 weeks by a combined 3.2%, but prior to that rose 19% during 5 week winning streak ending between 8/25-9/22. PII broke above a bull flag trigger that aligned with the very round par number on 9/13 and enter on pullback at 102.50. On weekly chart it looks like a break above a bullish weekly ascending triangle that was halted at the round 100 number weeks ending 3/18-4/1/16, 4/22-5/6/16 (week ending 4/22 CLOSED above), 7/29/16 and 7/21/17. Measured move there would be to 132 as pattern began week ending 1/29/16 near 68. Admire the bullish hammer candles the last 2 days of the week.
Trigger PII 102.50. Stop 97.25.
Stocks to be considered shorting opportunities are BBBY. BBBY is a retail laggard lower by 44% YTD and 47% over the last one year period and sports a dividend yield of 2.6% (the fact that it has not participated whereas many in the group have bounced strongly is very well a tell). Earnings have been mostly lower with big losses of 15.9, 12.1 and 9.2% on 9/20, 6/23 and 12/22 and a gain of 3.4% on 4/6. The stock is lower 9 of the last 17 weeks and is now 53% off most recent 52 week highs. BBBY now sports a bear flag pattern and look to short with a sell stop of 22.80 which carries a measured move to 15.
Trigger BBBY 22.80. Buy stop 24.
Good luck.
The author is flat.
Trigger summaries:
Buy after recent cup base breakout PKG 115. Stop 111.
Buy after recent double bottom breakout BERY here. Stop 57.
Buy stop above bull flag CG 25. Stop 23.50.
Buy after recent break above bull flag LQ here. Stop 17.
Buy after recent break above bull flag PII 102.50. Stop 97.25.
Sell stop to short below bear flag BBBY 22.80. Buy stop 24.