Markets recorded a late session reversal to end 2017 on Friday giving some of the major indexes sizable losses including the Nasdaq and Russell 2000 which fell by .7 and .9% respectively. For the week that late selloff Friday snapped 5 week winning streaks for the S&P 500 and Dow with each falling .4 and .1% respectively. The Nasdaq lost .8% for the week. The Dow and S&P 500 still both look productive as they sport bull flag formations, the Nasdaq could easily test its rising 50 day SMA 100 handles lower. The week showed little volatility until Friday as the Nasdaq for one has intraday ranges of 18, 26, 24 and 18 points Monday-Thursday. So much for intraday swings with market participants pretty much away and volume soft. For the year it was a jolly one with the Nasdaq up 29, Dow 25 and S&P 500 by 19%. Some things to look forward to starting 2018 is the softness in the greenback as it has broken below a bearish head and shoulders pattern. That has some bullish inverse reaction with commodities jumping as copper put in a 16 session winning streak and energy surged nearly 5% in December. Remember in 2018 and always to watch unbiased PRICE action. Everyone will have a prediction and I have heard bears saying that "Charles Schwab clients' cash levels reached their lowest level on record recently (the 'dumb money' is all-in the market, basically)", to the elevated AAII extreme bullish sentiment readings. If anything those kind of headlines can further fuel this rally. But remember too that we must always be privy to what we can lose and capital preservation is paramount. In summary, keep your losses small and let your winners run and block out all the noise.
Looking at individual groups on a weekly basis for the last week of '17 there were not any big movers or losers. Things of note were the XLK falling .9%, the weeks worst performing group, and losing ground back to back weeks for the first time since mid August to show you how resilient technology overall has been. The staples which seems to be a consensus avoider group every year CLOSED UNCH this week, but has finished the last 4 weeks very taut, and the last 3 very tight all within just TWO pennies of each other. That type of narrow trade can often lead to powerful advances, even within the defensive staples arena. It would be remiss if we did not examine sectors for the whole of 2017 and technology was the best actor with information technology advancing 36.9%, and four of the next groups all put in a good bid for second place. The materials rose 21.4, discretionary 21.2 and both healthcare and financials gained 20%. Each of the aforementioned groups beat the S&P 500's 19.4% gain in 2017. Lagging were the utilities which added 8.3%, and the only sectors to fall on a YTD basis were telecom and energy spaces off 6 and 3.8% respectively. On a monthly basis for December most groups were subdued with the exception of big bifurcation regarding the telecoms rising 5.8% and the utilities DROPPING 6.4% and the XLU recording a bearish monthly engulfing candle from all time highs.
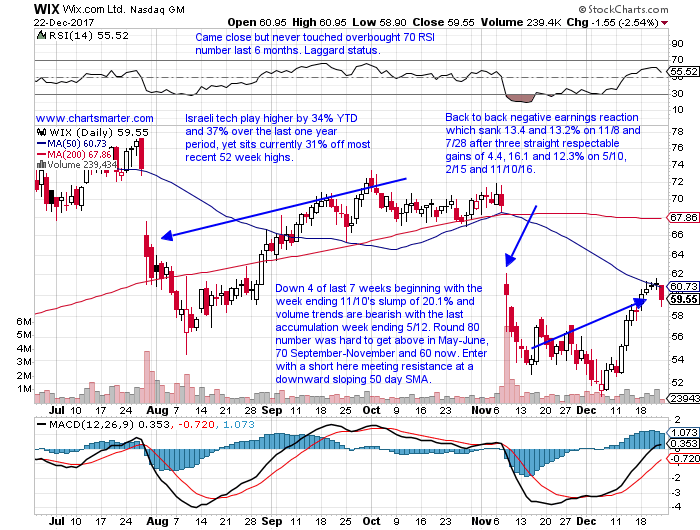
In a year in which the vast majority of stocks rose handsomely, of course there were some that were not invited to the party. That is often a tell when a name gets left behind on a firm, overall tape. Below is the chart of WIX and how it appeared in our Tuesday 12/26 Game Plan and it now rests 33% off most recent 52 week highs. This was a good example of always being cautious as this stock was a strong leader during a run from 15 the week ending 2/12/16 to 86 the week ending 4/28. Since then however it has declined 18 of the last 34 weeks, and where one negative earnings reaction can be forgiven, back to back misses could spell trouble. In the very least the company now has the burden of proof to convince bulls it is on the straight and narrow. It looks like it could gravitate to the round 50 number early next year and if that does not hold look out below.
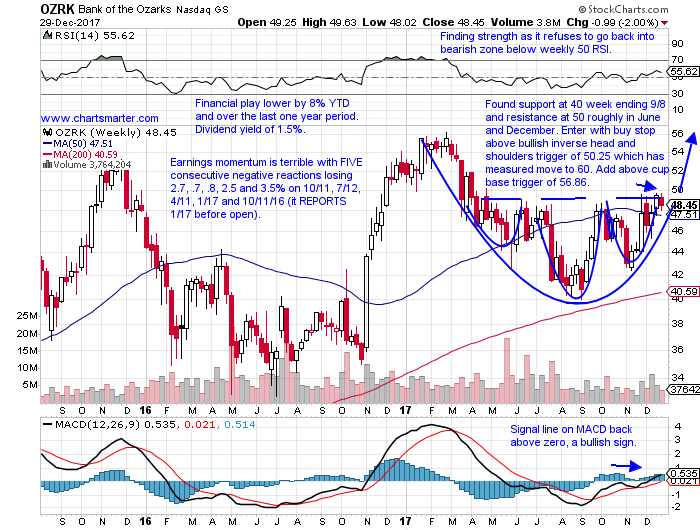
Stocks that can be bought as they tae out bullish inverse head and shoulders patterns are OZRK. OZRK is a financial play lower by 8% YTD and over the last one year period and sports a dividend yield of 1.5%. Earnings momentum is terrible with FIVE consecutive negative reactions losing 2.7, .7, .8, 2.5 and 3.5% on 10/11, 7/12, 4/11, 1/17 and 10/11/16 (it REPORTS 1/17 before open). The stock is higher 5 of the last 7 weeks and has traded between the round 40 and 50 numbers since the beginning of April '17. It found support at 40 week ending 9/8 and resistance at 50 roughly in June and December. Enter OZRK with a buy stop above a bullish inverse head and shoulders trigger of 50.25 which has a measured move to 60. One can add above cup base trigger of 56.86.
Trigger OZRK 50.25. Stop 47.
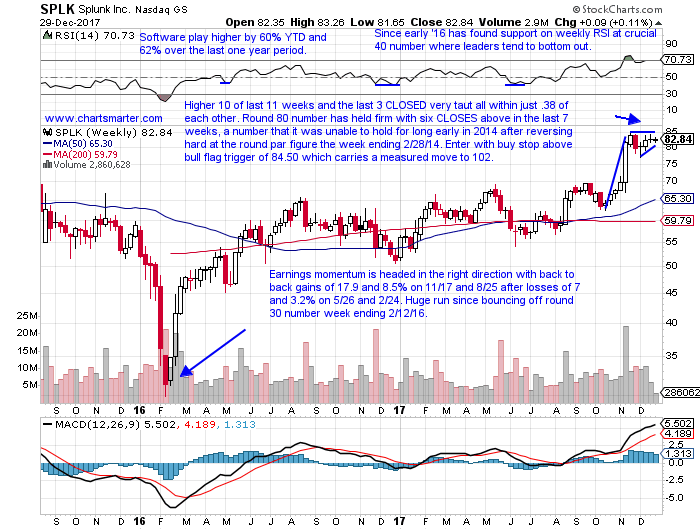
Stocks that can be bought as they take out bullish WEEKLY flag triggers are SPLK. SPLK is a software play higher by 60% YTD and 62% over the last one year period. Earnings momentum is headed in the right direction with back to back gains of 17.9 and 8.5% on 11/17 and 8/25 after losses of 7 and 3.2% on 5/26 and 2/24. The stock is higher 10 of the last 11 weeks and the last 3 CLOSED very taut all within just .38 of each other. The round 80 number has held firm with six CLOSES above in the last 7 weeks, a number that it was unable to hold for long early in 2014 after reversing hard at the round par figure the week ending 2/28/14. Enter SPLK with a buy stop above a bull flag trigger of 84.50 which carries a measured move to 102.
Trigger SPLK 84.50. Stop 81.
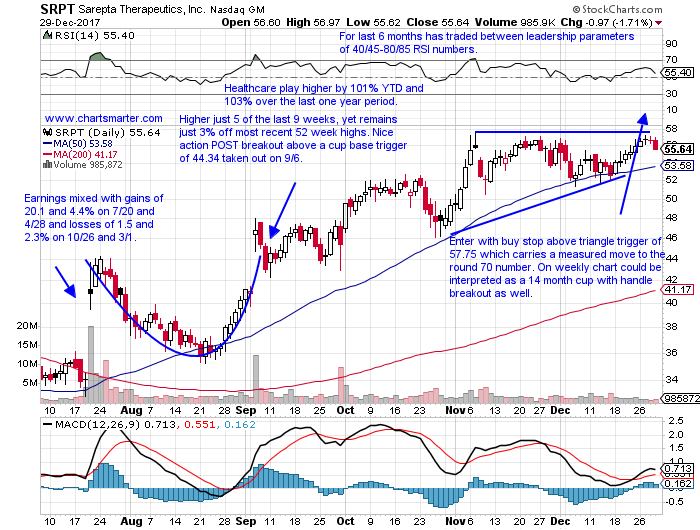
Stocks that can be bought as they take out bullish ascending triangles are SRPT. SRPT is a healthcare play higher by 101% YTD and 103% over the last one year period. Earnings have been mixed with gains of 20.1 and 4.4% on 7/20 and 4/28 and losses of 1.5 and 2.3% on 10/26 and 3/1. The stock is higher just 5 of the last 9 weeks, yet remains just 3% off most recent 52 week highs. A bullish ascending triangle began with a successful initial touch of its rising 50 day SMA after a breakout above a cup base trigger of 44.34 taken out on 9/6. Enter SRPT with a buy stop above a triangle trigger of 57.75 which carries a measured move to the round 70 number. On weekly chart could be interpreted as a 14 month cup with handle breakout as well.
Trigger SRPT 57.75. Stop 54.
Stocks that can be bought as they initially touch their rising 50 day SMA after recent breakouts are MRVL. MRVL is a semiconductor play higher by 55% YTD and 52% over the last one year period and sports a dividend yield of 1.1%. Earnings have been mostly higher with FOUR consecutive positive reactions higher by 7.5, 4.3, 1.5 and 10.8% on 8/25, 5/26, 3/3 and 11/18/16 before a recent loss of 4.6% on 11/29, which was just after the announcement of the CAVM acquisition. The stock is higher 10 of the last 14 weeks, including a 9 week winning streak ending between 9/29-11/24 which rose nearly 30%. Enter MRVL at 21 as it would be the first touch of its 50 day SMA after a bull flag breakout above a 21 trigger on 11/20.
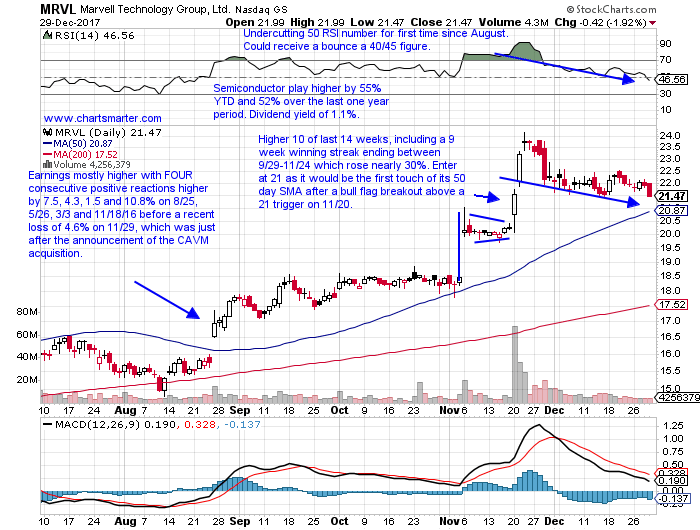
Trigger MRVL 21. Stop 19.75.
Stocks that can be bought as they retest prior bull flag breakouts are SFIX. SFIX is a recent retail IPO that is now lower by 14% off most recent highs. It recorded just one earnings reaction and it slumped 9.8% on 12/20, but it did bounce near the very round 20 number and CLOSED in the upper half of the daily range. It is higher 6 of the last 7 weeks and recorded a huge 50% combined gain the weeks ending 11/24-12/1. On 12/26 it screamed above a bull flag formation trigger of 25 (several sessions recently were above 25 but 12/20 was first finish above), could be viewed as an ascending triangle too, which carries a measured move to 35. Enter SFIX here as it has retested that bull flag breakout and held.
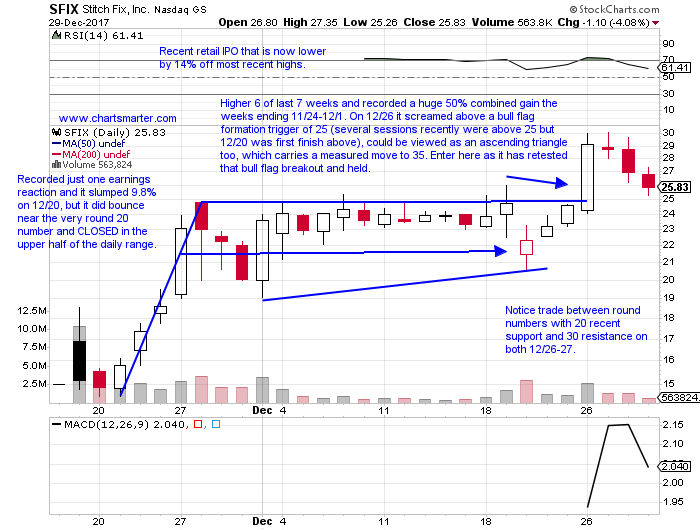
Trigger SFIX here. Stop 22.45.
Stocks to be considered shorting opportunities are RHT. RHT is an "old tech" play higher by 72% YTD and over the last one year period. Its most recent earnings reaction falling 5.3% on 12/20 perhaps can be forgiven as the prior THREE all rose by 4.1, 9.6 and 5.2% on 9/26, 6/21 and 3/28. The stock is lower 3 of the last 5 weeks and now 8% off most recent 52 week highs. It fell 2.3% this week showing relative weakness as the Nasdaq fell .8%, and showed bearish follow through after the prior week ending 12/22 slumped 4.5% recording a bearish engulfing candle. Enter RHT with a sell stop below a bear flag trigger of 119.50 that would carry a measured move to 109. There have been no CLOSES below 120 since climbing above on 10/12 even though several were below intraday.
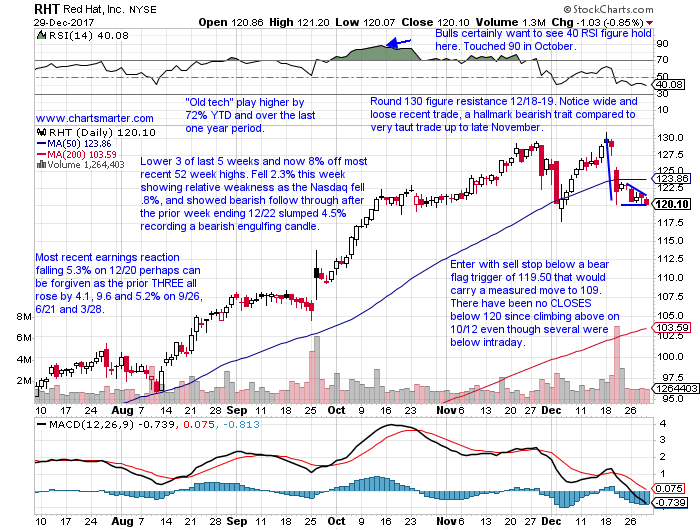
Trigger RHT 119.50. Buy stop 123.
Good luck.
The author is flat.
Trigger summaries:
Buy stop above bullish inverse head and shoulders OZRK 50.25. Stop 47.
Buy stop above WEEKLY flag trigger SPLK 84.50. Stop 81.
Buy stop above bullish ascending triangle SRPT 57.75. Stop 54.
Buy initial touch of rising 50 day SMA after recent breakout MRVL 21. Stop 19.75.
Buy pullback into bull flag breakout SFIX here. Stop 22.45.
Sell stop to short below bear flag RHT 119.50. Buy stop 123.
Markets recorded a late session reversal to end 2017 on Friday giving some of the major indexes sizable losses including the Nasdaq and Russell 2000 which fell by .7 and .9% respectively. For the week that late selloff Friday snapped 5 week winning streaks for the S&P 500 and Dow with each falling .4 and .1% respectively. The Nasdaq lost .8% for the week. The Dow and S&P 500 still both look productive as they sport bull flag formations, the Nasdaq could easily test its rising 50 day SMA 100 handles lower. The week showed little volatility until Friday as the Nasdaq for one has intraday ranges of 18, 26, 24 and 18 points Monday-Thursday. So much for intraday swings with market participants pretty much away and volume soft. For the year it was a jolly one with the Nasdaq up 29, Dow 25 and S&P 500 by 19%. Some things to look forward to starting 2018 is the softness in the greenback as it has broken below a bearish head and shoulders pattern. That has some bullish inverse reaction with commodities jumping as copper put in a 16 session winning streak and energy surged nearly 5% in December. Remember in 2018 and always to watch unbiased PRICE action. Everyone will have a prediction and I have heard bears saying that "Charles Schwab clients' cash levels reached their lowest level on record recently (the 'dumb money' is all-in the market, basically)", to the elevated AAII extreme bullish sentiment readings. If anything those kind of headlines can further fuel this rally. But remember too that we must always be privy to what we can lose and capital preservation is paramount. In summary, keep your losses small and let your winners run and block out all the noise.
Looking at individual groups on a weekly basis for the last week of '17 there were not any big movers or losers. Things of note were the XLK falling .9%, the weeks worst performing group, and losing ground back to back weeks for the first time since mid August to show you how resilient technology overall has been. The staples which seems to be a consensus avoider group every year CLOSED UNCH this week, but has finished the last 4 weeks very taut, and the last 3 very tight all within just TWO pennies of each other. That type of narrow trade can often lead to powerful advances, even within the defensive staples arena. It would be remiss if we did not examine sectors for the whole of 2017 and technology was the best actor with information technology advancing 36.9%, and four of the next groups all put in a good bid for second place. The materials rose 21.4, discretionary 21.2 and both healthcare and financials gained 20%. Each of the aforementioned groups beat the S&P 500's 19.4% gain in 2017. Lagging were the utilities which added 8.3%, and the only sectors to fall on a YTD basis were telecom and energy spaces off 6 and 3.8% respectively. On a monthly basis for December most groups were subdued with the exception of big bifurcation regarding the telecoms rising 5.8% and the utilities DROPPING 6.4% and the XLU recording a bearish monthly engulfing candle from all time highs.
In a year in which the vast majority of stocks rose handsomely, of course there were some that were not invited to the party. That is often a tell when a name gets left behind on a firm, overall tape. Below is the chart of WIX and how it appeared in our Tuesday 12/26 Game Plan and it now rests 33% off most recent 52 week highs. This was a good example of always being cautious as this stock was a strong leader during a run from 15 the week ending 2/12/16 to 86 the week ending 4/28. Since then however it has declined 18 of the last 34 weeks, and where one negative earnings reaction can be forgiven, back to back misses could spell trouble. In the very least the company now has the burden of proof to convince bulls it is on the straight and narrow. It looks like it could gravitate to the round 50 number early next year and if that does not hold look out below.
Stocks that can be bought as they tae out bullish inverse head and shoulders patterns are OZRK. OZRK is a financial play lower by 8% YTD and over the last one year period and sports a dividend yield of 1.5%. Earnings momentum is terrible with FIVE consecutive negative reactions losing 2.7, .7, .8, 2.5 and 3.5% on 10/11, 7/12, 4/11, 1/17 and 10/11/16 (it REPORTS 1/17 before open). The stock is higher 5 of the last 7 weeks and has traded between the round 40 and 50 numbers since the beginning of April '17. It found support at 40 week ending 9/8 and resistance at 50 roughly in June and December. Enter OZRK with a buy stop above a bullish inverse head and shoulders trigger of 50.25 which has a measured move to 60. One can add above cup base trigger of 56.86.
Trigger OZRK 50.25. Stop 47.
Stocks that can be bought as they take out bullish WEEKLY flag triggers are SPLK. SPLK is a software play higher by 60% YTD and 62% over the last one year period. Earnings momentum is headed in the right direction with back to back gains of 17.9 and 8.5% on 11/17 and 8/25 after losses of 7 and 3.2% on 5/26 and 2/24. The stock is higher 10 of the last 11 weeks and the last 3 CLOSED very taut all within just .38 of each other. The round 80 number has held firm with six CLOSES above in the last 7 weeks, a number that it was unable to hold for long early in 2014 after reversing hard at the round par figure the week ending 2/28/14. Enter SPLK with a buy stop above a bull flag trigger of 84.50 which carries a measured move to 102.
Trigger SPLK 84.50. Stop 81.
Stocks that can be bought as they take out bullish ascending triangles are SRPT. SRPT is a healthcare play higher by 101% YTD and 103% over the last one year period. Earnings have been mixed with gains of 20.1 and 4.4% on 7/20 and 4/28 and losses of 1.5 and 2.3% on 10/26 and 3/1. The stock is higher just 5 of the last 9 weeks, yet remains just 3% off most recent 52 week highs. A bullish ascending triangle began with a successful initial touch of its rising 50 day SMA after a breakout above a cup base trigger of 44.34 taken out on 9/6. Enter SRPT with a buy stop above a triangle trigger of 57.75 which carries a measured move to the round 70 number. On weekly chart could be interpreted as a 14 month cup with handle breakout as well.
Trigger SRPT 57.75. Stop 54.
Stocks that can be bought as they initially touch their rising 50 day SMA after recent breakouts are MRVL. MRVL is a semiconductor play higher by 55% YTD and 52% over the last one year period and sports a dividend yield of 1.1%. Earnings have been mostly higher with FOUR consecutive positive reactions higher by 7.5, 4.3, 1.5 and 10.8% on 8/25, 5/26, 3/3 and 11/18/16 before a recent loss of 4.6% on 11/29, which was just after the announcement of the CAVM acquisition. The stock is higher 10 of the last 14 weeks, including a 9 week winning streak ending between 9/29-11/24 which rose nearly 30%. Enter MRVL at 21 as it would be the first touch of its 50 day SMA after a bull flag breakout above a 21 trigger on 11/20.
Trigger MRVL 21. Stop 19.75.
Stocks that can be bought as they retest prior bull flag breakouts are SFIX. SFIX is a recent retail IPO that is now lower by 14% off most recent highs. It recorded just one earnings reaction and it slumped 9.8% on 12/20, but it did bounce near the very round 20 number and CLOSED in the upper half of the daily range. It is higher 6 of the last 7 weeks and recorded a huge 50% combined gain the weeks ending 11/24-12/1. On 12/26 it screamed above a bull flag formation trigger of 25 (several sessions recently were above 25 but 12/20 was first finish above), could be viewed as an ascending triangle too, which carries a measured move to 35. Enter SFIX here as it has retested that bull flag breakout and held.
Trigger SFIX here. Stop 22.45.
Stocks to be considered shorting opportunities are RHT. RHT is an "old tech" play higher by 72% YTD and over the last one year period. Its most recent earnings reaction falling 5.3% on 12/20 perhaps can be forgiven as the prior THREE all rose by 4.1, 9.6 and 5.2% on 9/26, 6/21 and 3/28. The stock is lower 3 of the last 5 weeks and now 8% off most recent 52 week highs. It fell 2.3% this week showing relative weakness as the Nasdaq fell .8%, and showed bearish follow through after the prior week ending 12/22 slumped 4.5% recording a bearish engulfing candle. Enter RHT with a sell stop below a bear flag trigger of 119.50 that would carry a measured move to 109. There have been no CLOSES below 120 since climbing above on 10/12 even though several were below intraday.
Trigger RHT 119.50. Buy stop 123.
Good luck.
The author is flat.
Trigger summaries:
Buy stop above bullish inverse head and shoulders OZRK 50.25. Stop 47.
Buy stop above WEEKLY flag trigger SPLK 84.50. Stop 81.
Buy stop above bullish ascending triangle SRPT 57.75. Stop 54.
Buy initial touch of rising 50 day SMA after recent breakout MRVL 21. Stop 19.75.
Buy pullback into bull flag breakout SFIX here. Stop 22.45.
Sell stop to short below bear flag RHT 119.50. Buy stop 123.