At ChartSmarter I like to utilize a few different strategies. Round number theory is one of my favorites and second best is most likely the gap fill. It depends on a lot of patience and plenty of time scouring charts, both of which I employ in my trading. Less is more and overtrading not only fattens the bottom line for your broker but can lead to poor returns. Below are several examples from the month of February, to give you a visual look at how it works, precisely how they were written in our daily reports. Often it will offer good risk/reward for investors who can identify the set up, which is basically self explanatory.
In our Thursday 2/1 Game Plan we looked at the turnaround play ANF. It is now up 26% YTD and still shows a good dividend yield of 3.6%, and the very round 20 number came into play too.
Stocks that can be bought as they fill in gaps are ANF. ANF is a retail play higher by 19% YTD and 78% over the last one year period and sports a nice dividend yield of 3.8%. Earnings momentum is about as impressive as it gets with FOUR consecutive strong reactions higher by 23.9, 17.1, 9 and 13.9% on 11/17, 8/24, 5/25 and 3/2. The stock is higher 18 of the last 23 weeks since the week ending 8/25/17 and volume trends have been very positive with zero weeks of distribution in that timeframe. It is lower by 6.8% this week headed into Thursday, and due for a pullback as it has had an incredible January run. Enter ANF on a gap fill at 20.15 from the 1/19 session which aligns with the very round 20 number and for more comfort the rising 50 day SMA is not far behind there.
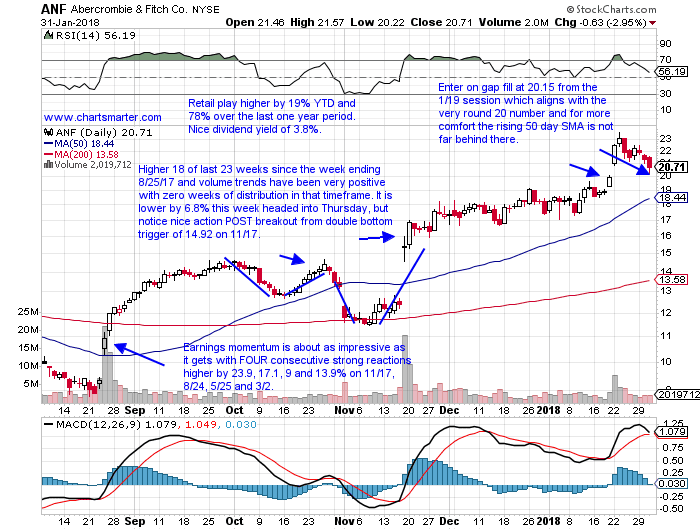
Trigger ANF 20.15. Stop 18.55.
In our Monday 2/5 Game Plan we looked at best in breed biopharma play ABBV. It has rebounded powerfully 18% off intraweek lows from the week ending 2/9, near the very round par figure. It is a good example of using CLOSING prices for your stops which we do.
ABBV is a healthcare play higher by 19% YTD and 89% over the last one year period and sports a dividend yield of 2.4%. Earnings have been mostly higher with gains of 13.8, 2.6 and 1.6% on 1/26, 10/27 and 4/27 and a loss of 1.8% on 7/28. The stock is higher 18 of the last 24 weeks after bouncing off round 70 number the week ending 8/25. It fell 6.5% this week but that could be forgiven after the previous week rose 17.7%. It trades very taut overall and has received smooth 50 day SMA support which is has found comforting for more than one year now. Look to enter ABBV on a gap fill from the 1/25 session near 111. Remember we know this is a few percent away but volatility is picking up and we stress the need to be patient and pick your spots.
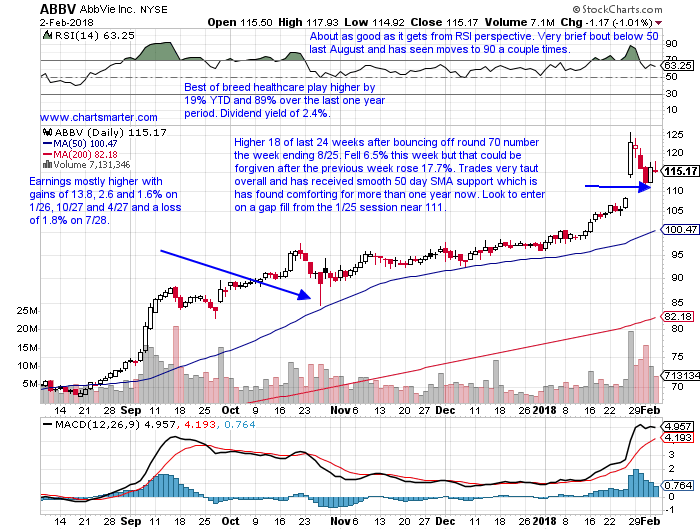
Trigger ABBV 111. Stop 105.30.
In our Tuesday 2/6 Game Plan we looked at both INFY and COST. INFY has a very visually appealing weekly chart as it is the the midst of a long cup with handle base, almost 3 years in duration. As it filled in the gap it also found support at an upward sloping 50 day SMA.
Stocks that can be bought as they fill in gaps are INFY COST. INFY is an Indian consulting play higher by 7% YTD and 25% over the last one year period and sports a dividend yield of 2.5%. Earnings have been mostly lower with losses of 2.7, 2.1 and 5.1% on 1/12, 10/24 and 4/15 and a gain of .7% on 7/14. The stock is impressively higher 12 of the last 15 weeks and is building the right side of a cup base that began with a rejection at the very round 20 number dating back to the week ending 4/15/16. Look to enter INFY with a gap fill at 17.10 from the session and add to above that long WEEKLY cup with handle trigger of 18.81.
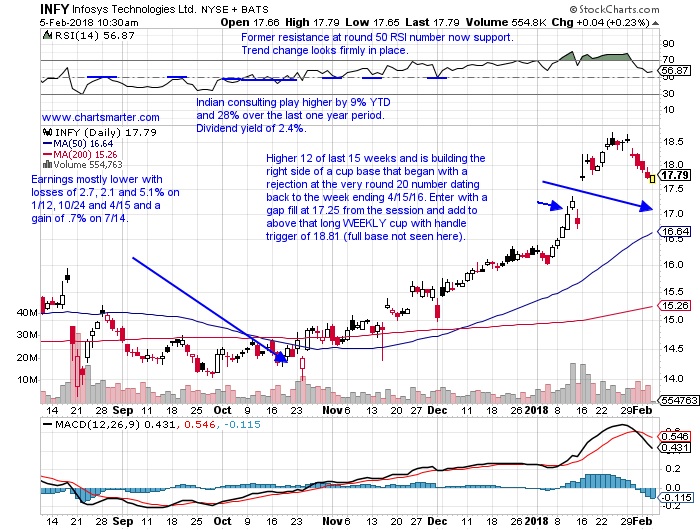
Trigger INFY 17.10. Stop 16.50.
COST another name trading between the round numbers, in fact its 52 week highs have traded precisely between the round 150-200 numbers. The stock filled in a gap from the 11/29 session 0n 2/6 and has since rallied more than 10 handles.
COST is a best in breed retail play lower by 2% YTD and 9% over the last one year period and sports a dividend yield of 1.1%. Earnings have been mixed with gains of 3.3 and 1.8% on 12/15 and 5/26 and losses of 6 and 4.3% on 10/6 and 3/3. The stock is higher 13 of the last 17 weeks, and the last 2 were stopped right at the round 200 number. It broke above a longer cup base trigger of 183.28 in a pattern that began the week ending 5/5/17 and was taken out week ending 12/1/17, but CLOSED just underneath it. More recently it broke above a double bottom trigger of 192.40 on 1/22, but that has now failed. Enter COST on a gap fill from the 11/29 session at 178. It is now on a 6 session losing streak.
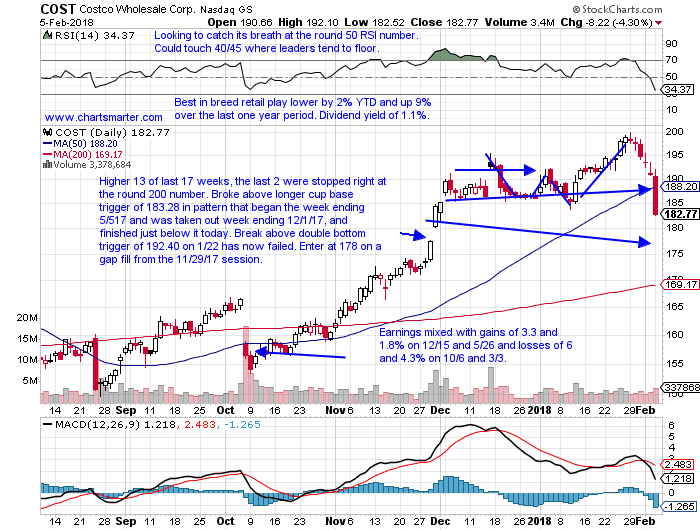
Trigger COST 178. Stop 171.
In our 2/9 Game Plan we looked at PII. A consumer play whose has some select names that have really benefitted from rotation into the sector. This name ROSE 1.5% the week ending 2/9 when the major indexes cratered, a very good sign. It also shows the gap fill approach can work even after sizable losses during a 7 session losing streak that fell 23% between 1/26-2/5.
Stocks that can be bought after recent gap fills are PII. PII is a consumer play lower by 11% YTD and higher by 28% over the last one year period and sports a dividend yield of 2.2%. Earnings have been mostly higher with three consecutive gains of 15.2, 4.3 and .5% on 10/24, 7/20 and 4/25 before a recent loss of 13.3% on 1/30. The stock is up .5% this week heading into Friday and has the look of a bullish hammer candle after last weeks plummet of 18.8%. Interestingly looking back at the prior 2 times that happened, a big weekly loss in huge volume, the weeks ending 1/29/16 and 9/16/16 which fell 9.9 and 12.8% respectively, the stock was up 6 of the next 7 weeks and 6 of the last 8 weeks. PII sits 20% off most recent 52 week highs and filled in a gap on 2/5 from the 10/23 session also finding support at its 200 day SMA. Enter at 108.
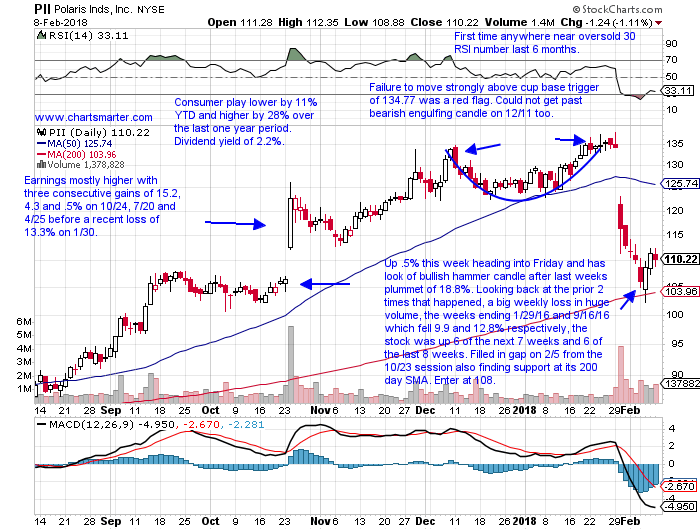
Trigger PII 108. Stop 104.
In our Thursday 2/15 Game Plan we looked at RMD. To be fair the trigger was not hit, but it still demonstrates the effectiveness of the gap fill approach. The last 3 weeks have not surprisingly traded within the 15.9% weekly gain ending 1/26.The healthcare play has gained 11% YTD and 30% over the last one year period and still sits 10% off most recent 52 week highs.
RMD is a best in breed healthcare name higher by 10% YTD and 31% over the last one year period and sports a dividend yield of 1.5%. Earnings momentum is solid with back to back gains of 14.7 and 7.4% on 1/23 and 10/27 after losses of 6.4 and 6.7% on 8/2 and 4/28. The stock dropped nearly 12% the last 2 weeks, but did trade the entire time within the weekly range ending 1/26 which jumped 15.9%. It recorded a bullish hammer candle on 2/9 which also CLOSED above its rising 50 day SMA and filled in a gap from the 1/22 session. Enter RMD on a pullback at 92.
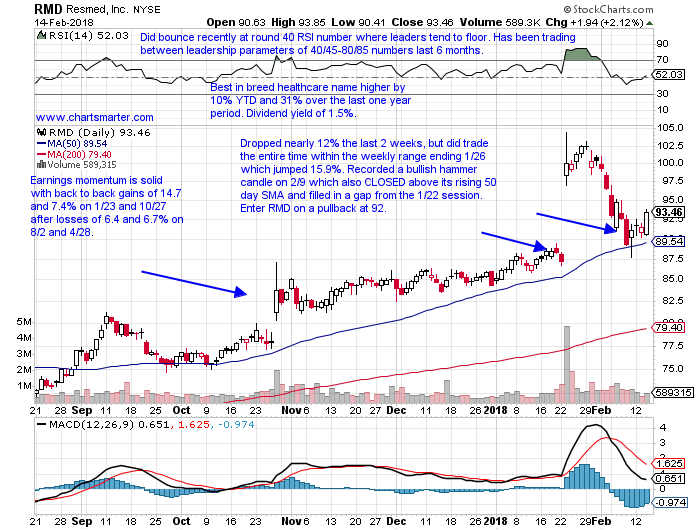
Trigger RMD 92. Stop 88.
If you liked what you read why not take a 2 week FREE trial at www.chartsmarter.com.
At ChartSmarter I like to utilize a few different strategies. Round number theory is one of my favorites and second best is most likely the gap fill. It depends on a lot of patience and plenty of time scouring charts, both of which I employ in my trading. Less is more and overtrading not only fattens the bottom line for your broker but can lead to poor returns. Below are several examples from the month of February, to give you a visual look at how it works, precisely how they were written in our daily reports. Often it will offer good risk/reward for investors who can identify the set up, which is basically self explanatory.
In our Thursday 2/1 Game Plan we looked at the turnaround play ANF. It is now up 26% YTD and still shows a good dividend yield of 3.6%, and the very round 20 number came into play too.
Stocks that can be bought as they fill in gaps are ANF. ANF is a retail play higher by 19% YTD and 78% over the last one year period and sports a nice dividend yield of 3.8%. Earnings momentum is about as impressive as it gets with FOUR consecutive strong reactions higher by 23.9, 17.1, 9 and 13.9% on 11/17, 8/24, 5/25 and 3/2. The stock is higher 18 of the last 23 weeks since the week ending 8/25/17 and volume trends have been very positive with zero weeks of distribution in that timeframe. It is lower by 6.8% this week headed into Thursday, and due for a pullback as it has had an incredible January run. Enter ANF on a gap fill at 20.15 from the 1/19 session which aligns with the very round 20 number and for more comfort the rising 50 day SMA is not far behind there.
Trigger ANF 20.15. Stop 18.55.
In our Monday 2/5 Game Plan we looked at best in breed biopharma play ABBV. It has rebounded powerfully 18% off intraweek lows from the week ending 2/9, near the very round par figure. It is a good example of using CLOSING prices for your stops which we do.
ABBV is a healthcare play higher by 19% YTD and 89% over the last one year period and sports a dividend yield of 2.4%. Earnings have been mostly higher with gains of 13.8, 2.6 and 1.6% on 1/26, 10/27 and 4/27 and a loss of 1.8% on 7/28. The stock is higher 18 of the last 24 weeks after bouncing off round 70 number the week ending 8/25. It fell 6.5% this week but that could be forgiven after the previous week rose 17.7%. It trades very taut overall and has received smooth 50 day SMA support which is has found comforting for more than one year now. Look to enter ABBV on a gap fill from the 1/25 session near 111. Remember we know this is a few percent away but volatility is picking up and we stress the need to be patient and pick your spots.
Trigger ABBV 111. Stop 105.30.
In our Tuesday 2/6 Game Plan we looked at both INFY and COST. INFY has a very visually appealing weekly chart as it is the the midst of a long cup with handle base, almost 3 years in duration. As it filled in the gap it also found support at an upward sloping 50 day SMA.
Stocks that can be bought as they fill in gaps are INFY COST. INFY is an Indian consulting play higher by 7% YTD and 25% over the last one year period and sports a dividend yield of 2.5%. Earnings have been mostly lower with losses of 2.7, 2.1 and 5.1% on 1/12, 10/24 and 4/15 and a gain of .7% on 7/14. The stock is impressively higher 12 of the last 15 weeks and is building the right side of a cup base that began with a rejection at the very round 20 number dating back to the week ending 4/15/16. Look to enter INFY with a gap fill at 17.10 from the session and add to above that long WEEKLY cup with handle trigger of 18.81.
Trigger INFY 17.10. Stop 16.50.
COST another name trading between the round numbers, in fact its 52 week highs have traded precisely between the round 150-200 numbers. The stock filled in a gap from the 11/29 session 0n 2/6 and has since rallied more than 10 handles.
COST is a best in breed retail play lower by 2% YTD and 9% over the last one year period and sports a dividend yield of 1.1%. Earnings have been mixed with gains of 3.3 and 1.8% on 12/15 and 5/26 and losses of 6 and 4.3% on 10/6 and 3/3. The stock is higher 13 of the last 17 weeks, and the last 2 were stopped right at the round 200 number. It broke above a longer cup base trigger of 183.28 in a pattern that began the week ending 5/5/17 and was taken out week ending 12/1/17, but CLOSED just underneath it. More recently it broke above a double bottom trigger of 192.40 on 1/22, but that has now failed. Enter COST on a gap fill from the 11/29 session at 178. It is now on a 6 session losing streak.
Trigger COST 178. Stop 171.
In our 2/9 Game Plan we looked at PII. A consumer play whose has some select names that have really benefitted from rotation into the sector. This name ROSE 1.5% the week ending 2/9 when the major indexes cratered, a very good sign. It also shows the gap fill approach can work even after sizable losses during a 7 session losing streak that fell 23% between 1/26-2/5.
Stocks that can be bought after recent gap fills are PII. PII is a consumer play lower by 11% YTD and higher by 28% over the last one year period and sports a dividend yield of 2.2%. Earnings have been mostly higher with three consecutive gains of 15.2, 4.3 and .5% on 10/24, 7/20 and 4/25 before a recent loss of 13.3% on 1/30. The stock is up .5% this week heading into Friday and has the look of a bullish hammer candle after last weeks plummet of 18.8%. Interestingly looking back at the prior 2 times that happened, a big weekly loss in huge volume, the weeks ending 1/29/16 and 9/16/16 which fell 9.9 and 12.8% respectively, the stock was up 6 of the next 7 weeks and 6 of the last 8 weeks. PII sits 20% off most recent 52 week highs and filled in a gap on 2/5 from the 10/23 session also finding support at its 200 day SMA. Enter at 108.
Trigger PII 108. Stop 104.
In our Thursday 2/15 Game Plan we looked at RMD. To be fair the trigger was not hit, but it still demonstrates the effectiveness of the gap fill approach. The last 3 weeks have not surprisingly traded within the 15.9% weekly gain ending 1/26.The healthcare play has gained 11% YTD and 30% over the last one year period and still sits 10% off most recent 52 week highs.
RMD is a best in breed healthcare name higher by 10% YTD and 31% over the last one year period and sports a dividend yield of 1.5%. Earnings momentum is solid with back to back gains of 14.7 and 7.4% on 1/23 and 10/27 after losses of 6.4 and 6.7% on 8/2 and 4/28. The stock dropped nearly 12% the last 2 weeks, but did trade the entire time within the weekly range ending 1/26 which jumped 15.9%. It recorded a bullish hammer candle on 2/9 which also CLOSED above its rising 50 day SMA and filled in a gap from the 1/22 session. Enter RMD on a pullback at 92.
Trigger RMD 92. Stop 88.
If you liked what you read why not take a 2 week FREE trial at www.chartsmarter.com.