The financials are a key sector and markets are somewhat dependent on the robust group to continue any ongoing rally. The have been subject to headlines as of late with interest rates as everyone seems to be keeping a keen eye on the 10 year as it has been hovering near the 3% level, although it has backed off last Thursday and Friday. Today we will take a look at a few different timeframes on SF, which has plenty of peers in the investment brokerage group holding their own including IBKR, PJC, RJF and MC. Directly below we see how I profiled the name in our Thursday 12/14 Game Plan and then further along in the post we take a present look on its daily and monthly charts.
Stocks that can be bought as they take out bull flag formations are SF. SF is a finnie play higher by 18% YTD and 16% over the last one year period and sports a small dividend yield of .7%. Earnings have been mostly higher with gains of 2.5, .4 and 3.5% on 10/31, 8/1 and 2/1 and a loss of 2.5% on 5/2. The stock is on a current 3 week winning streak up nearly 14% in elevated volume. It has acted well POST breakout from a 56.72 cup base trigger in a pattern 9 months long and on weekly chart one can see how the round 60 number was tough to break through as it was resistance dating back to weeks ending 6/12-26/15. Enter SF with buy stop above bull flag trigger of 60.50 which carries a measured move to round 70 number.

Trigger SF 60.50. Stop 58.25.
Looking at a present view on the daily chart notice how it has held the round 60 number well, which has been meaningful recently. It recorded just one CLOSE below on 2/8 and it is now higher by more than 5% the last 2 weeks, and still sits 8% off most recent all time highs offering an opportunity. Both its 50 and 200 day SMAs are sloping higher and Friday registered just its second CLOSE above the 50 day in the last 10 sessions. One can enter SF here and add to above a double bottom trigger of 68.86.

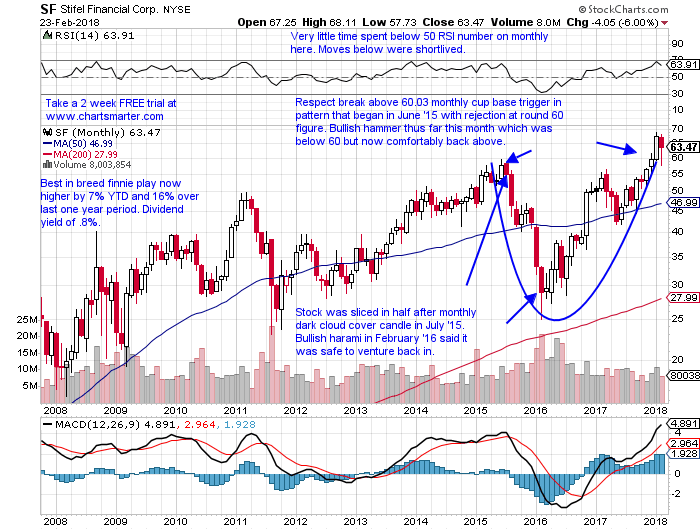
Taking a present view on the monthly chart shows just how important the round 60 number was. In June '15 it came within pennies of breaking through 60, but never did so on any timeframes. It subsequently fell by more than half, a bit deep for a base but its duration gave it a bullish slant. Below is the monthly chart and notice how the stock busted through 60 decisively in January and retested that move and has held firm, a very good sign.
If you liked what you read why not visit www.chartsmarter.com.
The financials are a key sector and markets are somewhat dependent on the robust group to continue any ongoing rally. The have been subject to headlines as of late with interest rates as everyone seems to be keeping a keen eye on the 10 year as it has been hovering near the 3% level, although it has backed off last Thursday and Friday. Today we will take a look at a few different timeframes on SF, which has plenty of peers in the investment brokerage group holding their own including IBKR, PJC, RJF and MC. Directly below we see how I profiled the name in our Thursday 12/14 Game Plan and then further along in the post we take a present look on its daily and monthly charts.
Stocks that can be bought as they take out bull flag formations are SF. SF is a finnie play higher by 18% YTD and 16% over the last one year period and sports a small dividend yield of .7%. Earnings have been mostly higher with gains of 2.5, .4 and 3.5% on 10/31, 8/1 and 2/1 and a loss of 2.5% on 5/2. The stock is on a current 3 week winning streak up nearly 14% in elevated volume. It has acted well POST breakout from a 56.72 cup base trigger in a pattern 9 months long and on weekly chart one can see how the round 60 number was tough to break through as it was resistance dating back to weeks ending 6/12-26/15. Enter SF with buy stop above bull flag trigger of 60.50 which carries a measured move to round 70 number.
Trigger SF 60.50. Stop 58.25.
Looking at a present view on the daily chart notice how it has held the round 60 number well, which has been meaningful recently. It recorded just one CLOSE below on 2/8 and it is now higher by more than 5% the last 2 weeks, and still sits 8% off most recent all time highs offering an opportunity. Both its 50 and 200 day SMAs are sloping higher and Friday registered just its second CLOSE above the 50 day in the last 10 sessions. One can enter SF here and add to above a double bottom trigger of 68.86.
Taking a present view on the monthly chart shows just how important the round 60 number was. In June '15 it came within pennies of breaking through 60, but never did so on any timeframes. It subsequently fell by more than half, a bit deep for a base but its duration gave it a bullish slant. Below is the monthly chart and notice how the stock busted through 60 decisively in January and retested that move and has held firm, a very good sign.
If you liked what you read why not visit www.chartsmarter.com.