Markets completed a tumultuous week Friday with some bright spots as the Russell 2000 which was the best performer Thursday did so again on Friday up a very strong 1.7%, bouncing off the round 1500 number for a second consecutive day, and recording a bullish engulfing candle. The Nasdaq rose 1.1% and CLOSING above its 50 day SMA after being 100 handles below the line in the early going. On the weekly basis the Nasdaq and Russell 2000 fell 1.1 and 1%, the S&P 500 by 2% and the Dow by 3%. The Nasdaq still comfortably maintains its YTD advantage higher by 5.1%, with the Dow, S&P 500 and Russell 2000 all hovering at the UNCH mark. All of these major indexes have work to do after the recent damage and time is a necessary ingredient, but there are a plethora of individual names that are weathering the storm well and should be applauded for it. I am keeping a closer eye on the VIX these days and the last 2 sessions finished 10% off intraday highs and Friday registered a bearish engulfing candle.
Looking at individual groups it was healthcare and technology that did the best higher with the XLV and XLK up in the 1% vicinity. The XLK recorded a bullish piercing line pattern off its rising 50 day SMA and the chart still looks somewhat dubious after the Tuesday-Thursday sessions produced a bearish three black crows formation with volume increasing with each successive day. It has the failure prone V shaped cup base and a double top in the 69s to deal with too. Lagging Friday were the utilities, materials and industrials with all three CLOSING in the red. The utilities are still dealing with the very round 50 number which coincided with a bear flag trigger that began last December. The XLU lost 2.8% on the week and CLOSED every day this week in the lower half of its daily range. On a weekly basis every major S&P sector lost ground with technology via the XLK acting the "best" lower by .9%. On the flip side the only other groups to fall harder than the utilities were the industrials and materials off by 3.2 and 3.8% respectively.
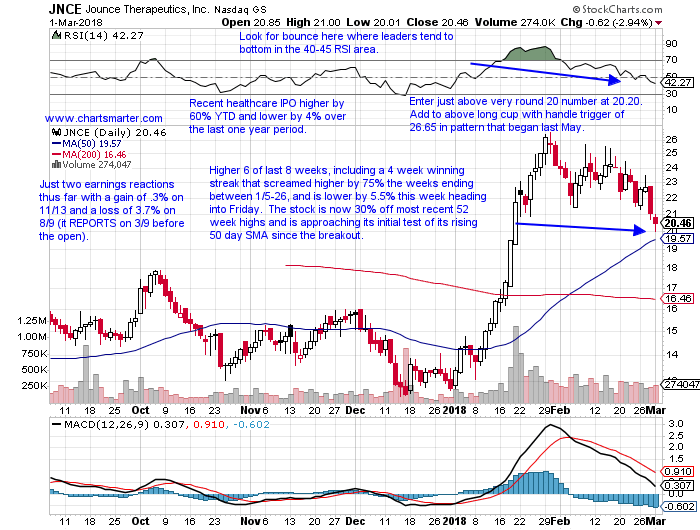
Healthcare names have been under some duress as of late with the XLV down 9% from its most recent 52 week highs. Of course there are many subsectors within including pharma, biotech, medical devices, etc. Below is the chart of JNCE and how it appeared in our Friday 3/2 Game Plan. This recent IPO just turned one year old last month and it has made a nice turnaround even being 26% off its most recent 52 week highs. The stock rose 6.3% on Friday touching the very round round 20 number for the second consecutive session recording a bullish engulfing candle right off its rising 50 day SMA. The stock REPORTS earnings next Friday and I believe CELG has interest in the name and the way it has been performing it could it on the stocks radar. One should never invest with the hope of an acquisition, but technically this chart looks sound with good risk reward here. On its weekly chart one can see the visually appealing cup with handle pattern that began the week 5/5/17 for longer term players like I am to add to one stake above a 26.65 trigger.
About as nice a recovery as you will ever see from an 11 week losing streak between weeks ending 2/17-4/28/17, with 10 of them CLOSING at or within the lower half of the weekly range. NTNX is a cloud play higher by 9% YTD and 24% over the last one year period. Earnings have been mostly higher with gains of 7.4, 9.9 and 11.5% on 3/2, 12/1 and 5/26 and an UNCH finish on 9/1. The stock is on a 4 week winning streak that has jumped 23%, and most impressive was the 1.1% weekly gain ending 2/9, that bounced off the round 30 number, with the Nasdaq being DOWN 5.1%. Also to be respected was the action as it screamed higher 25 of 37 weeks ending between 5/5/17-1/12/18 nearly tripling in the process. Enter NTNX with a buy stop above a cup base trigger of 38.90.
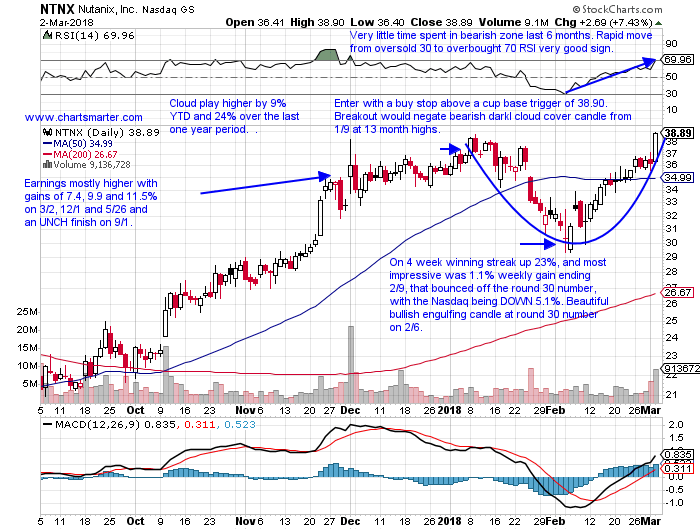
Trigger NTNX 38.90. Stop 36.35.
Healthcare name recorded 3 double digit weekly gains in the last 4 months. TDOC is a healthcare play higher by 21% YTD and 79% over the last one year period. Earnings have been mostly higher with gains of 7.5, 4.1, 25.2 and 4.9% on 2/28, 11/2, 5/9 and 3/2 and a loss of 1.6% on 8/3. The stock is on a 3 week winning streak and this week demonstrated excellent relative strength higher by 10.8%. It is now firmly back above a nearly 2 year long cup base trigger of 35.52 in a pattern that began the week ending 8/7/15 and taken out the week ending 6/23/17, which lasted only one week and it has since traded between roughly 30-38. TDOC broke above a bullish ascending triangle trigger of 38 which carries a measured move to 48 and enter on pullback into round 40 number at 41.
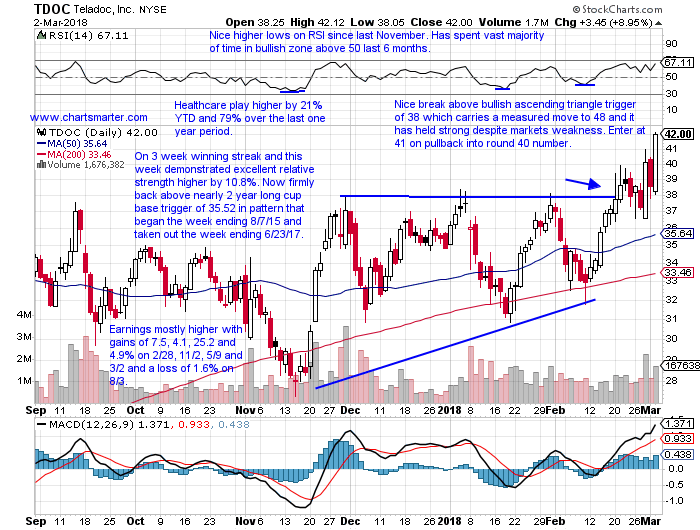
Trigger TDOC 41. Stop 37.25.
Acting much better than peer FCX which is 9% off most recent 52 week highs while SCCO is only 2% off its all time highs. SCCO is a best in breed materials play higher by 11% YTD and 43% over the last one year period and sports a dividend yield of 1.7%. Earnings have been mostly higher with gains of 2.5, 2.2 and 3.2% on 2/6, 10/24 and 7/25 and a loss of 2.6% on 5/4. The stock is higher 10 of the last 12 weeks and gained 1.5% this week and included an impressive 7 week winning streak between weeks ending 12/15-1/26 which rose by 19%. It is now nicely above a long WEEKLY cup base breakout trigger of 39.60 taken out the week ending 8/25/17. Enter SCCO on a pullback into a bull flag breakout trigger of 51.25 taken out on 2/23 at 52.30. Break carries a measured move to 57.25. Back to back bullish hammers on Thursday and Friday.
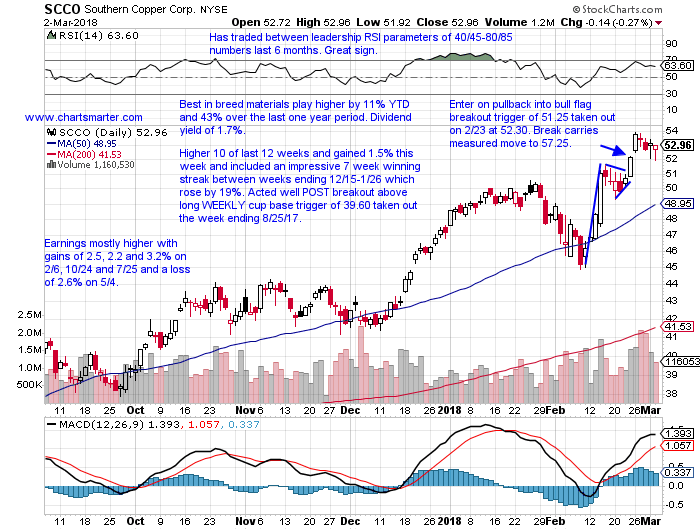
Trigger SCCO 52.30. Stop 50.60.
Always keep strong, recent IPO bases on your watch list as they are under followed and offer excellent price appreciation potential. MULE is a recent software IPO higher by 38% YTD and the 11 month name now at all time highs. Earnings are showing nice momentum with back to back gains of 17.9 and .4% on 2/16 and 10/27 after a loss of 14.8% on 7/28. We recently profiled this name in our Tuesday 2/20 Game Plan and the strongest names will always offer additional buy points. The stock is on a 3 week winning streak with a huge move the week ending 2/16 which jumped 29%, and the next week ROSE another .5% and this week was higher by 3.6%. It has acted well POST breakout from the 29.10 WEEKLY cup base breakout trigger in a base that began the week ending 5/26/17 and taken out the week ending 2/16. Enter MULE on a pullback into today breakout above a bull flag trigger at 31.50 and the break carries a measured move to 42. Stock has recorded 10 consecutive CLOSES above round 30 number.
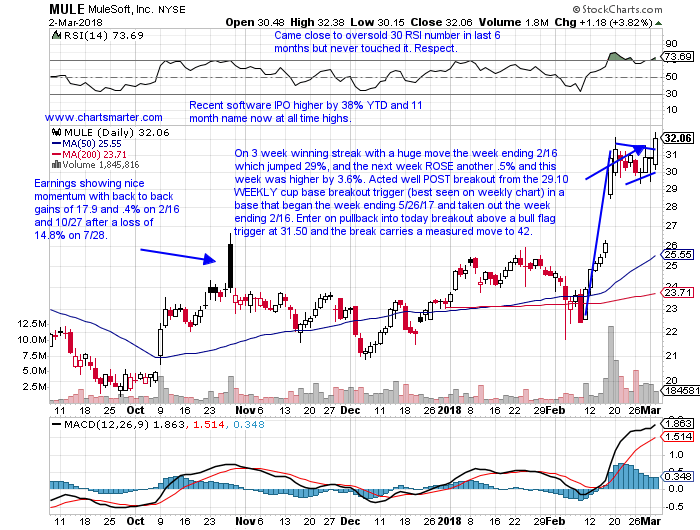
Trigger MULE 31.50. Stop 29.
Great example of why not to front run a trigger and always respect PRICE CONFIRMATION. PAG was a former best of breed auto play now lower by 6% YTD and 11% over the last one year period and sports a dividend yield of 3%. Earnings have been mostly lower with losses of 1.1, .5 and 2.3% on 2/8, 7/27 and 4/26 and a gain of 4.3% on 10/25. The stock is on a 5 week losing streak, its first in one year and now down 18% off most recent 52 week highs after falling 5.4% this week. It had a nice looking long cup base trigger of 56.15 in a pattern that began the week ending 12/9/16, but came close but never CLOSED above the week ending 2/2. PAG slipped below its 200 day SMA and a bearish head and shoulders trigger of 46 on 2/28. Enter on throwback at 45.75 and the break carries a measured move to 37. Bears can take solace with todays bullish counterattack candle, but the trend is still firmly lower.
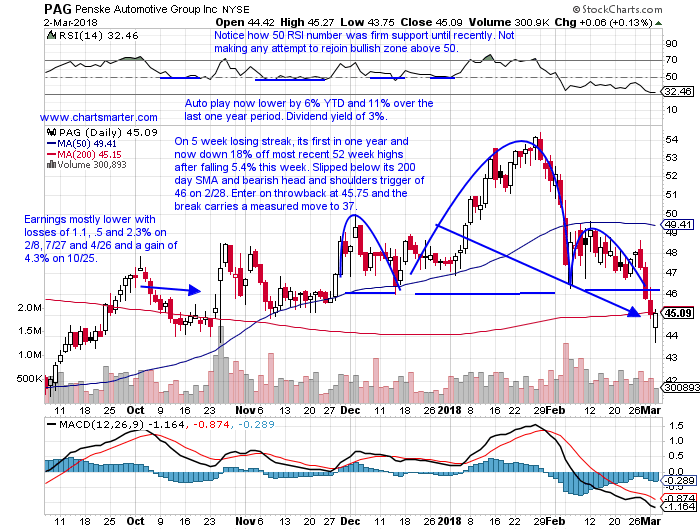
Trigger PAG 45.75. Buy stop 48.
Good luck.
Trigger summaries:
Buy stop above cup base trigger NTNX 38.90. Stop 36.35.
Buy pullback into round numbers TDOC 41. Stop 37.25.
Buy pullback into bull flag breakout SCCO 52.30. Stop 50.60.
Buy pullback into bull flag breakout MULE 31.50. Stop 29.
Short throwback into recent bearish head and shoulders breakdown PAG 45.75. Buy stop 48.
Markets completed a tumultuous week Friday with some bright spots as the Russell 2000 which was the best performer Thursday did so again on Friday up a very strong 1.7%, bouncing off the round 1500 number for a second consecutive day, and recording a bullish engulfing candle. The Nasdaq rose 1.1% and CLOSING above its 50 day SMA after being 100 handles below the line in the early going. On the weekly basis the Nasdaq and Russell 2000 fell 1.1 and 1%, the S&P 500 by 2% and the Dow by 3%. The Nasdaq still comfortably maintains its YTD advantage higher by 5.1%, with the Dow, S&P 500 and Russell 2000 all hovering at the UNCH mark. All of these major indexes have work to do after the recent damage and time is a necessary ingredient, but there are a plethora of individual names that are weathering the storm well and should be applauded for it. I am keeping a closer eye on the VIX these days and the last 2 sessions finished 10% off intraday highs and Friday registered a bearish engulfing candle.
Looking at individual groups it was healthcare and technology that did the best higher with the XLV and XLK up in the 1% vicinity. The XLK recorded a bullish piercing line pattern off its rising 50 day SMA and the chart still looks somewhat dubious after the Tuesday-Thursday sessions produced a bearish three black crows formation with volume increasing with each successive day. It has the failure prone V shaped cup base and a double top in the 69s to deal with too. Lagging Friday were the utilities, materials and industrials with all three CLOSING in the red. The utilities are still dealing with the very round 50 number which coincided with a bear flag trigger that began last December. The XLU lost 2.8% on the week and CLOSED every day this week in the lower half of its daily range. On a weekly basis every major S&P sector lost ground with technology via the XLK acting the "best" lower by .9%. On the flip side the only other groups to fall harder than the utilities were the industrials and materials off by 3.2 and 3.8% respectively.
Healthcare names have been under some duress as of late with the XLV down 9% from its most recent 52 week highs. Of course there are many subsectors within including pharma, biotech, medical devices, etc. Below is the chart of JNCE and how it appeared in our Friday 3/2 Game Plan. This recent IPO just turned one year old last month and it has made a nice turnaround even being 26% off its most recent 52 week highs. The stock rose 6.3% on Friday touching the very round round 20 number for the second consecutive session recording a bullish engulfing candle right off its rising 50 day SMA. The stock REPORTS earnings next Friday and I believe CELG has interest in the name and the way it has been performing it could it on the stocks radar. One should never invest with the hope of an acquisition, but technically this chart looks sound with good risk reward here. On its weekly chart one can see the visually appealing cup with handle pattern that began the week 5/5/17 for longer term players like I am to add to one stake above a 26.65 trigger.
About as nice a recovery as you will ever see from an 11 week losing streak between weeks ending 2/17-4/28/17, with 10 of them CLOSING at or within the lower half of the weekly range. NTNX is a cloud play higher by 9% YTD and 24% over the last one year period. Earnings have been mostly higher with gains of 7.4, 9.9 and 11.5% on 3/2, 12/1 and 5/26 and an UNCH finish on 9/1. The stock is on a 4 week winning streak that has jumped 23%, and most impressive was the 1.1% weekly gain ending 2/9, that bounced off the round 30 number, with the Nasdaq being DOWN 5.1%. Also to be respected was the action as it screamed higher 25 of 37 weeks ending between 5/5/17-1/12/18 nearly tripling in the process. Enter NTNX with a buy stop above a cup base trigger of 38.90.
Trigger NTNX 38.90. Stop 36.35.
Healthcare name recorded 3 double digit weekly gains in the last 4 months. TDOC is a healthcare play higher by 21% YTD and 79% over the last one year period. Earnings have been mostly higher with gains of 7.5, 4.1, 25.2 and 4.9% on 2/28, 11/2, 5/9 and 3/2 and a loss of 1.6% on 8/3. The stock is on a 3 week winning streak and this week demonstrated excellent relative strength higher by 10.8%. It is now firmly back above a nearly 2 year long cup base trigger of 35.52 in a pattern that began the week ending 8/7/15 and taken out the week ending 6/23/17, which lasted only one week and it has since traded between roughly 30-38. TDOC broke above a bullish ascending triangle trigger of 38 which carries a measured move to 48 and enter on pullback into round 40 number at 41.
Trigger TDOC 41. Stop 37.25.
Acting much better than peer FCX which is 9% off most recent 52 week highs while SCCO is only 2% off its all time highs. SCCO is a best in breed materials play higher by 11% YTD and 43% over the last one year period and sports a dividend yield of 1.7%. Earnings have been mostly higher with gains of 2.5, 2.2 and 3.2% on 2/6, 10/24 and 7/25 and a loss of 2.6% on 5/4. The stock is higher 10 of the last 12 weeks and gained 1.5% this week and included an impressive 7 week winning streak between weeks ending 12/15-1/26 which rose by 19%. It is now nicely above a long WEEKLY cup base breakout trigger of 39.60 taken out the week ending 8/25/17. Enter SCCO on a pullback into a bull flag breakout trigger of 51.25 taken out on 2/23 at 52.30. Break carries a measured move to 57.25. Back to back bullish hammers on Thursday and Friday.
Trigger SCCO 52.30. Stop 50.60.
Always keep strong, recent IPO bases on your watch list as they are under followed and offer excellent price appreciation potential. MULE is a recent software IPO higher by 38% YTD and the 11 month name now at all time highs. Earnings are showing nice momentum with back to back gains of 17.9 and .4% on 2/16 and 10/27 after a loss of 14.8% on 7/28. We recently profiled this name in our Tuesday 2/20 Game Plan and the strongest names will always offer additional buy points. The stock is on a 3 week winning streak with a huge move the week ending 2/16 which jumped 29%, and the next week ROSE another .5% and this week was higher by 3.6%. It has acted well POST breakout from the 29.10 WEEKLY cup base breakout trigger in a base that began the week ending 5/26/17 and taken out the week ending 2/16. Enter MULE on a pullback into today breakout above a bull flag trigger at 31.50 and the break carries a measured move to 42. Stock has recorded 10 consecutive CLOSES above round 30 number.
Trigger MULE 31.50. Stop 29.
Great example of why not to front run a trigger and always respect PRICE CONFIRMATION. PAG was a former best of breed auto play now lower by 6% YTD and 11% over the last one year period and sports a dividend yield of 3%. Earnings have been mostly lower with losses of 1.1, .5 and 2.3% on 2/8, 7/27 and 4/26 and a gain of 4.3% on 10/25. The stock is on a 5 week losing streak, its first in one year and now down 18% off most recent 52 week highs after falling 5.4% this week. It had a nice looking long cup base trigger of 56.15 in a pattern that began the week ending 12/9/16, but came close but never CLOSED above the week ending 2/2. PAG slipped below its 200 day SMA and a bearish head and shoulders trigger of 46 on 2/28. Enter on throwback at 45.75 and the break carries a measured move to 37. Bears can take solace with todays bullish counterattack candle, but the trend is still firmly lower.
Trigger PAG 45.75. Buy stop 48.
Good luck.
Trigger summaries:
Buy stop above cup base trigger NTNX 38.90. Stop 36.35.
Buy pullback into round numbers TDOC 41. Stop 37.25.
Buy pullback into bull flag breakout SCCO 52.30. Stop 50.60.
Buy pullback into bull flag breakout MULE 31.50. Stop 29.
Short throwback into recent bearish head and shoulders breakdown PAG 45.75. Buy stop 48.