When evaluating the genuine health of the overall market one wants to keep an eye on the number and quality of breakouts. Additionally one should look for leading stocks to be performing well. We all now, until recently, that the big tech names like AMZN, NFLX and GOOGL carried a lot of the weight, but today we look at a couple different names that as of late have crumbled. Just below we will take a peek at BA and ABBV, rulers in their respective fields.
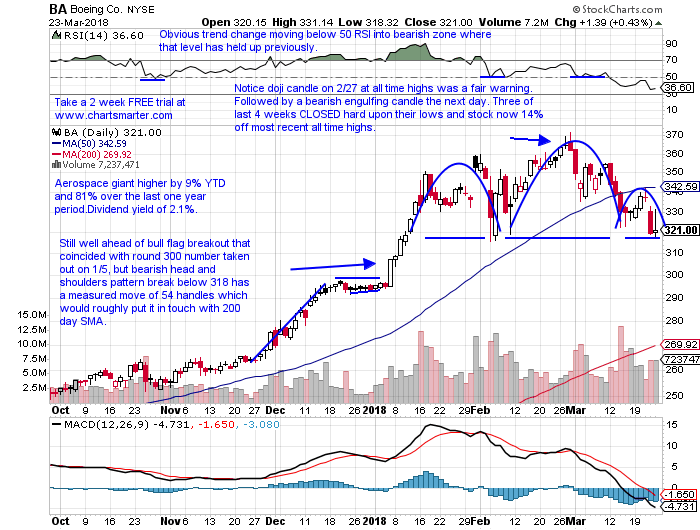
BA is an aerospace giant higher by 9% YTD and 81% over the last one year period and sports a dividend yield of 2.1%, yet is now a quick 14% off most recent all time highs. Earnings have been mixed, but the gains stronger as it rose 4.9 and 9.9% on 1/31 and 7/26 and losses of 2.8 and 1% on 10/25 and 4/26. To its credit it did CLOSE higher Friday, but it has now finished the last 8 sessions under its 50 day SMA since September '16. It is lower 3 of the last 4 weeks after the week ending 3/2 recorded a bearish engulfing candle at all time highs. It has advanced 16 of the last 18 months, but this month looks to be in all likelihood setting up to complete a bearish evening star candle, after a hanging man in February.
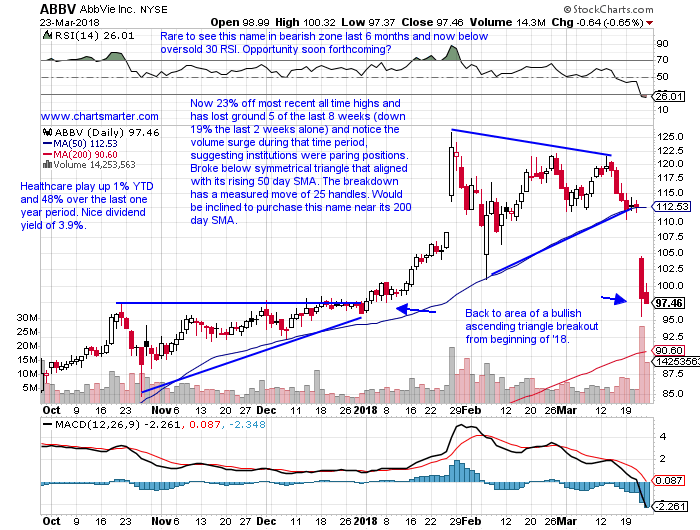
ABBV has been a steadfast leader in the healthcare space, now up just 1% YTD and 48% over the last one year period and sports a nice dividend yield of 3.9%. Earnings have been mostly higher with gains of 13.8, 2.6 and 1.6% on 1/26, 10/27 and 4/27 and a loss of 1.8% on 7/28. The stock is now 23% off most recent all time highs and has lost ground 5 of the last 8 weeks (down 19% the last 2 weeks alone) and notice the volume surge during that time period, suggesting institutions were paring positions. It did break below a symmetrical triangle that aligned with its rising 50 day SMA, this week after news on a lung cancer drug came out. The breakdown has a measured move of 25 handles. I would be inclined to purchase this name near its 200 day SMA.
If you liked what you read why not visit www.chartsmarter.com.
When evaluating the genuine health of the overall market one wants to keep an eye on the number and quality of breakouts. Additionally one should look for leading stocks to be performing well. We all now, until recently, that the big tech names like AMZN, NFLX and GOOGL carried a lot of the weight, but today we look at a couple different names that as of late have crumbled. Just below we will take a peek at BA and ABBV, rulers in their respective fields.
BA is an aerospace giant higher by 9% YTD and 81% over the last one year period and sports a dividend yield of 2.1%, yet is now a quick 14% off most recent all time highs. Earnings have been mixed, but the gains stronger as it rose 4.9 and 9.9% on 1/31 and 7/26 and losses of 2.8 and 1% on 10/25 and 4/26. To its credit it did CLOSE higher Friday, but it has now finished the last 8 sessions under its 50 day SMA since September '16. It is lower 3 of the last 4 weeks after the week ending 3/2 recorded a bearish engulfing candle at all time highs. It has advanced 16 of the last 18 months, but this month looks to be in all likelihood setting up to complete a bearish evening star candle, after a hanging man in February.
ABBV has been a steadfast leader in the healthcare space, now up just 1% YTD and 48% over the last one year period and sports a nice dividend yield of 3.9%. Earnings have been mostly higher with gains of 13.8, 2.6 and 1.6% on 1/26, 10/27 and 4/27 and a loss of 1.8% on 7/28. The stock is now 23% off most recent all time highs and has lost ground 5 of the last 8 weeks (down 19% the last 2 weeks alone) and notice the volume surge during that time period, suggesting institutions were paring positions. It did break below a symmetrical triangle that aligned with its rising 50 day SMA, this week after news on a lung cancer drug came out. The breakdown has a measured move of 25 handles. I would be inclined to purchase this name near its 200 day SMA.
If you liked what you read why not visit www.chartsmarter.com.