Markets ended Friday near the UNCH mark, but that obviously do not tell the story. The Nasdaq reversed lower at its 50 day SMA CLOSING the day 1% off intraday highs and ending near session lows. The Dow and S&P 500 recorded bullish hammers and each has finished the last 3 days of the week in the upper half of the weekly range. The Russell 2000 has come into contact with its rising 50 day SMA the lat 4 days and held each time. On a weekly basis it was the S&P 500 that outperformed as it was UNCH, the Nasdaq fell .4, the Russell 2000 .5 and the Dow .6%. No change on the YTD positions as the Nasdaq retains a clear lead up 3.1% in '18. The Russell 2000 is higher by 1,3% and the S&P 500 and Dow are lower by .1 and 1.6% respectively. Lets understand that all this volatile trade among the benchmarks is classic topping behavior, the opposite of the slow rounded, boring action seen at bottoms. One investor who must be feeling good about himself this weekend is Bill Ackman, as CMG soared nearly 29%, NKE rose more than 5% this week showing excellent relative strength and ADP broke above a bullish ascending triangle today. Contrarian indicator or is he getting his mojo back?
Looking at individual sectors Friday, the early obvious emphasis was on technology as a bevy of earnings came in after the close last night, and many impressed in the early going. INTC however CLOSED nearly 6% off intraday highs, AMZN finished 70 handles lower and was above a cup base trigger of 1617.64 but came nowhere near holding it and to boot it recorded a long, solid black candle. The last time that occurred was on 2/2 and led to a rapid 250 point loss, top to bottom over the next 6 days. The XLK lost .2% recording a bearish counterattack candle. Energy was the biggest laggard as the XLE fell 1.1% as XOM, its largest component at more than 22% of the ETF, dropped nearly 4% today after reporting earnings. Utilities were the best performer as the XLU added 1%, and the staples higher by .5%. Two of the most defensive groups demonstrated suspect leadership after such a nice start to the day from tech. On a weekly basis there was some clear bifurcation as the utilities led up 2.8% (the last 4 weeks have seen only the utilities and energy leading on a weekly basis twice each) and the industrials slumped as the XLI lost 3.2%. Interesting on the MONTHLY XLK chart the last2 recorded a doji candle and a bearish shooting star. Monday will complete April and with one day left it sports a spinning top, all three of those patterns are adept at calling for at least a pause, if not a change in the prevailing trend. Keep in mind just prior to that the XLK rose a stunning 17 of 19 months between July '16-January '18.
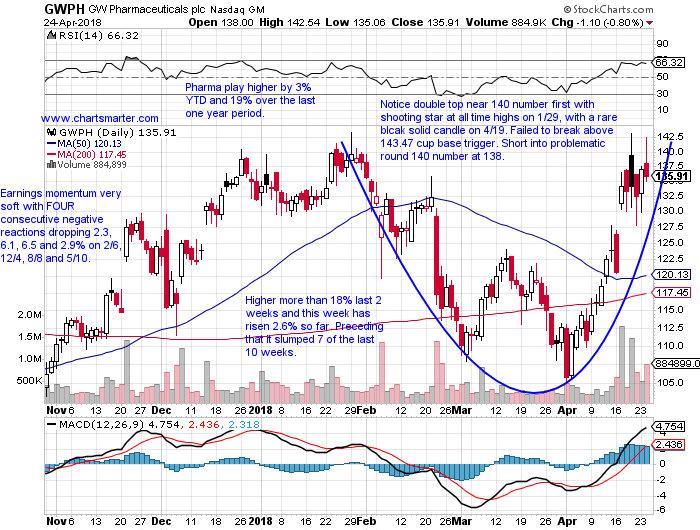
The cannabis sector has been garnering more and more attention with each month that passes by. I am not an expert on the group, but as far as I know the best and most liquid name in the space in GWPH. Below is the chart of the name and how is was presented in our Wednesday 4/25 Game Plan. It is becoming a habit for it to hit a roadblock at the round 140 figure, with 5 weeks trading above the number since the week ending 12/27/17 but zero CLOSES above it. In fact the last 2 were comfortably ahead of o 140 intraweek, but each ended up 11 and 7 points off highs, with this week resembling a bearish shooting star candle. One could call 140 on the weekly CLOSING basis the line in the sand, but technical analysis is not foolproof. On its weekly chart it has the look of a bearish head and shoulders pattern, although they work best primarily at bottoms. But if one is stopped out on the short side on can reverse and go long as one covers and the measured move would be a powerful 50 handles.
Respect that stock just 1% off all time highs as group has been soft overall. NEE is a best in breed utility play higher by 5% YTD and 23% over the last one year period and sports a dividend yield of 2.7%. Earnings have been mostly higher with advances of .6, 3 and 1.7% on 4/24, 1/26 and 7/26 and a loss of .3% on 10/26. The stock has found a floor at the round 160 number, with CLOSES above 6 of the last 7 weeks, after that figure was a roadblock with 7 weeks between 11/17/17-1/26 trading above 159 intraweek but was unable to penetrate 160 to the upside. Enter NEE with a buy stop above a bull flag trigger of 165 which carries a measured move to 186.
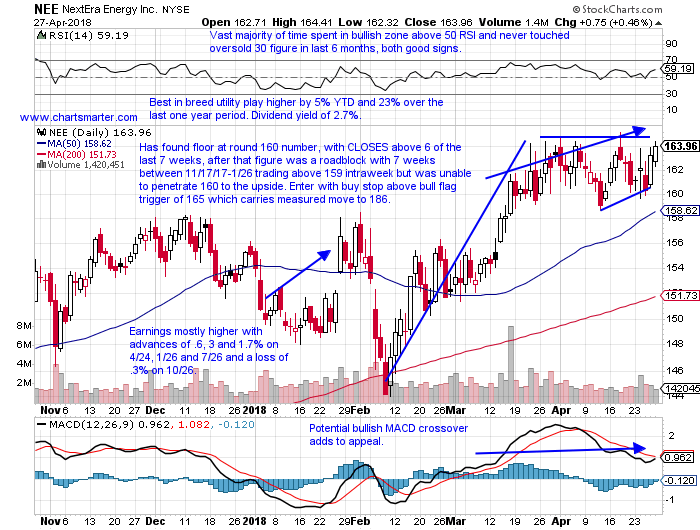
Trigger NEE 165. Stop 159.
Building the right side of a long cup base with a potential add on buy point above 30.99 trigger in pattern that began week ending 10/16/15. NVCR is a best in breed healthcare play higher by 33% YTD and 137% over the last one year period. Earnings have been mostly higher with advances of 9.7, 1.7, 6 and 3.6% on 4/26, 10/26, 7/27 and 4/27/17 and a loss of 4.4% on 2/22. The stock is on a current very strong 3 week winning streak higher by a combined 32%. Round number theory came into play with the 20 figure rock solid support since breaking above on 12/7, as only 4 sessions CLOSED below the number although 19 sessions did since then intraday. NVCR broke above a cup base trigger of 24.25 on 4/19 and enter on a pullback at 26.
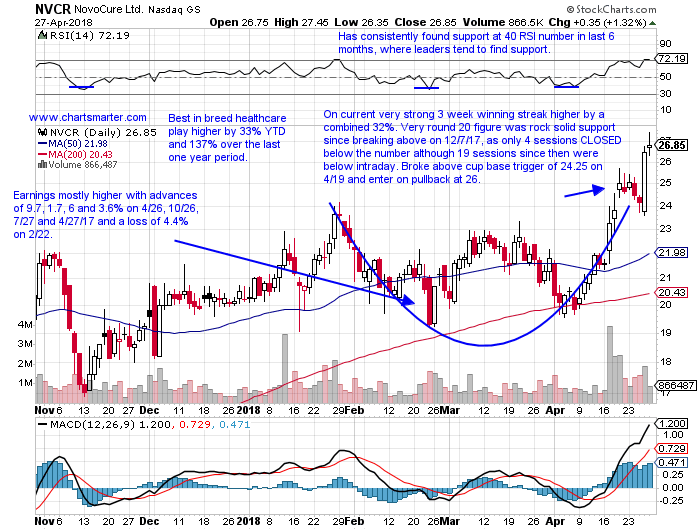
Trigger NVCR 26. Stop 24.
For those that think this name is extended keep in mind it is still lower by 21% from most recent 52 week highs. ULTA is a former best of breed retail play attempting to recapture its former glory higher by 11% YTD and lower by 12% over the last one year period. Earnings have been mixed with gains of 7.6 and 3.2% on 3/16 and 5/26 and losses of 4.1 and 9.1% on 12/1 and 8/25. The stock is on a 5 week winning streak up by a combined 21% and displayed great relative strength this week higher by 5.8%. It fell just 4 sessions in all of April so far and enter ULTA with a buy stop above a cup base trigger of 249.40 and add to above a potential cup base trigger of 314.96 in the future.
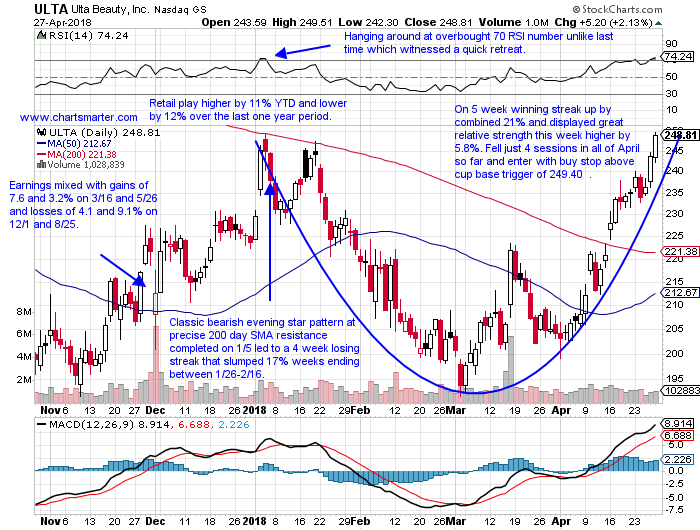
Trigger ULTA 249.40. Stop 242.
If software can get its act together, this one should fly out of the gate. FFIV is a software leader higher by 23% YTD and 27% over the last one year period. Earnings have been mostly lower with losses of 5.1, 7.2 and 7.5% on 1.25, 7/27 and 4/27/17 and gains of .9 and 4% on 4/26 and 10/26. The stock is on a current 3 week winning streak higher by 14%, and on the weekly chart one can see the fine action POST breakout from a 149.60 cup base trigger the week ending 4/13 (on CLOSING basis as always) in a pattern that began the week ending 3/14/17. More recently it has done well after a break above a 154.01 cup base trigger on 4/13. Enter FFIV here after a break above a bull flag trigger of 160 which carries a measured move to 180.
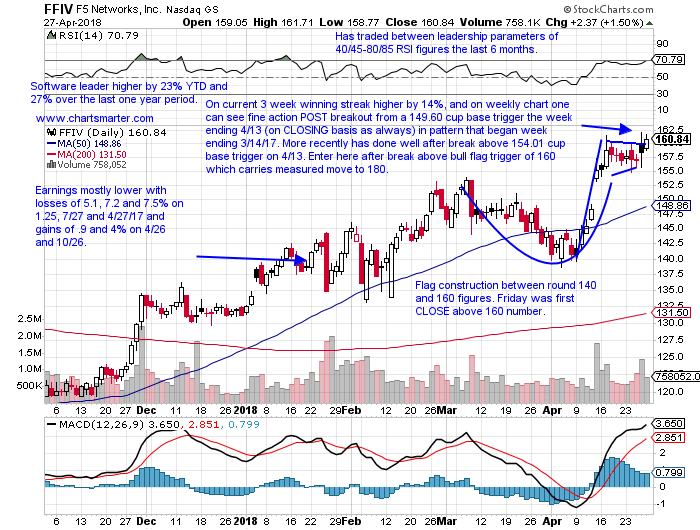
Trigger FFIV here. Stop 155.
Name is 20% off most recent 52 week highs, as the group has been red hot as of late, a poor sign. COG is an energy laggard lower by 17% YTD and 2% over the last one year period and sports a dividend yield of 1%. Earnings to its credit, has great momentum with FOUR consecutive positive reactions higher by .6, 2.4, 8.5 and 1.3% on 4/27, 2/23, 10/27 and 7/28. The stock is higher 7 of the last 13 weeks, but had recorded some heavy distribution weeks ending 2/9 and 3/23 which slumped 6.1 and 5.9%, both in the largest weekly volume since the week ending 3/31/17. COG reversed after breaking above a bearish descending triangle which I think is a bull trap. Let PRICE convince however and short with a sell stop below 22.85 which carries a measured move to 17.
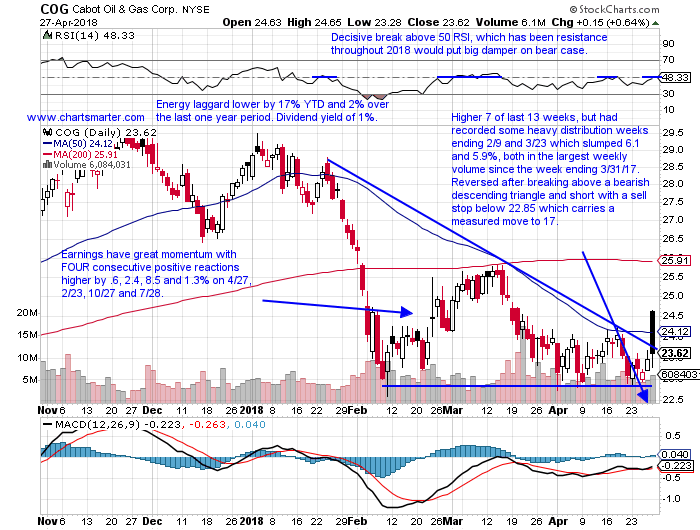
Trigger COG 22.85. Buy stop 24.55.
Good luck.
Trigger summaries:
Buy stop above bull flag trigger NEE 165. Stop 159.
Buy pullback into recent cup base breakout NVCR 26. Stop 24.
Buy stop above cup base trigger ULTA 249.40. Stop 242.
Buy after recent break above bull flag trigger FFIV here. Stop 155.
Sell stop to short below bearish descending triangle COG 22.85. Buy stop 24.55.
Markets ended Friday near the UNCH mark, but that obviously do not tell the story. The Nasdaq reversed lower at its 50 day SMA CLOSING the day 1% off intraday highs and ending near session lows. The Dow and S&P 500 recorded bullish hammers and each has finished the last 3 days of the week in the upper half of the weekly range. The Russell 2000 has come into contact with its rising 50 day SMA the lat 4 days and held each time. On a weekly basis it was the S&P 500 that outperformed as it was UNCH, the Nasdaq fell .4, the Russell 2000 .5 and the Dow .6%. No change on the YTD positions as the Nasdaq retains a clear lead up 3.1% in '18. The Russell 2000 is higher by 1,3% and the S&P 500 and Dow are lower by .1 and 1.6% respectively. Lets understand that all this volatile trade among the benchmarks is classic topping behavior, the opposite of the slow rounded, boring action seen at bottoms. One investor who must be feeling good about himself this weekend is Bill Ackman, as CMG soared nearly 29%, NKE rose more than 5% this week showing excellent relative strength and ADP broke above a bullish ascending triangle today. Contrarian indicator or is he getting his mojo back?
Looking at individual sectors Friday, the early obvious emphasis was on technology as a bevy of earnings came in after the close last night, and many impressed in the early going. INTC however CLOSED nearly 6% off intraday highs, AMZN finished 70 handles lower and was above a cup base trigger of 1617.64 but came nowhere near holding it and to boot it recorded a long, solid black candle. The last time that occurred was on 2/2 and led to a rapid 250 point loss, top to bottom over the next 6 days. The XLK lost .2% recording a bearish counterattack candle. Energy was the biggest laggard as the XLE fell 1.1% as XOM, its largest component at more than 22% of the ETF, dropped nearly 4% today after reporting earnings. Utilities were the best performer as the XLU added 1%, and the staples higher by .5%. Two of the most defensive groups demonstrated suspect leadership after such a nice start to the day from tech. On a weekly basis there was some clear bifurcation as the utilities led up 2.8% (the last 4 weeks have seen only the utilities and energy leading on a weekly basis twice each) and the industrials slumped as the XLI lost 3.2%. Interesting on the MONTHLY XLK chart the last2 recorded a doji candle and a bearish shooting star. Monday will complete April and with one day left it sports a spinning top, all three of those patterns are adept at calling for at least a pause, if not a change in the prevailing trend. Keep in mind just prior to that the XLK rose a stunning 17 of 19 months between July '16-January '18.
The cannabis sector has been garnering more and more attention with each month that passes by. I am not an expert on the group, but as far as I know the best and most liquid name in the space in GWPH. Below is the chart of the name and how is was presented in our Wednesday 4/25 Game Plan. It is becoming a habit for it to hit a roadblock at the round 140 figure, with 5 weeks trading above the number since the week ending 12/27/17 but zero CLOSES above it. In fact the last 2 were comfortably ahead of o 140 intraweek, but each ended up 11 and 7 points off highs, with this week resembling a bearish shooting star candle. One could call 140 on the weekly CLOSING basis the line in the sand, but technical analysis is not foolproof. On its weekly chart it has the look of a bearish head and shoulders pattern, although they work best primarily at bottoms. But if one is stopped out on the short side on can reverse and go long as one covers and the measured move would be a powerful 50 handles.
Respect that stock just 1% off all time highs as group has been soft overall. NEE is a best in breed utility play higher by 5% YTD and 23% over the last one year period and sports a dividend yield of 2.7%. Earnings have been mostly higher with advances of .6, 3 and 1.7% on 4/24, 1/26 and 7/26 and a loss of .3% on 10/26. The stock has found a floor at the round 160 number, with CLOSES above 6 of the last 7 weeks, after that figure was a roadblock with 7 weeks between 11/17/17-1/26 trading above 159 intraweek but was unable to penetrate 160 to the upside. Enter NEE with a buy stop above a bull flag trigger of 165 which carries a measured move to 186.
Trigger NEE 165. Stop 159.
Building the right side of a long cup base with a potential add on buy point above 30.99 trigger in pattern that began week ending 10/16/15. NVCR is a best in breed healthcare play higher by 33% YTD and 137% over the last one year period. Earnings have been mostly higher with advances of 9.7, 1.7, 6 and 3.6% on 4/26, 10/26, 7/27 and 4/27/17 and a loss of 4.4% on 2/22. The stock is on a current very strong 3 week winning streak higher by a combined 32%. Round number theory came into play with the 20 figure rock solid support since breaking above on 12/7, as only 4 sessions CLOSED below the number although 19 sessions did since then intraday. NVCR broke above a cup base trigger of 24.25 on 4/19 and enter on a pullback at 26.
Trigger NVCR 26. Stop 24.
For those that think this name is extended keep in mind it is still lower by 21% from most recent 52 week highs. ULTA is a former best of breed retail play attempting to recapture its former glory higher by 11% YTD and lower by 12% over the last one year period. Earnings have been mixed with gains of 7.6 and 3.2% on 3/16 and 5/26 and losses of 4.1 and 9.1% on 12/1 and 8/25. The stock is on a 5 week winning streak up by a combined 21% and displayed great relative strength this week higher by 5.8%. It fell just 4 sessions in all of April so far and enter ULTA with a buy stop above a cup base trigger of 249.40 and add to above a potential cup base trigger of 314.96 in the future.
Trigger ULTA 249.40. Stop 242.
If software can get its act together, this one should fly out of the gate. FFIV is a software leader higher by 23% YTD and 27% over the last one year period. Earnings have been mostly lower with losses of 5.1, 7.2 and 7.5% on 1.25, 7/27 and 4/27/17 and gains of .9 and 4% on 4/26 and 10/26. The stock is on a current 3 week winning streak higher by 14%, and on the weekly chart one can see the fine action POST breakout from a 149.60 cup base trigger the week ending 4/13 (on CLOSING basis as always) in a pattern that began the week ending 3/14/17. More recently it has done well after a break above a 154.01 cup base trigger on 4/13. Enter FFIV here after a break above a bull flag trigger of 160 which carries a measured move to 180.
Trigger FFIV here. Stop 155.
Name is 20% off most recent 52 week highs, as the group has been red hot as of late, a poor sign. COG is an energy laggard lower by 17% YTD and 2% over the last one year period and sports a dividend yield of 1%. Earnings to its credit, has great momentum with FOUR consecutive positive reactions higher by .6, 2.4, 8.5 and 1.3% on 4/27, 2/23, 10/27 and 7/28. The stock is higher 7 of the last 13 weeks, but had recorded some heavy distribution weeks ending 2/9 and 3/23 which slumped 6.1 and 5.9%, both in the largest weekly volume since the week ending 3/31/17. COG reversed after breaking above a bearish descending triangle which I think is a bull trap. Let PRICE convince however and short with a sell stop below 22.85 which carries a measured move to 17.
Trigger COG 22.85. Buy stop 24.55.
Good luck.
Trigger summaries:
Buy stop above bull flag trigger NEE 165. Stop 159.
Buy pullback into recent cup base breakout NVCR 26. Stop 24.
Buy stop above cup base trigger ULTA 249.40. Stop 242.
Buy after recent break above bull flag trigger FFIV here. Stop 155.
Sell stop to short below bearish descending triangle COG 22.85. Buy stop 24.55.