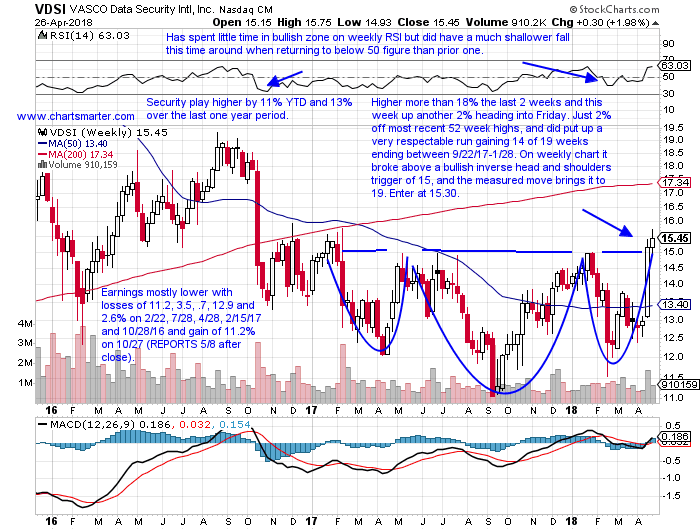
The cyber security space has been awash with winners recently. We have mentioned HACK many times recently and the ETF is higher by an impressive 19% YTD. CYBR and PANW charts, the third and fourth largest components in HACK, were highlighted in Game Plans this week which both have broken away from very long cup base patterns. Below is the chart of VDSI which again highlights how leaders will offer additional entry points on the way up. Here is the chart of how the name was presented in our Friday 4/27 Game Plan then the second chart will give a current view.
Bifurcated action among peers SYMC and CHKP which disappointed Wednesday. VDSI is a security play higher by 11% YTD and 13% over the last one year period. Earnings have been mostly lower with losses of 11.2, 3.5, .7, 12.9 and 2.6% on 2/22, 7/28, 4/28, 2/15/17 and 10/28/16 and a gain of 11.2% on 10/27 (it REPORTS 5/8 after the close). The stock is higher by more than 18% the last 2 weeks and this week has tacked on another 2% heading into Friday. This name is just 2% off most recent 52 week highs, solid for a software stock these days, and did put up a very respectable run gaining 14 of 19 weeks ending between 9/22/17-1/28. On its weekly chart it broke above a bullish inverse head and shoulders trigger of 15, and the measured move brings it to 19. Enter VDSI at 15.30.

Trigger VDSI 15.30. Stop 14.25.
Taking a present take on the name it is now higher by a robust 57% YTD. It has scored gains 6 of the last 7 weeks, including huge moves of 17 and 27.5% the weeks ending 4/20 and 5/11, and this week has thrust upward by nearly 6% heading into Thursday. Respect the very taut overall trade, hallmark bullish characteristics. It also has not shied away from trading ABOVE the overbought 70 RSI number for the last 6 weeks.

The cyber security space has been awash with winners recently. We have mentioned HACK many times recently and the ETF is higher by an impressive 19% YTD. CYBR and PANW charts, the third and fourth largest components in HACK, were highlighted in Game Plans this week which both have broken away from very long cup base patterns. Below is the chart of VDSI which again highlights how leaders will offer additional entry points on the way up. Here is the chart of how the name was presented in our Friday 4/27 Game Plan then the second chart will give a current view.
Bifurcated action among peers SYMC and CHKP which disappointed Wednesday. VDSI is a security play higher by 11% YTD and 13% over the last one year period. Earnings have been mostly lower with losses of 11.2, 3.5, .7, 12.9 and 2.6% on 2/22, 7/28, 4/28, 2/15/17 and 10/28/16 and a gain of 11.2% on 10/27 (it REPORTS 5/8 after the close). The stock is higher by more than 18% the last 2 weeks and this week has tacked on another 2% heading into Friday. This name is just 2% off most recent 52 week highs, solid for a software stock these days, and did put up a very respectable run gaining 14 of 19 weeks ending between 9/22/17-1/28. On its weekly chart it broke above a bullish inverse head and shoulders trigger of 15, and the measured move brings it to 19. Enter VDSI at 15.30.

Trigger VDSI 15.30. Stop 14.25.
Taking a present take on the name it is now higher by a robust 57% YTD. It has scored gains 6 of the last 7 weeks, including huge moves of 17 and 27.5% the weeks ending 4/20 and 5/11, and this week has thrust upward by nearly 6% heading into Thursday. Respect the very taut overall trade, hallmark bullish characteristics. It also has not shied away from trading ABOVE the overbought 70 RSI number for the last 6 weeks.
