Gap fills are a widely known strategy in the market that can be applied on both the upside and downside. The strategy is basically self explanatory, and gaps that fill to the downside after a very strong move give investors good risk/reward to open a position. A gap is simply a pocket of air, in between two different time periods on a stock chart. It is very likely to be following an earnings release, potential takeover news, etc. Often when a gap fill occurs, one will see a powerful intraday reversal, so one should be ready to pounce with a limit order to take advantage of the situation. To get a visual feel lets look at a couple examples.
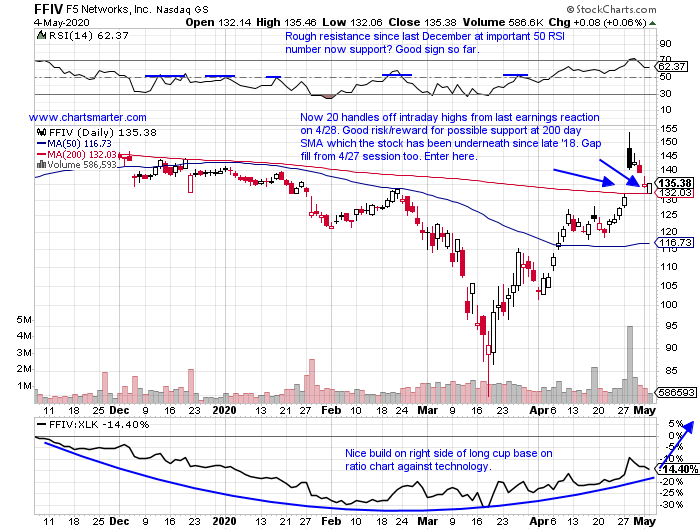
In our 5/5 Technology Note we looked at FFIV.
- Telecommunications equipment play higher by 2% YTD and 4% 0ver last one year period.
- Looking for its fifth weekly CLOSE above the 200 day SMA, building good momentum as it had not been above that line prior since 2018.
- Earnings mixed with stronger gains up 7.6 and 5.5% on 4/28 and 10/24/19 (fell 5 and .7% on 1/28 and 7/25/19).
- Enter after gap fill/potential 200 day SMA support.
- Entry FFIV here. Stop 127.50. Stock now trading near 142.
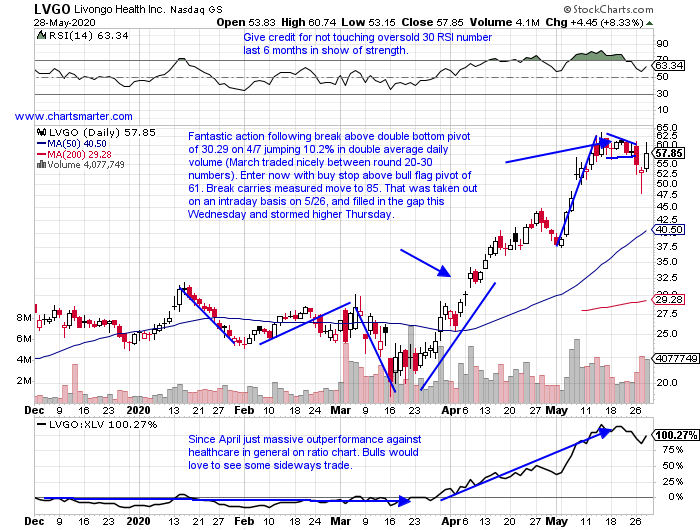
In our 5/26 Healthcare Note we looked at LVGO.
- Recent healthcare services IPO higher by 131% YTD, and now 9% off most recent 52 week highs.
- Now higher 8 of the last 10 weeks, and has risen 238.7% from March lows through May highs. This week lower by 1%, after prior 2 weeks rose by combined 52%.
- Earnings reactions lively with gains of 11.6 and 15.2% on 5/7 and 11/7/19, and losses of 9 and 17.3% on 3/3 and 9/5/19.
- Enter with buy stop above bull flag formation, quickly turned into a gap fill situation.
- Entry LVGO 61. Stop 55 (shows importance of CLOSING prices). Gap fill at 48.60 from 5/6 session traded to 48.14 on Wednesday. Stock rose more than 8% Thursday.
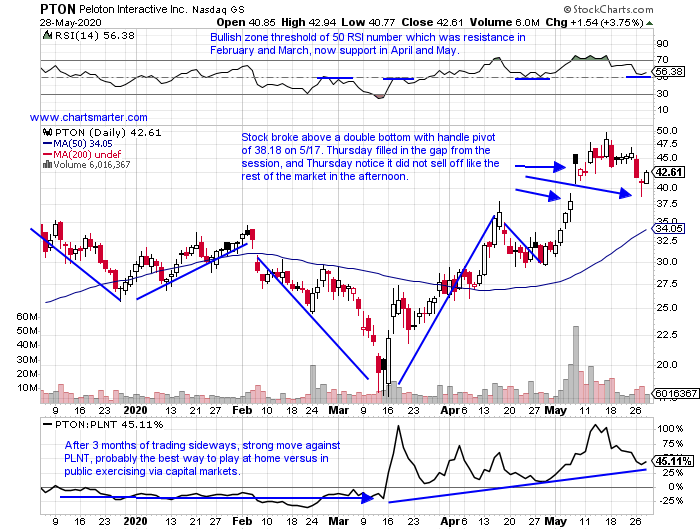
- Let us take a look at the current situation in PTON. This is another "at home" play, that has done exceptionally well up 50% YTD, but is looking at a 2 week losing streak falling 5.4% last week, and another 7% this week heading into Friday. This is acceptable as the prior 3 weeks all rose by a combined 48%. Round number theory comes into play here trading between the 40 and 50 figures. Notice on the chart below that the low on Wednesday also retested that double bottom breakout pivot and held firm. That is often the case as many breakouts are retested to determine if the move is real, and it is a good sign that the test was successful. Bullish hammer Wednesday and engulfing candle Thursday have lots to like.
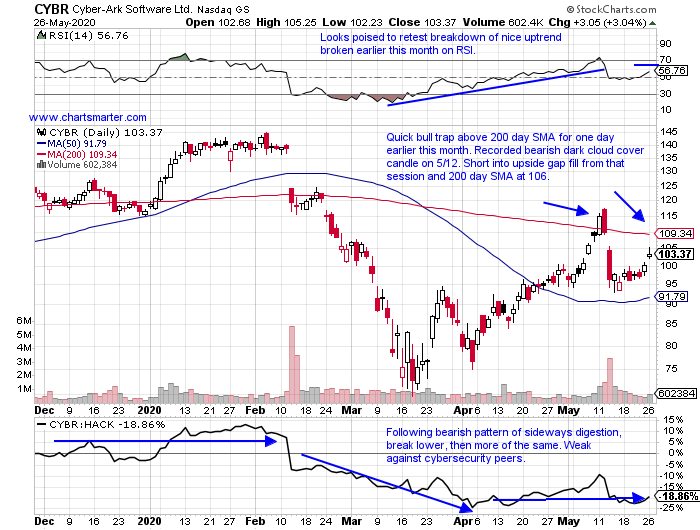
In our 5/27 Technology Note we looked at CYBR, and this is an example of filling in the gap to the upside for a shorting play.
- Cybersecurity laggard down 12% YTD and 25% over last one year period.
- Down 31% from most recent 52 week highs, unacceptable in strong software space. Now has made 3 lower highs on WEEKLY chart dating back to last August. ZERO accumulation weeks since week ending 1/10/20.
- Back to back double digit earning declines of 12.2 and 13.9% on 5/13 and 2/12 (also fell 8.7% on 8/7/19).
- Short into upside gap fill/200 day SMA.
- Entry CYBR 106. Buy stop 111.50. This has NOT hit the 106 suggested pivot yet, but monitor it going forward.
Gap fills are a widely known strategy in the market that can be applied on both the upside and downside. The strategy is basically self explanatory, and gaps that fill to the downside after a very strong move give investors good risk/reward to open a position. A gap is simply a pocket of air, in between two different time periods on a stock chart. It is very likely to be following an earnings release, potential takeover news, etc. Often when a gap fill occurs, one will see a powerful intraday reversal, so one should be ready to pounce with a limit order to take advantage of the situation. To get a visual feel lets look at a couple examples.
In our 5/5 Technology Note we looked at FFIV.
- Telecommunications equipment play higher by 2% YTD and 4% 0ver last one year period.
- Looking for its fifth weekly CLOSE above the 200 day SMA, building good momentum as it had not been above that line prior since 2018.
- Earnings mixed with stronger gains up 7.6 and 5.5% on 4/28 and 10/24/19 (fell 5 and .7% on 1/28 and 7/25/19).
- Enter after gap fill/potential 200 day SMA support.
- Entry FFIV here. Stop 127.50. Stock now trading near 142.
In our 5/26 Healthcare Note we looked at LVGO.
- Recent healthcare services IPO higher by 131% YTD, and now 9% off most recent 52 week highs.
- Now higher 8 of the last 10 weeks, and has risen 238.7% from March lows through May highs. This week lower by 1%, after prior 2 weeks rose by combined 52%.
- Earnings reactions lively with gains of 11.6 and 15.2% on 5/7 and 11/7/19, and losses of 9 and 17.3% on 3/3 and 9/5/19.
- Enter with buy stop above bull flag formation, quickly turned into a gap fill situation.
- Entry LVGO 61. Stop 55 (shows importance of CLOSING prices). Gap fill at 48.60 from 5/6 session traded to 48.14 on Wednesday. Stock rose more than 8% Thursday.
- Let us take a look at the current situation in PTON. This is another "at home" play, that has done exceptionally well up 50% YTD, but is looking at a 2 week losing streak falling 5.4% last week, and another 7% this week heading into Friday. This is acceptable as the prior 3 weeks all rose by a combined 48%. Round number theory comes into play here trading between the 40 and 50 figures. Notice on the chart below that the low on Wednesday also retested that double bottom breakout pivot and held firm. That is often the case as many breakouts are retested to determine if the move is real, and it is a good sign that the test was successful. Bullish hammer Wednesday and engulfing candle Thursday have lots to like.
In our 5/27 Technology Note we looked at CYBR, and this is an example of filling in the gap to the upside for a shorting play.
- Cybersecurity laggard down 12% YTD and 25% over last one year period.
- Down 31% from most recent 52 week highs, unacceptable in strong software space. Now has made 3 lower highs on WEEKLY chart dating back to last August. ZERO accumulation weeks since week ending 1/10/20.
- Back to back double digit earning declines of 12.2 and 13.9% on 5/13 and 2/12 (also fell 8.7% on 8/7/19).
- Short into upside gap fill/200 day SMA.
- Entry CYBR 106. Buy stop 111.50. This has NOT hit the 106 suggested pivot yet, but monitor it going forward.