Technical Irrelevance:
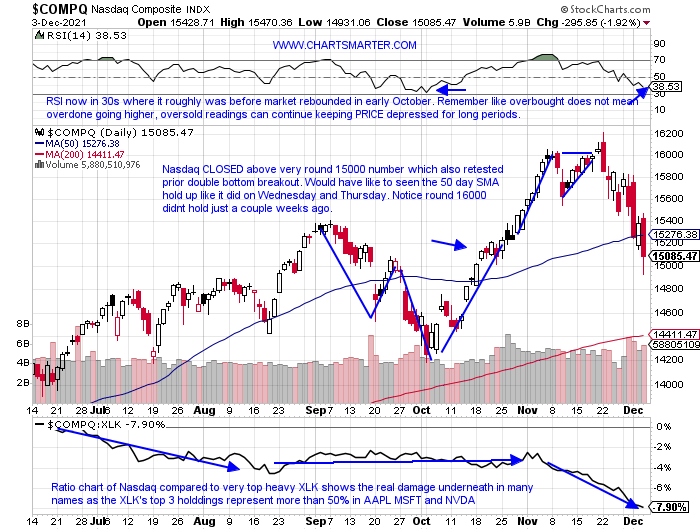
- Sometimes technical analysis does not matter (Petr Pinkhasov quote this week), and I am a die-hard technician. That goes for fundamental work too in the current market environment where margin clerks could be very busy in a December month that they may not be accustomed to. With many caught mentally "offside" looking for a year-end rally institutions could be scrambling to unwind their previous stance, and that could further "unnerve" benchmarks. Of course, this applies to individual names more so as they can crater 30-50% where the indexes will lose 3-5%. Sure I am throwing numbers out there, but technical damage has been severe recently. Below is the chart of the Nasdaq as warning signs should have been put up with the big reversal on 11/22 with a bearish engulfing candle at all-time highs and quickly negating a bull flag breakout at the very round 16000 figure (our previous target originally in our 6/25 Technology Note). It held the 15000 number Friday, but the action has been wide and loose, hallmark bearish traits. I would have preferred tauter and less velocity in the move toward 15000.
VIX Speaking:
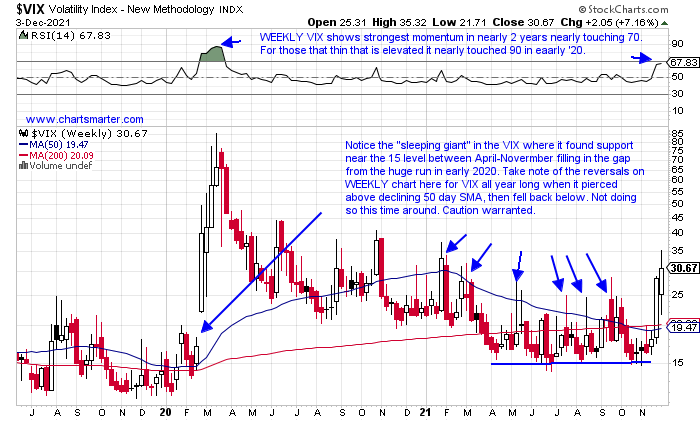
- When it comes to evaluating "risk" investors tend to look at many different factors. Put/call ratios, looking for relationships between staples and discretionary in the consumer space, or even just simple value versus growth. Below is another way to interpret it with the WEEKLY chart of the VIX. The instrument is on its first 3 week winning streak in 13 months and is demonstrating how markets like to confound the most. Last week rose more than 7% after the prior week gained nearly 60%, not a typo, although it did CLOSE off highs for the WEEKLY range. Market participants perhaps became complacent with PRICE pushing the VIX back after short-lived forays above its 50 day SMA throughout 2021. Could next week continue to feel the pain? Absolutely as markets can crater, and they will show signs before a huge move lower, as they have recently with weak breadth. I am keeping positions small in leaders in strong groups like DVN MRVL TTD and DHI. We can see violent moves to the upside in bearish market environments, but they will be on a tight leash as even generals will be shot if they overstay the welcome at the party.
Recent Examples:
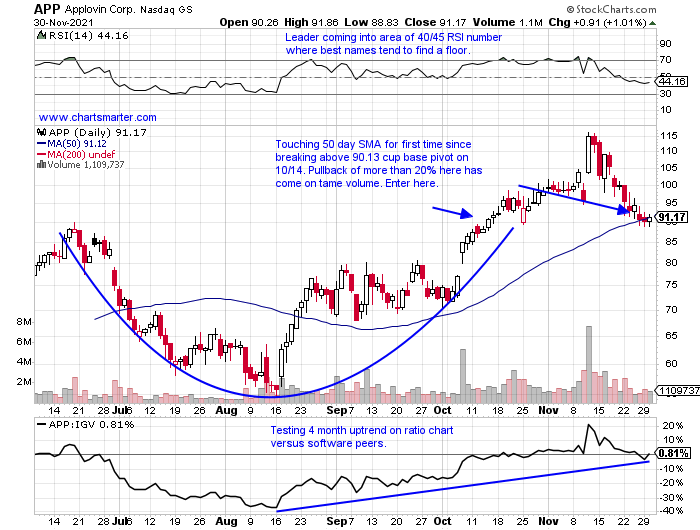
- Investors should always keep an eye out for relative strength, especially on weak tapes. They are often a good tell going forward that they will be the first ones to potentially charge out of the gate once the overall markets can find their footing. Below could be a good example of that with the chart of APP and how it appeared in our 12/1 Technology Note. Now this name is still 19% off most recent 52 week highs (just a couple of weeks ago), but I noticed how the stock did not buckle on 11/30, rising 1% as the IGV slipped 2.7% (for the week APP rose 3.1% as the IGV fell 6.6%). Friday showed excellent relative strength advancing 3.5% in enormous volume, as the Nasdaq fell another 1.9%. It never took out the 86 stop on a CLOSING basis and we admired how it held not only the very round 90 number, but its rising 50 day SMA which was the scene of a prior cup base breakout as well. That was a "cluster of evidence", making the trade more "success prone", but be sure to honor stops as one always should.
Special Situations:
- Semiconductor play higher by 9% YTD and 17% over last one-year period. Dividend yield of .5%.
- Name 16% off most recent 52-week highs and stock is "old tech" which may help it in this volatile environment. If recaptures WEEKLY break above double bottom pivot of 83.19 would be a big positive.
- Earnings mostly lower down 2, 5.7, and 2.1% on 9/29, 7/1, and 1/8 (rose 4.8% on 4/1).
- Enter on pullback into 200 day SMA.
- Entry MU 80.25. Stop 75.50 (REPORTS 12/20 after close).
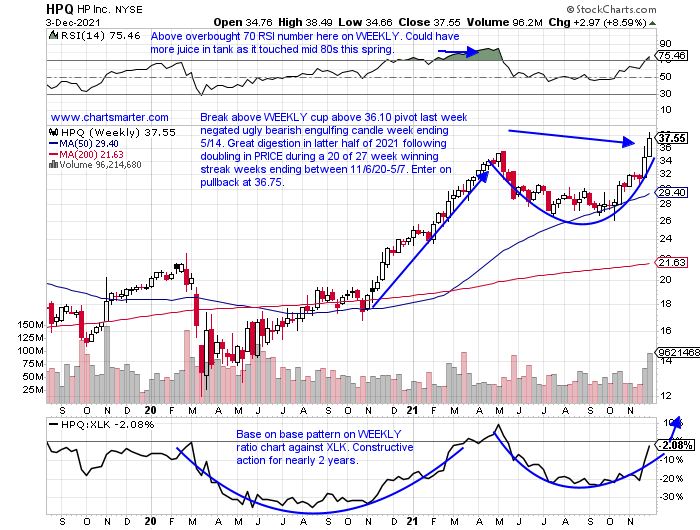
- "Old tech" hardware play higher by 53% YTD and 62% over last one-year period. Dividend yield of 2.7%.
- Name 2% off most recent all-time highs, displayed firm relative strength this week up 8.6% in double average WEEKLY trade after prior week rose 10%. Strong accumulation lately with 10% combined gain weeks ending between 10/15-22.
- Earnings mostly higher by 10.1, 2.8, 2.3, and 6.1% on 11/24, 2/26, 11/25/20, and 8/28/20 (fell .6 and 8.9% on 8/27, 5/28).
Enter on pullback into WEEKLY cup base breakout. - Entry HPQ 36.75. Stop 34.50.
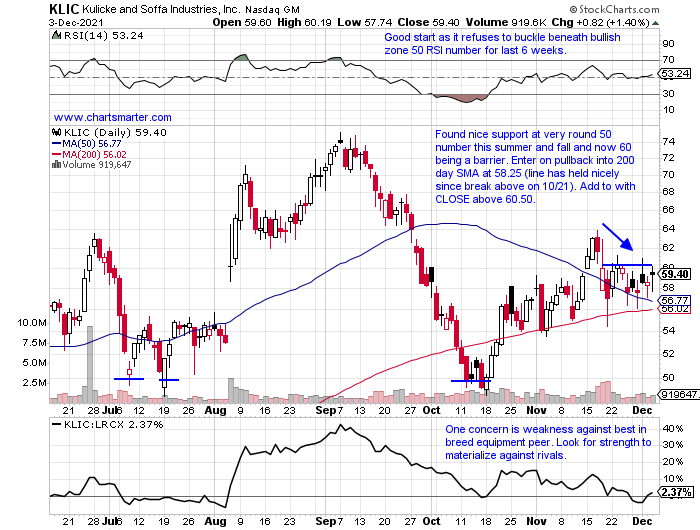
- Semiconductor equipment play up 87% YTD and 89% over last one-year period. Dividend yield of 1.1%.
- Name 21% off most recent 52-week highs (peers TXN LRCX and AMAT are 4, 7, and 8% off their own yearly peaks), but higher 6 of last 7 weeks. Trying to repair after 6-week losing streak, weeks ending between 9/10-10/15 that all CLOSED at lows for WEEKLY range.
- Earnings mixed with gains of 13.6 and 10.1% on 8/5 and 2/4 and losses of 2.8 and 10.1% on 11/18 and 5/6.
- Enter on pullback into 200 day SMA.
- Entry KLIC 58.25. Stop 55.50.
Good luck.
Entry summaries:
Buy pullback into 200 day SMA MU 80.25. Stop 75.50.
Buy pullback into WEEKLY cup base breakout HPQ 36.75. Stop 34.50.
Buy pullback into 200 day SMA KLIC 58.25. Stop 55.50.
This article requires a Chartsmarter membership. Please click here to join.
Technical Irrelevance:
- Sometimes technical analysis does not matter (Petr Pinkhasov quote this week), and I am a die-hard technician. That goes for fundamental work too in the current market environment where margin clerks could be very busy in a December month that they may not be accustomed to. With many caught mentally "offside" looking for a year-end rally institutions could be scrambling to unwind their previous stance, and that could further "unnerve" benchmarks. Of course, this applies to individual names more so as they can crater 30-50% where the indexes will lose 3-5%. Sure I am throwing numbers out there, but technical damage has been severe recently. Below is the chart of the Nasdaq as warning signs should have been put up with the big reversal on 11/22 with a bearish engulfing candle at all-time highs and quickly negating a bull flag breakout at the very round 16000 figure (our previous target originally in our 6/25 Technology Note). It held the 15000 number Friday, but the action has been wide and loose, hallmark bearish traits. I would have preferred tauter and less velocity in the move toward 15000.
VIX Speaking:
- When it comes to evaluating "risk" investors tend to look at many different factors. Put/call ratios, looking for relationships between staples and discretionary in the consumer space, or even just simple value versus growth. Below is another way to interpret it with the WEEKLY chart of the VIX. The instrument is on its first 3 week winning streak in 13 months and is demonstrating how markets like to confound the most. Last week rose more than 7% after the prior week gained nearly 60%, not a typo, although it did CLOSE off highs for the WEEKLY range. Market participants perhaps became complacent with PRICE pushing the VIX back after short-lived forays above its 50 day SMA throughout 2021. Could next week continue to feel the pain? Absolutely as markets can crater, and they will show signs before a huge move lower, as they have recently with weak breadth. I am keeping positions small in leaders in strong groups like DVN MRVL TTD and DHI. We can see violent moves to the upside in bearish market environments, but they will be on a tight leash as even generals will be shot if they overstay the welcome at the party.
Recent Examples:
- Investors should always keep an eye out for relative strength, especially on weak tapes. They are often a good tell going forward that they will be the first ones to potentially charge out of the gate once the overall markets can find their footing. Below could be a good example of that with the chart of APP and how it appeared in our 12/1 Technology Note. Now this name is still 19% off most recent 52 week highs (just a couple of weeks ago), but I noticed how the stock did not buckle on 11/30, rising 1% as the IGV slipped 2.7% (for the week APP rose 3.1% as the IGV fell 6.6%). Friday showed excellent relative strength advancing 3.5% in enormous volume, as the Nasdaq fell another 1.9%. It never took out the 86 stop on a CLOSING basis and we admired how it held not only the very round 90 number, but its rising 50 day SMA which was the scene of a prior cup base breakout as well. That was a "cluster of evidence", making the trade more "success prone", but be sure to honor stops as one always should.
Special Situations:
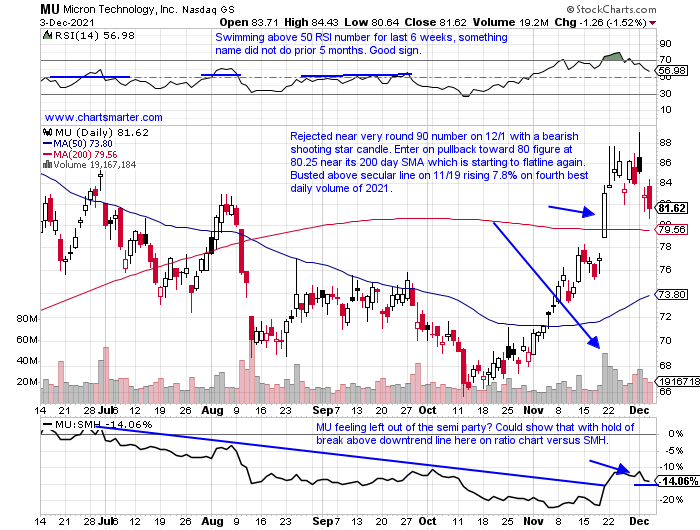
- Semiconductor play higher by 9% YTD and 17% over last one-year period. Dividend yield of .5%.
- Name 16% off most recent 52-week highs and stock is "old tech" which may help it in this volatile environment. If recaptures WEEKLY break above double bottom pivot of 83.19 would be a big positive.
- Earnings mostly lower down 2, 5.7, and 2.1% on 9/29, 7/1, and 1/8 (rose 4.8% on 4/1).
- Enter on pullback into 200 day SMA.
- Entry MU 80.25. Stop 75.50 (REPORTS 12/20 after close).
- "Old tech" hardware play higher by 53% YTD and 62% over last one-year period. Dividend yield of 2.7%.
- Name 2% off most recent all-time highs, displayed firm relative strength this week up 8.6% in double average WEEKLY trade after prior week rose 10%. Strong accumulation lately with 10% combined gain weeks ending between 10/15-22.
- Earnings mostly higher by 10.1, 2.8, 2.3, and 6.1% on 11/24, 2/26, 11/25/20, and 8/28/20 (fell .6 and 8.9% on 8/27, 5/28).
Enter on pullback into WEEKLY cup base breakout. - Entry HPQ 36.75. Stop 34.50.
- Semiconductor equipment play up 87% YTD and 89% over last one-year period. Dividend yield of 1.1%.
- Name 21% off most recent 52-week highs (peers TXN LRCX and AMAT are 4, 7, and 8% off their own yearly peaks), but higher 6 of last 7 weeks. Trying to repair after 6-week losing streak, weeks ending between 9/10-10/15 that all CLOSED at lows for WEEKLY range.
- Earnings mixed with gains of 13.6 and 10.1% on 8/5 and 2/4 and losses of 2.8 and 10.1% on 11/18 and 5/6.
- Enter on pullback into 200 day SMA.
- Entry KLIC 58.25. Stop 55.50.
Good luck.
Entry summaries:
Buy pullback into 200 day SMA MU 80.25. Stop 75.50.
Buy pullback into WEEKLY cup base breakout HPQ 36.75. Stop 34.50.
Buy pullback into 200 day SMA KLIC 58.25. Stop 55.50.