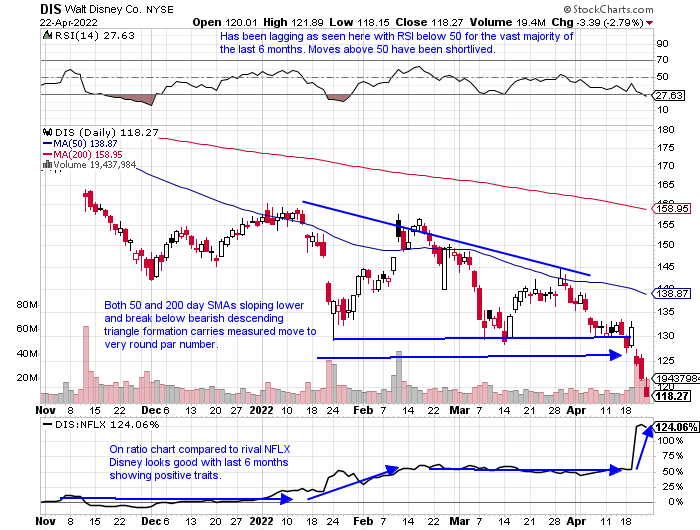
DIS:
- Name now 37% off most recent 52-week highs (NFLX 69% off its annual peak).
- Stock lost 9.3% last week in second-largest WEEKLY volume of 2022 so far, its third WEEKLY loss of 9% since last November. On 5-week losing streak (first such streak since September-October 2020), has declined 8 of the last 9 weeks.
- Could see this name traveling toward very round par number this summer.
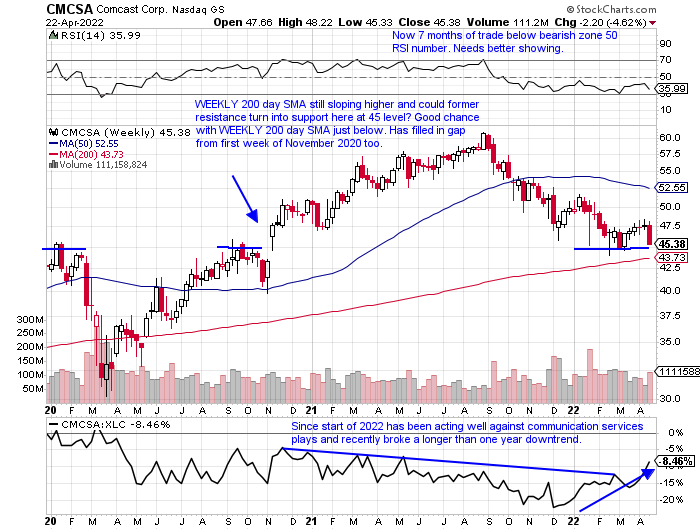
CMCSA:
- Name 27% off most recent 52 week highs (peer DISH 35% off its own annual peak).
- Fell 4.6% last week tied for its worst WEEKLY loss of 2022 with week ending 3/11 that lost same amount. Lower highs being made from last September on WEEKLY chart below, but could be starting to build right side of cup base pattern.
- WEEKLY CLOSE below 45 sees the round 40 number fairly quickly.
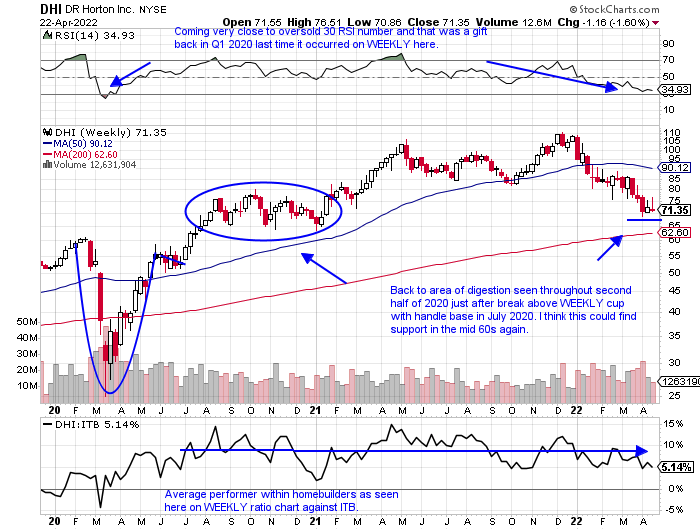
DHI:
- Name 35% off most recent 52-week highs, in line with peers LEN and PHM traded about same from their yearly peaks.
- Bit of weak relative strength last week lower by 1.6% and the ITB fell by .5%. Has declined 4 of the last 5 weeks with ALL five CLOSING at or in the lower half of the WEEKLY range.
- Needs to hold this area here or move back toward upward sloping WEEKLY 200 day SMA could be in play.
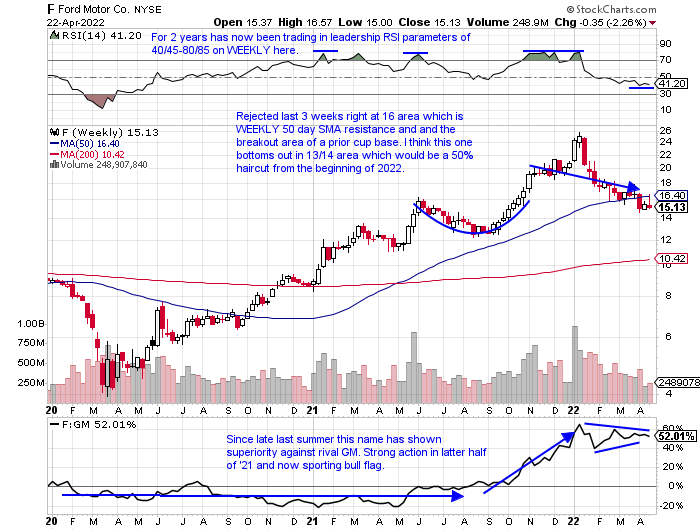
F:
- Name 42% off most recent 52-week highs while GM is down by 41%. Give credit for F not eliminating dividend like GM did.
- Since bearish evening star WEEKLY pattern completed the week ending 1/21 slumping 18% it has made the bearish habit of CLOSING in lower end of WEEKLY range. First time below WEEKLY 50 day SMA since fall of 2020.
- Needs to get back above WEEKLY 50 day SMA promptly.
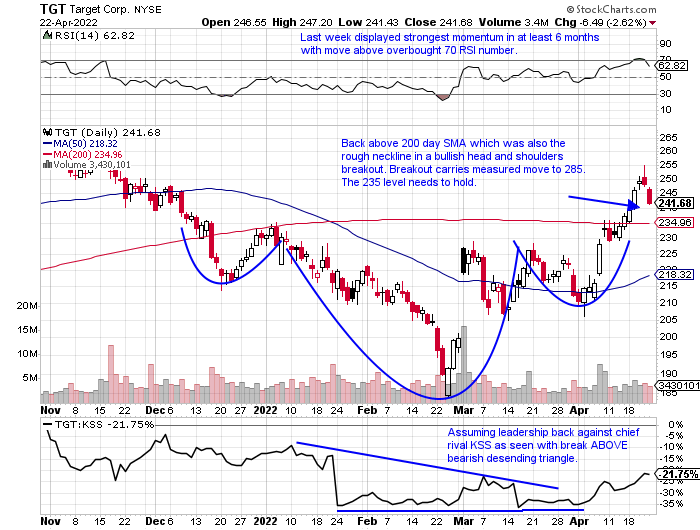
TGT:
- TGT up 4% YTD and sports dividend yield of 1.5% (KSS up 16% YTD and yielding 3.5%). WMT attractive too up 8% YTD.
- TGT nice recent action with 3 WEEKLY gains of 12.5, 9.3, and 10.8% since week ending 3/4. Good relative strength up 1.9% last week (albeit did CLOSE in lower half of WEEKLY range) while XLY fell 1.4%.
- The 235 area needs to hold would be successful retest of inverse head and shoulders and could see name travel toward round 300 number into year-end.
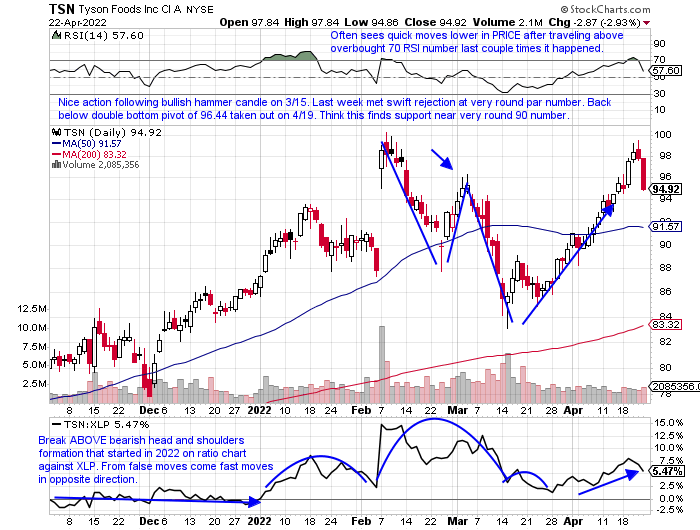
TSN:
- TSN up 9% YTD and sports dividend yield of 1.9% compared to PPC down 3% YTD with no dividend yield.
- TSN 6% off most recent 52-week highs after rejection at very round par number. Could look to retest very round 90 number which would be retest of 50 day SMA for initial time following the breakout (peer PPC failing after upside gap fill from 2/17 session).
- WEEKLY chart shows spinning top candle and shooting star weeks ending 2/11 and last week at 100. Bulls do not want to see that become double top.
CVX:
- Very similar runs for XLE heavyweights with CVX up 37% YTD and XOM up 39% (XOM yields 4.1% compared to CVX 3.5%).
- XOM 8% off most recent 52-week highs with CVX down 7% from its own annual peak. Last week CVX displayed relative weakness down 6.1% as XLE fell 4.5% (XOM lost "just" 3.1%).
- If XOM falls below 158 could see move to 140 area, prior break above bull flag, quickly.

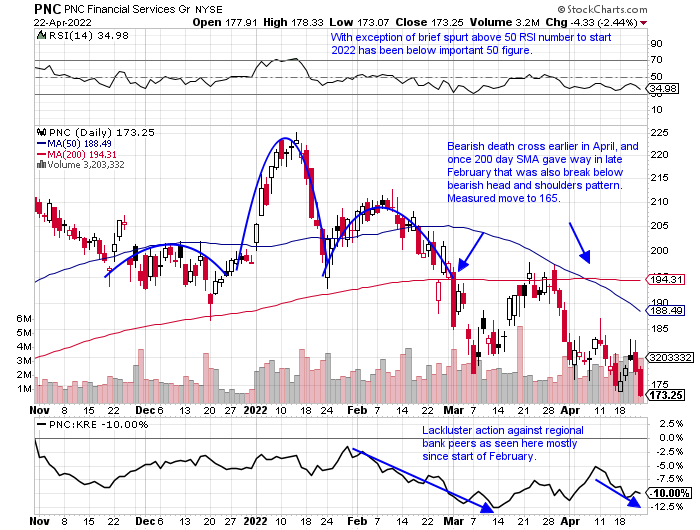
PNC:
- Name 24% off most recent 52-week highs, while the KRE is 18% off its annual peak.
- Poor relative strength last week with PNC down 1% while KRE was higher by .3%. Interesting KRE has CLOSED the last 3 weeks very tautly all within just .30 of each other, most likely confirming more downside ahead.
- Look for PNC to travel toward 165 in a measured move from break below bearish head and shoulders pattern.
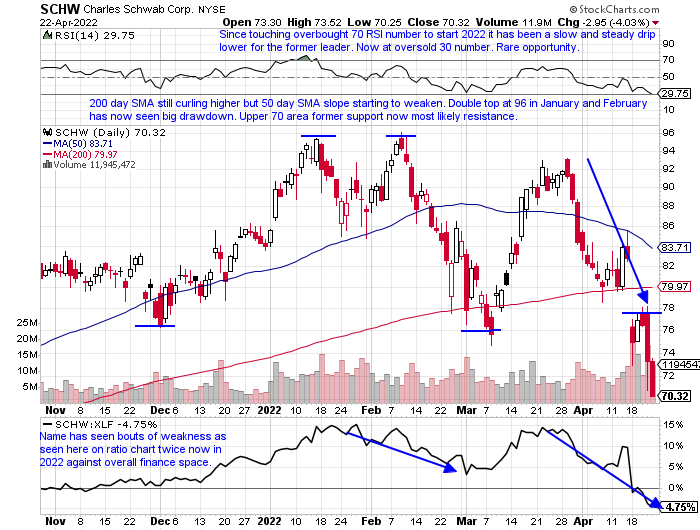
SCHW:
- SCHW lower by 16% YTD with peer MS down by 14% (SCHW dividend yield of 1.1% compared to MS of 3.3%).
- Last week SCHW demonstrated awful relative strength down 15.1% in largest WEEKLY volume since week ending 10/6/20 (MS was UNCH for the week). Most concerning SCHW off a rapid 27% from all-time highs made this February.
- Rough prior range between 76-96 now likely resistance going forward (was prior support).
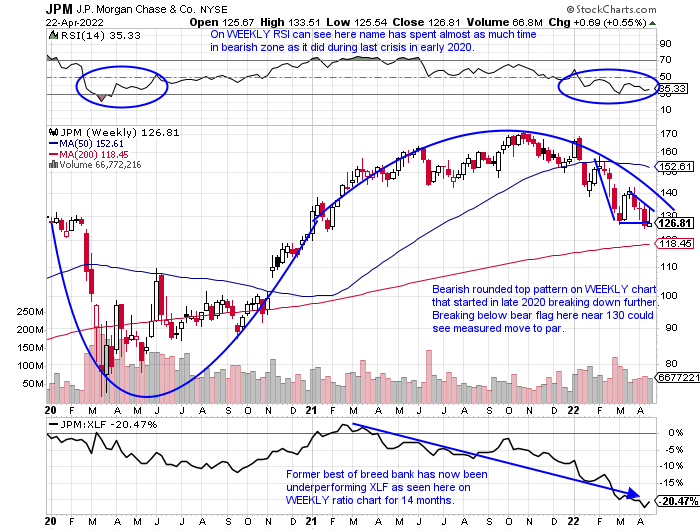
JPM:
- Former best of breed name JPM down 20% YTD while WFC is lower by 3%. Better yield goes to JPM 3.1% compared to WFC AT 2.2%).
- Last week JPM rose by .6% as the XLK fell 2% (WFC was UNCH). BAC is also notable now lower 9 of last 11 weeks.
- Rounded top breakdown pivot forming in conjunction with prior WEEKLY cup base breakout. Pivotal area to hold near here.
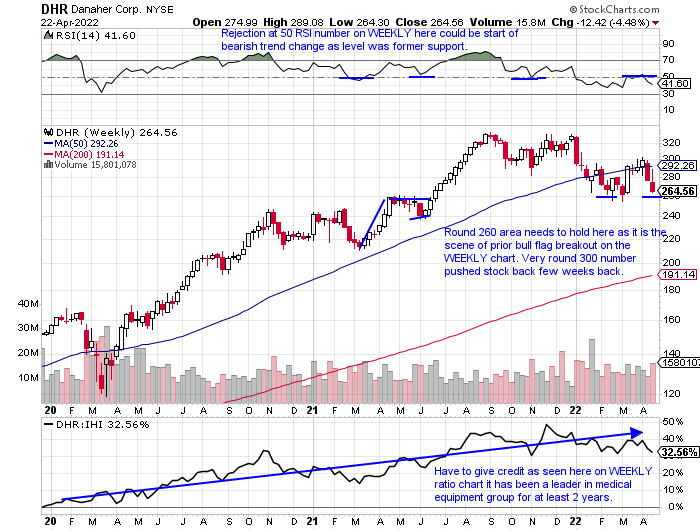
DHR:
- DHR lower by 20% YTD and carries dividend yield of .4%. IHI lower by 12% and slightly larger dividend yield of .7%.
- DHR starting to lag group a bit now 21% off most recent 52-week highs, while the IHI is lower by 14% from its annual peak. Concerning with IHI recording bearish WEEKLY shooting star candle last week above its 50 day SMA intraweek but CLOSING back below it. Now 14 consecutive weeks below moving average.
- The 260 area, an area of prior resistance and now support has to hold here.
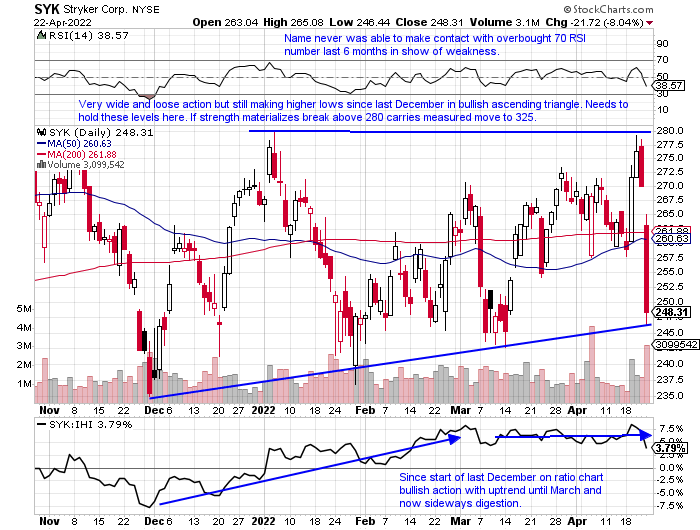
SYK:
- Name lower by 7% YTD, good relative strength with IHI off 12% in 2022 thus far (SYK dividend yield of 1.1% higher than IHI).
- Huge outside week for SYK last week CLOSING more than 30 handles off intraweek highs. Has been bobbing above and below WEEKLY 50 day SMA, although more weeks have been below the line.
- Name needs to hold right here or bullish ascending triangle gingerly in place is not longer viable.
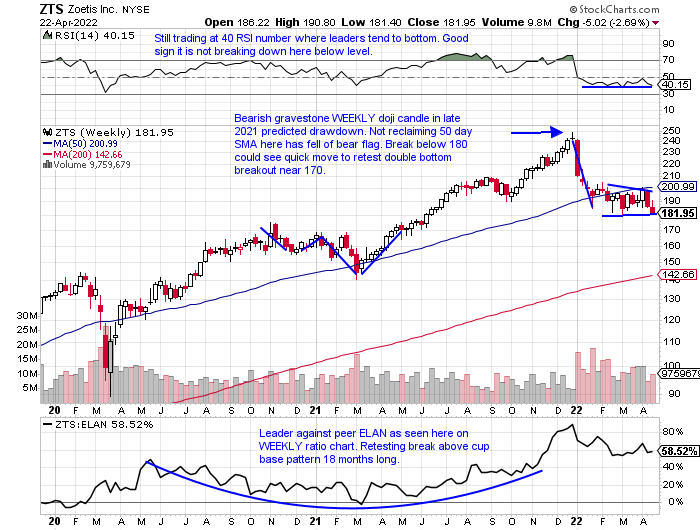
ZTS:
- ZTS lower by 25% YTD with peer ELAN off by just 11% (ZTS dividend yield of .7% while ELAN does not have one).
- PPH recorded the strongest 2-week drawdown since March 2020 with combined loss of 6.9%. ZTS lost 2.8% last week with ELAN, animal peer dropping a bit more by 3.6%.
- ZTS needs to hold this level of break below flag sees a measured move lower of 70 handles.
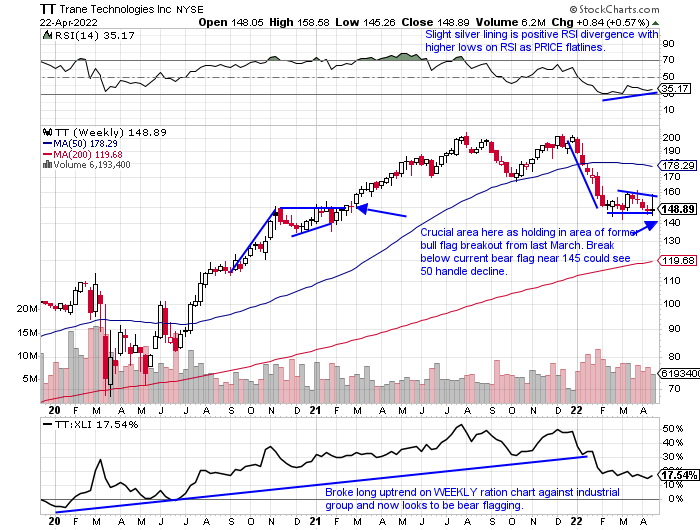
TT:
- TT is down 26% YTD with the XLI off just 7%. TT carries slightly higher dividend yield of 1.8% compared to XLI of 1.4%.
- Good relative strength last week for TT up .6% with XLI falling 1.5%. TT is lower by 28% from highs made late last year as XLI is off just 9% from its annual peak.
- TT must hold this level or could see measured move to very round par number.
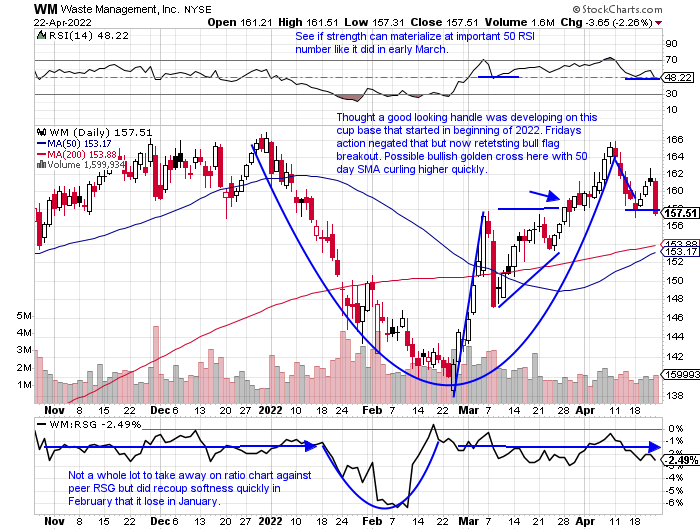
WM:
- Name lower by 6% YTD inline with peers RSG off 5% (dividend yields similar as well with WM of 1.6 and RSG 1.4%).
- looking at how far each is off their 52-week highs WM is 6% from its and RSG 9%. Last week WM showed some "relative strength" losing 1.1% as XLI slipped 1.5%.
- Concerns of double top near 166 area and needs to hold retest of recent bull flag breakout here.
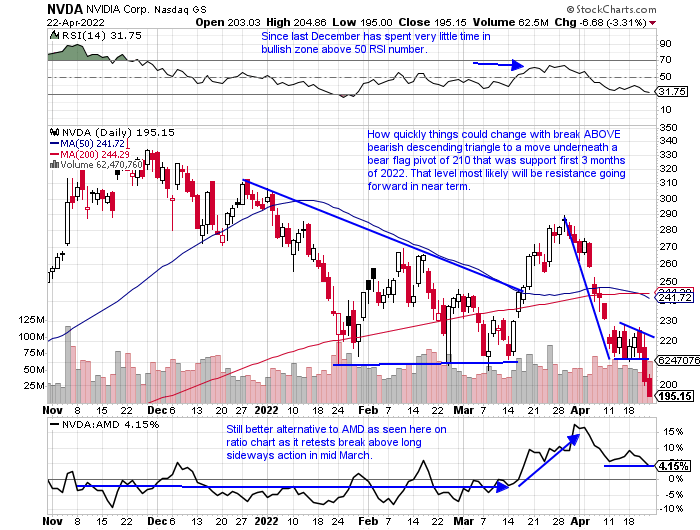
NVDA:
- Amazing how far these leaders have fallen with NVDA down 34% YTD (AMD now 39%). NVDA fractional dividend yield of .1%.
- NVDA is now 44% from its most recent 52-week highs (AMD 46 from its annual peak), neither with 2:1 split. Poor relative strength with NVDA down 8.2% last week and SMH off "just" 1.5%.
- Concern is the 210 level of the bear flag breakdown will be a wall going forward to break back above.
QCOM:
- QCOM down 27% YTD, slightly better than SMH off 24%. QCOM dividend yield of 2.3% compared to SMH of .7%.
- QCOM somewhat in line down 27% from most recent 52-week highs as SMH is 24%. Last week QCOM fell 3% double that of SMH which gave up 1.5%.
- If name can muster some strength could be good place to add as gap is now filled from last November.

V:
- V is down 4% YTD with peer 3% and very similar dividend yields with V at .7% and MA at .6%.
- V is now 18% off its most recent 52-week highs (and further from its 200 day SMA than V) with MA now 13% off its own. Last week V fell 2.1% and MA lost 1.8%.
- Concern is inability for name to remain above 200 day SMA which is now sloping lower.

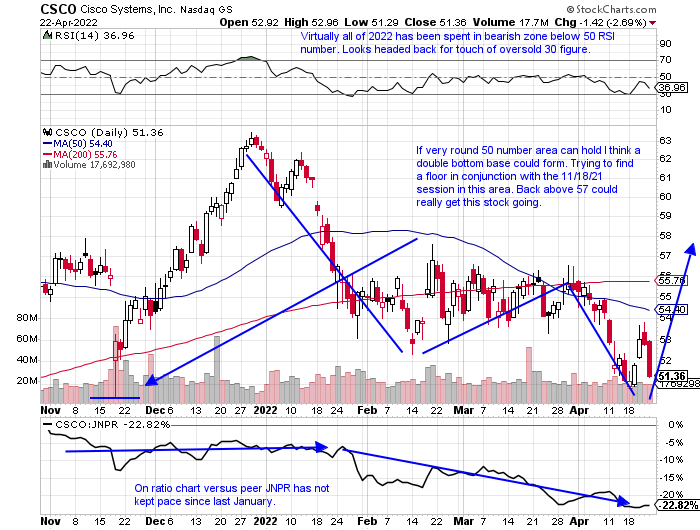
CSCO:
- Mega cap tech name down 19% YTD and carries dividend yield of 3% (peer JNPR down 2% YTD and yielding 1.6%).
- CSCO 20% off most recent 52-week highs, but did display relative strength last week up .4% as XLK fell 2.4%. Capital is being deployed again to old tech like IBM and HPQ.
- I am constructive on this name above very round 50 number as I think double bottom base is going to play out going forward.
ECL:
- ECL lower by 25% YTD and sports dividend yield of 1.2%.
- ECL 27% off most recent 52 week highs with XLB 7% off its, although XLB did register yet another rejection at very round 90 number and recorded its third-largest WEEKLY loss last week falling almost 4% (larger WEEKLY declines recorded weeks ending 1/21 and 6/18/21 which fell 5.4 and 6.2% respectively).
- Spending much more time now below its WEEKLY 200 day SMA than it did back in March 2020 in depths of huge overall market sell-off.

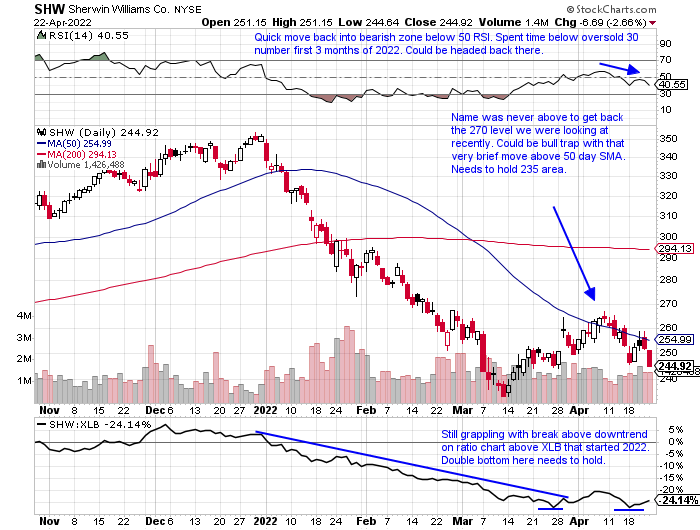
SHW:
- SHW lower by 30% YTD and sports dividend yield of 1%, while XLB is down 5% in 2022 and yields 1.7%.
- SHW 31% from its most recent 52-week highs with XLB off just 7%. SHW did fall less last week than XLB, off by 3.1% as the ETF lost 3.7%.
- Concern is break back below 50 day SMA so quickly after recovering is downtrend will resume now in swift fashion.
This article requires a Chartsmarter membership. Please click here to join.
DIS:
- Name now 37% off most recent 52-week highs (NFLX 69% off its annual peak).
- Stock lost 9.3% last week in second-largest WEEKLY volume of 2022 so far, its third WEEKLY loss of 9% since last November. On 5-week losing streak (first such streak since September-October 2020), has declined 8 of the last 9 weeks.
- Could see this name traveling toward very round par number this summer.
CMCSA:
- Name 27% off most recent 52 week highs (peer DISH 35% off its own annual peak).
- Fell 4.6% last week tied for its worst WEEKLY loss of 2022 with week ending 3/11 that lost same amount. Lower highs being made from last September on WEEKLY chart below, but could be starting to build right side of cup base pattern.
- WEEKLY CLOSE below 45 sees the round 40 number fairly quickly.
DHI:
- Name 35% off most recent 52-week highs, in line with peers LEN and PHM traded about same from their yearly peaks.
- Bit of weak relative strength last week lower by 1.6% and the ITB fell by .5%. Has declined 4 of the last 5 weeks with ALL five CLOSING at or in the lower half of the WEEKLY range.
- Needs to hold this area here or move back toward upward sloping WEEKLY 200 day SMA could be in play.
F:
- Name 42% off most recent 52-week highs while GM is down by 41%. Give credit for F not eliminating dividend like GM did.
- Since bearish evening star WEEKLY pattern completed the week ending 1/21 slumping 18% it has made the bearish habit of CLOSING in lower end of WEEKLY range. First time below WEEKLY 50 day SMA since fall of 2020.
- Needs to get back above WEEKLY 50 day SMA promptly.
TGT:
- TGT up 4% YTD and sports dividend yield of 1.5% (KSS up 16% YTD and yielding 3.5%). WMT attractive too up 8% YTD.
- TGT nice recent action with 3 WEEKLY gains of 12.5, 9.3, and 10.8% since week ending 3/4. Good relative strength up 1.9% last week (albeit did CLOSE in lower half of WEEKLY range) while XLY fell 1.4%.
- The 235 area needs to hold would be successful retest of inverse head and shoulders and could see name travel toward round 300 number into year-end.
TSN:
- TSN up 9% YTD and sports dividend yield of 1.9% compared to PPC down 3% YTD with no dividend yield.
- TSN 6% off most recent 52-week highs after rejection at very round par number. Could look to retest very round 90 number which would be retest of 50 day SMA for initial time following the breakout (peer PPC failing after upside gap fill from 2/17 session).
- WEEKLY chart shows spinning top candle and shooting star weeks ending 2/11 and last week at 100. Bulls do not want to see that become double top.
CVX:
- Very similar runs for XLE heavyweights with CVX up 37% YTD and XOM up 39% (XOM yields 4.1% compared to CVX 3.5%).
- XOM 8% off most recent 52-week highs with CVX down 7% from its own annual peak. Last week CVX displayed relative weakness down 6.1% as XLE fell 4.5% (XOM lost "just" 3.1%).
- If XOM falls below 158 could see move to 140 area, prior break above bull flag, quickly.
PNC:
- Name 24% off most recent 52-week highs, while the KRE is 18% off its annual peak.
- Poor relative strength last week with PNC down 1% while KRE was higher by .3%. Interesting KRE has CLOSED the last 3 weeks very tautly all within just .30 of each other, most likely confirming more downside ahead.
- Look for PNC to travel toward 165 in a measured move from break below bearish head and shoulders pattern.
SCHW:
- SCHW lower by 16% YTD with peer MS down by 14% (SCHW dividend yield of 1.1% compared to MS of 3.3%).
- Last week SCHW demonstrated awful relative strength down 15.1% in largest WEEKLY volume since week ending 10/6/20 (MS was UNCH for the week). Most concerning SCHW off a rapid 27% from all-time highs made this February.
- Rough prior range between 76-96 now likely resistance going forward (was prior support).
JPM:
- Former best of breed name JPM down 20% YTD while WFC is lower by 3%. Better yield goes to JPM 3.1% compared to WFC AT 2.2%).
- Last week JPM rose by .6% as the XLK fell 2% (WFC was UNCH). BAC is also notable now lower 9 of last 11 weeks.
- Rounded top breakdown pivot forming in conjunction with prior WEEKLY cup base breakout. Pivotal area to hold near here.
DHR:
- DHR lower by 20% YTD and carries dividend yield of .4%. IHI lower by 12% and slightly larger dividend yield of .7%.
- DHR starting to lag group a bit now 21% off most recent 52-week highs, while the IHI is lower by 14% from its annual peak. Concerning with IHI recording bearish WEEKLY shooting star candle last week above its 50 day SMA intraweek but CLOSING back below it. Now 14 consecutive weeks below moving average.
- The 260 area, an area of prior resistance and now support has to hold here.
SYK:
- Name lower by 7% YTD, good relative strength with IHI off 12% in 2022 thus far (SYK dividend yield of 1.1% higher than IHI).
- Huge outside week for SYK last week CLOSING more than 30 handles off intraweek highs. Has been bobbing above and below WEEKLY 50 day SMA, although more weeks have been below the line.
- Name needs to hold right here or bullish ascending triangle gingerly in place is not longer viable.
ZTS:
- ZTS lower by 25% YTD with peer ELAN off by just 11% (ZTS dividend yield of .7% while ELAN does not have one).
- PPH recorded the strongest 2-week drawdown since March 2020 with combined loss of 6.9%. ZTS lost 2.8% last week with ELAN, animal peer dropping a bit more by 3.6%.
- ZTS needs to hold this level of break below flag sees a measured move lower of 70 handles.
TT:
- TT is down 26% YTD with the XLI off just 7%. TT carries slightly higher dividend yield of 1.8% compared to XLI of 1.4%.
- Good relative strength last week for TT up .6% with XLI falling 1.5%. TT is lower by 28% from highs made late last year as XLI is off just 9% from its annual peak.
- TT must hold this level or could see measured move to very round par number.
WM:
- Name lower by 6% YTD inline with peers RSG off 5% (dividend yields similar as well with WM of 1.6 and RSG 1.4%).
- looking at how far each is off their 52-week highs WM is 6% from its and RSG 9%. Last week WM showed some "relative strength" losing 1.1% as XLI slipped 1.5%.
- Concerns of double top near 166 area and needs to hold retest of recent bull flag breakout here.
NVDA:
- Amazing how far these leaders have fallen with NVDA down 34% YTD (AMD now 39%). NVDA fractional dividend yield of .1%.
- NVDA is now 44% from its most recent 52-week highs (AMD 46 from its annual peak), neither with 2:1 split. Poor relative strength with NVDA down 8.2% last week and SMH off "just" 1.5%.
- Concern is the 210 level of the bear flag breakdown will be a wall going forward to break back above.
QCOM:
- QCOM down 27% YTD, slightly better than SMH off 24%. QCOM dividend yield of 2.3% compared to SMH of .7%.
- QCOM somewhat in line down 27% from most recent 52-week highs as SMH is 24%. Last week QCOM fell 3% double that of SMH which gave up 1.5%.
- If name can muster some strength could be good place to add as gap is now filled from last November.
V:
- V is down 4% YTD with peer 3% and very similar dividend yields with V at .7% and MA at .6%.
- V is now 18% off its most recent 52-week highs (and further from its 200 day SMA than V) with MA now 13% off its own. Last week V fell 2.1% and MA lost 1.8%.
- Concern is inability for name to remain above 200 day SMA which is now sloping lower.
CSCO:
- Mega cap tech name down 19% YTD and carries dividend yield of 3% (peer JNPR down 2% YTD and yielding 1.6%).
- CSCO 20% off most recent 52-week highs, but did display relative strength last week up .4% as XLK fell 2.4%. Capital is being deployed again to old tech like IBM and HPQ.
- I am constructive on this name above very round 50 number as I think double bottom base is going to play out going forward.
ECL:
- ECL lower by 25% YTD and sports dividend yield of 1.2%.
- ECL 27% off most recent 52 week highs with XLB 7% off its, although XLB did register yet another rejection at very round 90 number and recorded its third-largest WEEKLY loss last week falling almost 4% (larger WEEKLY declines recorded weeks ending 1/21 and 6/18/21 which fell 5.4 and 6.2% respectively).
- Spending much more time now below its WEEKLY 200 day SMA than it did back in March 2020 in depths of huge overall market sell-off.
SHW:
- SHW lower by 30% YTD and sports dividend yield of 1%, while XLB is down 5% in 2022 and yields 1.7%.
- SHW 31% from its most recent 52-week highs with XLB off just 7%. SHW did fall less last week than XLB, off by 3.1% as the ETF lost 3.7%.
- Concern is break back below 50 day SMA so quickly after recovering is downtrend will resume now in swift fashion.